

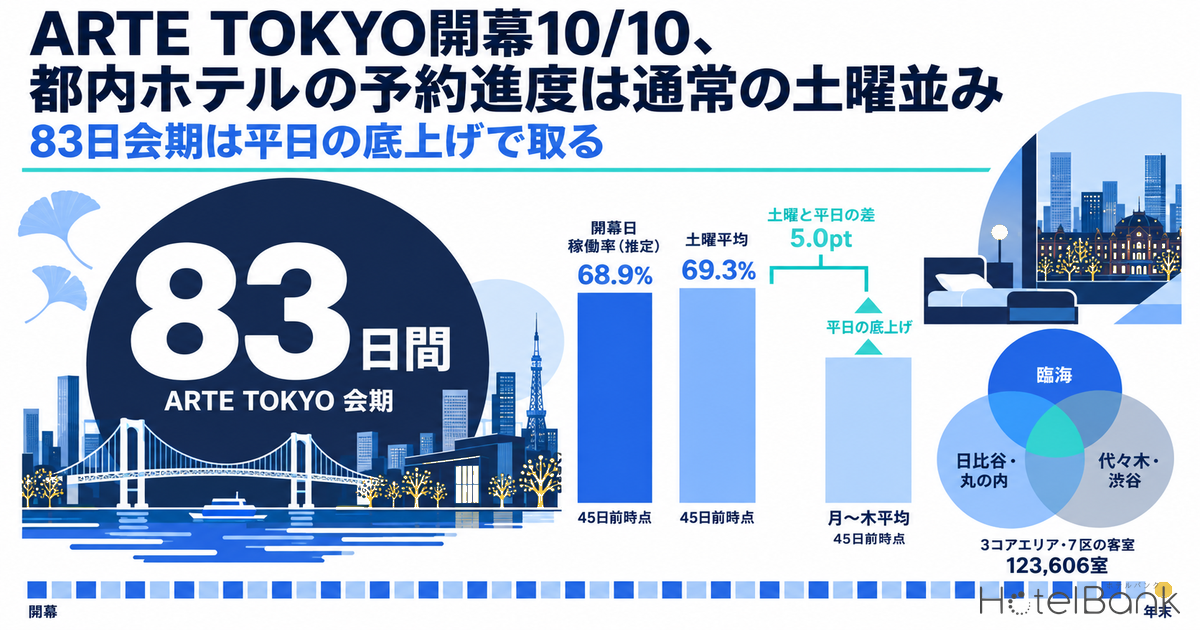
ARTE TOKYO (Tokyo International Culture and Arts Festival), a new culture and arts festival organised by the Tokyo Metropolitan Government and the Tokyo International Culture and Arts Festival Executive Committee, runs from Saturday, October 10 to Thursday, December 31, 2026 — 83 days in all. It centres on three core areas — the Waterfront (Rinkai), Hibiya/Marunouchi and Yoyogi/Shibuya — and in the Waterfront area the international art exhibition TOKYO ATLAS runs for 72 days, from October 10 to December 20. This article overlays the room stock of the seven Tokyo wards that the three core areas span, estimated settled ADR for October–December, and booking curves to read how a festival this long shapes hotel demand in Tokyo. The conclusion first: booking pace for the opening weekend is in line with an ordinary Saturday, and demand is not concentrated on any particular date. The 83-day run is not a scramble for one peak night; it is a contest over how far hotels can lift weekday occupancy and rates.
Metric Definitions Used in This Article
- ADR (average daily rate): Estimated settled rate (tax-excluded equivalent), calculated by applying a segment-specific adjustment factor to the lowest plan level each property publishes on OTAs (per room, 2 guests, tax included). Checked against property-level results disclosed by listed hotel REITs (91 properties, most recent 3 months), the median error is about 7%. These are estimates and differ from each property’s actual settled prices and accounting figures. Area-level ADR is the median across the properties covered (the level of a typical property in the area).
- Listed price: Per-room rate for 2 guests (tax included), averaged across all plans. In this article it is used for the daily price index and the price bands on the map, and is a separate series from ADR.
- OCC (occupancy): Share of sold rooms in total rooms in an area (estimate based on OTA sales inventory). In this article it is written as “occupancy (OTA-listed inventory basis, estimated)”. It is an estimate based on how OTA-sold inventory is absorbed and differs from a property’s actual overall occupancy.
- Booking curve / LT: Booking curve = how remaining OTA inventory changes as the check-in date approaches. LT (lead time) = days before check-in (LT0 = day of stay). This article uses only observations at LT45 or less.
- Data source: MetroEngines Research (survey date: September 27, 2026)
- — 83 days and 72 days: ARTE TOKYO runs October 10 – December 31, 2026, and TOKYO ATLAS in the Waterfront area October 10 – December 20. The seven wards spanned by the three core areas hold 936 properties / 123,606 rooms on sale during the festival.
- — Opening day is an ordinary Saturday: Tokyo occupancy (estimated) for October 10 stood at 68.9% 45 days out — almost identical to the 69.3% average for Saturdays from October to early November, so demand is not skewed toward opening day (886 properties / 107,033 rooms).
- — Saturday vs. weekday gap of 5.0pt: 45 days out, the Saturday average is 69.3% versus 64.3% for Monday–Thursday excluding holidays and holiday eves. With a run this long, capturing weekday demand decides revenue for the whole period.
- — Only 2,713 rooms within walking distance of the Waterfront venues: Rooms within 1km of a venue total 12 properties / 2,713 rooms in the Waterfront area versus 77 properties / 13,371 rooms in Hibiya/Marunouchi. The Waterfront leaves room for hotels in Ariake, Tennozu and Shinagawa to capture visitors moving between venues.
- — Early-to-mid-December weekdays are the trough: The daily listed-price index (run average = 100, N=834 properties) averages 85.4 for Monday–Thursday, December 1–18 — the lowest of the run. Pricing in this period, before TOKYO ATLAS closes, is where the upside lies.
ARTE TOKYO and TOKYO ATLAS — Dates and Venues
First, the facts of the event from official announcements. The Tokyo Metropolitan Government announced ARTE TOKYO in April 2026 and released the programme line-up on July 2, 100 days before opening. According to the July 2 press release, the festival runs from Saturday, October 10 to Thursday, December 31, 2026, organised by the Tokyo Metropolitan Government and the Tokyo International Culture and Arts Festival Executive Committee and co-organised by the Tokyo Metropolitan Foundation for History and Culture. It is positioned as a “city-wide festival” bundling art, theatre, music, illuminations and entertainment, with partner programmes across Tokyo running alongside the three core areas throughout the festival.
TOKYO ATLAS, the international art exhibition at the heart of the Waterfront area, runs for 72 days from Saturday, October 10 to Sunday, December 20, 2026, according to the Tokyo Metropolitan Government’s announcement of December 4, 2025. Its venues are split across three districts: Daiba (Daiba Park, Odaiba Marine Park), Aomi (Aomi Minami Futo Park, Telecom Center Building) and Tennozu (WHAT MUSEUM, Isle Shinagawa). Hibiya/Marunouchi will host illuminations along the streets running from Marunouchi to Yurakucho and Hibiya and art programmes on the KK Line (the former Tokyo Expressway), while Yoyogi/Shibuya plans to turn Yoyogi Park into an art space, mainly at night, with projects hubbed around the former Kodomo no Shiro (National Children’s Castle) site.
| Core area | Main venues / programmes | Period |
|---|---|---|
| Waterfront (Rinkai) | International art exhibition TOKYO ATLAS — Daiba (Daiba Park, Odaiba Marine Park), Aomi (Aomi Minami Futo Park, Telecom Center Building), Tennozu (WHAT MUSEUM, Isle Shinagawa). Also linked with illuminations, fountain shows, etc. | TOKYO ATLAS: 10/10–12/20 (72 days) |
| Hibiya/Marunouchi | Street illuminations from Marunouchi to Yurakucho and Hibiya, Hibiya Park, art and culture programmes on the KK Line (former Tokyo Expressway) | During the festival |
| Yoyogi/Shibuya | Yoyogi Park turned into a night-time art space, the area around the former Kodomo no Shiro site, linked with illuminations on Shibuya Koen-dori and Omotesando | During the festival |
| Overall | ARTE TOKYO (Tokyo International Culture and Arts Festival). Organisers: Tokyo Metropolitan Government, Tokyo International Culture and Arts Festival Executive Committee | 10/10–12/31 (83 days) |
Source: Compiled by HotelBank Editorial Team from Tokyo Metropolitan Government / Tokyo International Culture and Arts Festival Executive Committee, “ARTE TOKYO programme line-up announced” (July 2, 2026) and Tokyo Metropolitan Government, “International art exhibition TOKYO ATLAS” (December 4, 2025)
What matters for hotels is the shape of the run. It opens on the Sports Day three-day weekend (October 10–12), takes in the Labour Thanksgiving Day three-day weekend (November 21–23), and its illumination programmes continue to year-end even after TOKYO ATLAS closes on December 20. Unlike a one-off concert or fireworks display that moves rooms “for that night only”, it is designed for 12 weeks of circulating visits. As shown below, this character is clearly visible in the booking data.
Room Stock in the Three Core Areas — 123,606 Rooms Across Seven Wards
Mapped to wards, the Waterfront spans Minato (Daiba), Koto (Aomi, Ariake) and Shinagawa (Tennozu); Hibiya/Marunouchi spans Chiyoda plus neighbouring Chuo and Minato; and Yoyogi/Shibuya spans Shibuya plus neighbouring Shinjuku. Counting properties within MetroEngines Research’s coverage whose selling prices can be confirmed on at least 20 of the stay dates in the festival period (October 10 – December 31), the seven wards total 936 properties and 123,606 rooms.
| Ward | Related core area | Properties | Rooms | Average per property |
|---|---|---|---|---|
| Chiyoda | Hibiya/Marunouchi | 113 | 17,543 | ~155 rooms |
| Chuo | Hibiya/Marunouchi (adjacent) | 195 | 26,934 | ~138 rooms |
| Minato | Waterfront (Daiba) / Hibiya/Marunouchi (adjacent) | 198 | 31,527 | ~159 rooms |
| Shinagawa | Waterfront (Tennozu) | 62 | 8,651 | ~140 rooms |
| Koto | Waterfront (Aomi, Ariake) | 65 | 10,434 | ~161 rooms |
| Shibuya | Yoyogi/Shibuya | 95 | 6,658 | ~70 rooms |
| Shinjuku | Yoyogi/Shibuya (adjacent) | 208 | 21,859 | ~105 rooms |
| Seven-ward total | 936 | 123,606 | ~132 rooms |
Source: Compiled by HotelBank Editorial Team from MetroEngines Research (properties with selling prices confirmed on at least 20 stay dates during the festival; properties with no registered room count are counted in properties only)
By rooms, Minato is the deepest at 31,527, followed by Chuo (26,934), Shinjuku (21,859) and Chiyoda (17,543). Shibuya, by contrast, has 95 properties but only 6,658 rooms — small in scale relative to its property count. Yoyogi/Shibuya is dominated by small and mid-sized properties averaging about 70 rooms each, less than half of Minato’s roughly 159. On the Waterfront side, rooms in Koto (10,434) and Shinagawa (8,651) are carried by large city hotels and station-front business hotels.
Rooms Within Walking Distance of the Venues — Thin on the Waterfront, Deep in Hibiya
Ward totals alone do not show distance to the venues, so we counted properties within a 1km radius (about a 15-minute walk) and a 2km radius of each core area’s main venues. Distance is measured from any of the five venues for the Waterfront, from Hibiya Park and Marunouchi Naka-dori for Hibiya/Marunouchi, and from any of Yoyogi Park, the former Kodomo no Shiro site and Shibuya Station for Yoyogi/Shibuya.
| Core area (venues used for measurement) | Within 1km | Within 2km | Listed price, 1km | Listed price, 2km |
|---|---|---|---|---|
| Waterfront (5 venues in Daiba, Aomi, Tennozu) | 12 properties / 2,713 rooms | 50 properties / 14,629 rooms | ¥48,000 | ¥40,500 |
| Hibiya/Marunouchi (Hibiya Park, Marunouchi Naka-dori) | 77 properties / 13,371 rooms | 316 properties / 46,822 rooms | ¥53,300 | ¥38,800 |
| Yoyogi/Shibuya (Yoyogi Park, former Kodomo no Shiro site, Shibuya Station) | 62 properties / 4,419 rooms | 116 properties / 10,651 rooms | ¥49,300 | ¥45,800 |
Source: Compiled by HotelBank Editorial Team from MetroEngines Research (listed price = median of each property’s average listed price during the festival; 2 guests per room, tax included, all-plan average)
Hibiya/Marunouchi has 77 properties / 13,371 rooms within 1km alone, rising to 46,822 rooms within 2km. Rooms are clustered right at the venues, with plenty of locations where guests can view the evening illuminations and walk back. The Waterfront, by contrast, has only 12 properties / 2,713 rooms within 1km. Broken down, the 1km zone around the two Daiba venues holds 2 properties / 1,335 rooms and that around WHAT MUSEUM in Tennozu 10 properties / 1,378 rooms, while no properties with confirmed sales during the festival are found within 1km of Aomi Minami Futo Park or the Telecom Center Building. Widening to 2km raises the count to 50 properties / 14,629 rooms, bringing Ariake’s large hotels and the station areas of Shinagawa and Tennozu into range.
In other words, Waterfront visitors can be expected to stay not near the venues but “one or two stops away on the Yurikamome or Rinkai Line”. For properties in Ariake, Tennozu and Shinagawa, the very routes visitors take between TOKYO ATLAS venues can become a gateway for bookings (for how distance from a venue relates to occupancy, see our comparison of hotel supply around six exhibition venues). Yoyogi/Shibuya has 62 properties / 4,419 rooms within 1km, but because properties are small, its room count is only a third of Hibiya/Marunouchi’s.
Source: Compiled by HotelBank Editorial Team from MetroEngines Research (circle size = rooms, colour = average listed-price band during the festival; dashed circles = 1km radius from each venue; 479 properties)
Estimated Settled ADR for October–December — Peaking in October, Easing Toward December
Next, price levels. Lining up estimated settled ADR for the seven wards by month, the estimates — based on listed levels at the survey date — peak in October in every ward and ease gradually through November and December. Shibuya is the highest of the seven in October at about ¥34,600, followed by Chuo (about ¥24,200), Minato (about ¥24,000), Shinjuku (about ¥21,900) and Chiyoda (about ¥21,400). On the Waterfront side, Koto is about ¥20,200 and Shinagawa about ¥17,400.
Source: Compiled by HotelBank Editorial Team from MetroEngines Research (October–December 2026 are estimates based on listed levels at the survey date; markers show the average of finalised October–December 2025 values)
| Ward | Sep 2026 | Oct 2026 | Nov 2026 | Dec 2026 | Oct 2025 (final) | Nov 2025 (final) | Dec 2025 (final) | N |
|---|---|---|---|---|---|---|---|---|
| Chiyoda | ¥15,510 | ¥21,408 | ¥20,696 | ¥18,572 | ¥18,325 | ¥19,312 | ¥18,082 | 79 |
| Chuo | ¥17,146 | ¥24,239 | ¥23,433 | ¥21,392 | ¥20,870 | ¥23,036 | ¥20,926 | 151 |
| Minato | ¥17,697 | ¥24,014 | ¥22,235 | ¥20,596 | ¥19,598 | ¥19,921 | ¥19,189 | 127 |
| Shinagawa | ¥13,374 | ¥17,356 | ¥16,123 | ¥15,219 | ¥13,469 | ¥14,426 | ¥13,342 | 34 |
| Koto | ¥13,717 | ¥20,213 | ¥18,416 | ¥17,808 | ¥15,788 | ¥16,519 | ¥14,994 | 39 |
| Shibuya | ¥24,077 | ¥34,571 | ¥33,604 | ¥29,559 | ¥27,844 | ¥29,989 | ¥27,546 | 31 |
| Shinjuku | ¥14,654 | ¥21,889 | ¥21,260 | ¥19,761 | ¥17,049 | ¥18,828 | ¥17,502 | 96 |
Source: Compiled by HotelBank Editorial Team from MetroEngines Research (N = properties covered by the October 2026 estimated settled ADR)
Compared with finalised values for the same months a year earlier, the October 2026 estimates sit above the prior year in every ward. Minato, for example, is about ¥24,000 against about ¥19,600 in October 2025, and Shibuya about ¥34,600 against about ¥27,800. However, this compares estimates based on listed levels at the survey date with finalised values, so it is too early to read it as year-on-year growth. Comparing September, where stays are almost complete, the gaps are small: Minato about ¥17,700 (about ¥17,200 a year earlier) and Chiyoda about ¥15,500 (about ¥15,400). The further out the month, the more unsold high-priced plans weigh on the estimate, and levels may be revised as stay dates approach.
In the finalised 2025 pattern, November was the October–December peak in all seven wards, with a dip in December. October–November, the season for autumn leaves and outings, is a high-rate period in Tokyo even without ARTE TOKYO. The festival starts on top of already strong autumn demand and runs until early December, when demand settles. Put simply, rate upside is easiest in the first half of the run, while the demand-support effect matters most in the second half.
Daily Listed Prices Over 83 Days — Little Opening-Day Spike, a Trough on Early-December Weekdays
To check for demand skews invisible in monthly data, we converted each of the seven wards’ 834 properties’ daily listed prices during the festival into an index with “run average = 100” and plotted the median. If the event concentrated demand on specific dates, those dates’ index would spike.
Source: Compiled by HotelBank Editorial Team from MetroEngines Research (property median of a daily index setting each property’s average listed price during the festival to 100, N=834 properties; listed levels at the survey date, subject to change)
The index for opening day, Saturday, October 10, is 124.8. The following Saturdays, October 17 and October 24, are 121.5 and 122.4, so the opening-day premium over an ordinary Saturday is only about 3pt. The highest Saturday of the run is not opening day but November 21 (Saturday, first day of the Labour Thanksgiving Day three-day weekend) at 126.0. Apart from New Year’s Eve, December 31 (135.5), the peaks over the 83 days follow the calendar of Saturdays and three-day weekends, with no sign of prices being raised sharply for the festival’s opening.
| Month | Mon | Tue | Wed | Thu | Fri | Sat | Sun |
|---|---|---|---|---|---|---|---|
| October (from 10th) | 91.5 | 94.9 | 99.1 | 101.8 | 105.0 | 122.0 | 98.5 |
| November | 90.2 | 92.8 | 97.0 | 98.8 | 104.7 | 122.4 | 95.6 |
| December | 89.1 | 91.3 | 94.9 | 100.2 | 97.2 | 114.4 | 88.5 |
Source: Compiled by HotelBank Editorial Team from MetroEngines Research (average of the daily index by day of week; N=834 properties)
By day of week, Saturdays sit around 122 in both October and November and Mondays around 90 — a gap of over 30pt. December stands out. The Monday–Thursday index for December 1–18 averages 85.4, the lowest of the run, falling to around 80 from Sunday, December 6 to Tuesday, December 8. Given that TOKYO ATLAS runs until December 20 and the illumination programmes in Hibiya/Marunouchi and Yoyogi/Shibuya continue over the same period, these early-to-mid-December weekdays are the period of the run with the most room to add rate and occupancy.
Booking Curves — The Opening Weekend Is Pacing Like an Ordinary Saturday
Beyond price, we also check the pace at which inventory is absorbed. On an OTA-listed-inventory basis for Tokyo, covering 886 properties / 107,033 rooms (major booking sites), occupancy (estimated) for opening day, October 10, reached 68.9% 45 days out (LT45), 78.4% 30 days out and 88.3% at the survey date (LT14).
Source: Compiled by HotelBank Editorial Team from MetroEngines Research (Tokyo, all properties, 886 properties / 107,033 rooms, major booking sites; observations at LT45 or less only)
Overlaying the curves for the other October Saturdays, the 17th and 24th, the pace barely differs. Saturday, October 24 was at 70.5% 45 days out and 78.7% 30 days out — slightly ahead of opening day at the same lead times. That opening day, the first day of a three-day weekend, is filling at the same speed as an ordinary Saturday shows that bookings brought forward for the festival opening are not yet noticeable. Wednesday, October 14 also progressed from 62.4% 45 days out to 80.0% at the survey date (LT18), showing that weekday demand is solid.
The table below splits opening-day pace by segment. City hotels led at 82.1% 45 days out and reached 94.3% at the survey date. Business hotels gained the most from 65.4% 45 days out, +21.8pt, filling closer to the date. High-end luxury properties (listed at ¥100,000 or more) were at 77.2%, with more inventory to spare than other segments.
| Segment | Properties | Rooms | LT45 | LT30 | LT14 (survey date) | LT45→LT14 |
|---|---|---|---|---|---|---|
| All properties | 886 | 107,033 | 68.9% | 78.4% | 88.3% | +19.4pt |
| Business | 561 | 80,793 | 65.4% | 76.1% | 87.2% | +21.8pt |
| City | 54 | 16,495 | 82.1% | 87.6% | 94.3% | +12.2pt |
| Deluxe | 22 | 3,928 | 74.4% | 81.3% | 85.0% | +10.6pt |
| Luxury (listed ¥100,000+) | 47 | 3,465 | 68.5% | 73.3% | 77.2% | +8.7pt |
Source: Compiled by HotelBank Editorial Team from MetroEngines Research (Tokyo, major booking sites; luxury = properties listed at ¥100,000 or more, so the properties covered change by stay date)
A 5pt Saturday–Weekday Gap — Demand Is Spread Across the Whole Run
Beyond opening day, we line up daily pace for the first half of the run. For the 32 days from October 10 to November 10, we compared occupancy (estimated) at the same point, 45 days out, by segment. Coverage is 886 properties / 107,033 rooms in Tokyo (major booking sites), with the segment breakdown as in the table above.
Source: Compiled by HotelBank Editorial Team from MetroEngines Research (Tokyo, occupancy (estimated) 45 days before each stay date; major booking sites)
| Segment | Saturday avg. | Mon–Thu avg. | Gap |
|---|---|---|---|
| All properties | 69.3% | 64.3% | 5.0pt |
| Business | 66.1% | 61.4% | 4.8pt |
| City | 82.8% | 76.3% | 6.5pt |
| Deluxe | 73.7% | 71.8% | 1.9pt |
Source: Compiled by HotelBank Editorial Team from MetroEngines Research (average of 5 Saturdays and 15 Mondays–Thursdays excluding holidays and holiday eves, October 10 – November 10; 45 days out)
45 days out, the average of the five Saturdays was 69.3% and that of the 15 Mondays–Thursdays excluding holidays and holiday eves 64.3% — a gap of 5.0pt. Even for city hotels the gap is only 6.5pt, and for deluxe 1.9pt. Thursday, October 29 was at 71.4%, above Saturday, October 31 two days later (67.6%), so on some days weekday demand matches the weekend. By contrast, Sunday, November 1 to Wednesday, November 4 ran at 57.9–61.5% across all properties, the slowest pace of the period. These scattered weekdays around Culture Day (November 3) offer the most room to build occupancy during the run.
Stay dates from mid-November onward and in December were still more than 45 days out at the survey date. Inventory movements at that stage include the period before allotments are loaded and do not reflect booking pace accurately, so they are not used for comparison here. Pace for the November 21 three-day weekend and December weekends can be checked the same way from late October.
Lifting Weekdays Over an 83-Day Run — Three Opportunities
Taken together, the booking data show ARTE TOKYO not as “an event where demand rushes on one opening night” but as “an event that adds depth to visits over 12 weeks of autumn and winter”. The opportunities for hotels fall into three points.
First, package weekday multi-night stays and venue-hopping. TOKYO ATLAS is split across Daiba, Aomi and Tennozu, and ARTE TOKYO as a whole across three core areas, so it is not designed to be seen in a single day. Current bookings, with the Saturday–weekday occupancy gap at only about 5pt, show a steady number of visitors on weekdays during the run too. Weekday multi-night offers aimed at visitors touring the venues over two days or more are a good fit for adding occupancy.
Second, market locations one or two stops from the venues as a “base”. The Waterfront venues have only 2,713 rooms within a 1km walk, and there are no properties with confirmed sales during the festival around the Aomi venues. Properties in Ariake, Tennozu and Shinagawa within the 2km zone are well placed to pitch themselves as a base for stays that include travel between venues. Hibiya/Marunouchi has 13,371 rooms clustered within 1km, leaving room to differentiate with stay offers combined with the evening illuminations.
Third, protect weekday rates in early to mid-December. The daily listed-price index averages 85.4 for Monday–Thursday, December 1–18, the lowest of the run. TOKYO ATLAS continues until December 20, and illuminations in each area get into full swing at this time. Whether hotels can hold pricing at the same level as October–November weekdays in this period, while festival visitor demand remains, is the upside that will sway RevPAR for the whole run.
Frequently Asked Questions
Q. When and where is ARTE TOKYO held?
83 days, from Saturday, October 10 to Thursday, December 31, 2026. The three core areas are the Waterfront, Hibiya/Marunouchi and Yoyogi/Shibuya; in the Waterfront area, the international art exhibition TOKYO ATLAS runs for 72 days, October 10 – December 20, across the three districts of Daiba, Aomi and Tennozu (per announcements by the Tokyo Metropolitan Government and the Tokyo International Culture and Arts Festival Executive Committee).
Q. Are Tokyo hotels getting hard to book for the opening weekend?
As of the survey date (September 27), Tokyo occupancy (estimated) for opening day, October 10, was 68.9% 45 days out — tracking at the same level as the average for Saturdays from October to early November (69.3%). This is an estimate covering 886 properties / 107,033 rooms (major booking sites) and differs from actual overall occupancy.
Q. Which areas have rooms near the venues?
Hibiya/Marunouchi has deep supply, with 77 properties / 13,371 rooms within 1km of the venues. The Waterfront has few — 12 properties / 2,713 rooms within 1km — rising to 50 properties / 14,629 rooms when widened to 2km to include Ariake, Tennozu and Shinagawa.
Q. When during the festival do room rates tend to dip?
On the daily listed-price index for 834 properties in the seven wards (each property’s run average = 100), Monday–Thursday, December 1–18 averages 85.4, the lowest of the run, falling to around 80 from Sunday, December 6 to Tuesday, December 8. The highest Saturday of the run was not opening day but November 21 (126.0). All figures are listed levels at the survey date (September 27) and will change.
Q. Does opening-day booking pace differ by hotel segment?
Occupancy (estimated) for opening day, October 10, 45 days out was 82.1% for city hotels and 65.4% for business hotels. At the survey date (14 days out) it was 94.3% for city and 87.2% for business, with business hotels adding the most since 45 days out, +21.8pt. Luxury (listed at ¥100,000 or more) was at 77.2%, with inventory to spare (Tokyo, major booking sites).
Summary
At 83 days for ARTE TOKYO and 72 days for TOKYO ATLAS, the festival is unusually long for a Tokyo event. The seven wards spanned by the three core areas hold 936 properties and 123,606 rooms; Hibiya/Marunouchi has deep supply right at the venues, while Waterfront rooms are concentrated one or two stops away. Estimated settled ADR peaks in October and eases gradually toward December, and daily listed prices peak in line with the calendar of Saturdays and three-day weekends, with opening day not standing out on its own. The booking curves tell the same story: opening day is filling at the same speed as an ordinary Saturday, and the Saturday–weekday gap 45 days out was about 5pt.
That demand is not concentrated on specific dates also means, conversely, that a steady level of visitor demand can be expected on every weekday of the run. The scattered weekdays around Culture Day and the weekdays of early to mid-December are the dates with the most upside in current booking data. Whether hotels can turn the length of the run into “lifting weekdays” looks set to divide Tokyo hotel revenue this autumn and winter.
⚠ Note on ADR for future dates: ADR and listed prices for October–December 2026 in this article are estimates based on selling prices published on OTAs at the survey date (September 27, 2026) and will change as check-in dates approach. Note that prices currently set high may be revised close to the date. Occupancy (estimated) is based on absorption of OTA-sold inventory and differs from a property’s actual overall occupancy.
Related Articles
References and Sources
■ Data sources
OTA public price and inventory data collected by MetroEngines Research (survey date: September 27, 2026). Estimated settled ADR by ward and month (7 wards; N = properties covered in October 2026), daily listed prices (834 properties in 7 wards), booking curves and occupancy (estimated) for Tokyo (886 properties / 107,033 rooms), and room counts around venues (479 properties). Festival dates and venues are from official announcements by the Tokyo Metropolitan Government and the Tokyo International Culture and Arts Festival Executive Committee.
■ Calculation assumptions
Room stock counts properties with selling prices confirmed on at least 20 stay dates during the festival (properties without a registered room count are counted in properties only). Distance from venues is straight-line distance from each venue point (1km, 2km). The daily listed-price index is the property median of an index setting each property’s average listed price during the festival to 100. Occupancy (estimated) uses only observations at LT45 or less; the Saturday–weekday comparison averages, 45 days out, the 5 Saturdays and 15 Mondays–Thursdays excluding holidays and holiday eves between October 10 and November 10.
■ Limitations
ADR and listed prices for October–December 2026 are estimates based on selling prices at the survey date and may be revised as stay dates approach. Occupancy (estimated) is based on absorption of OTA-listed inventory and differs from actual overall occupancy. Stay dates from mid-November onward were more than 45 days out at the survey date and are not included in the booking-pace comparison. We do not know the number of festival visitors or their share of hotel guests.
■ Sources
- Tokyo Metropolitan Government / Tokyo International Culture and Arts Festival Executive Committee, “ARTE TOKYO, a new culture and arts festival for Tokyo’s autumn and winter, announces its programme line-up” (July 2, 2026, in Japanese)
- Tokyo Metropolitan Government, “ARTE TOKYO to open in October 2026” (April 2026, in Japanese)
- Tokyo Metropolitan Government, “International art exhibition TOKYO ATLAS” (December 4, 2025, in Japanese)
- ARTE TOKYO official website
- TOKYO ATLAS international art exhibition official website
- Japan Tourism Agency, “Overnight Travel Statistics Survey”
- MetroEngines Research — estimated settled ADR (by ward, monthly), listed prices (daily, N=834 properties), booking curves and occupancy (estimated) (Tokyo, 886 properties / 107,033 rooms), room counts around venues (survey date: September 27, 2026)