

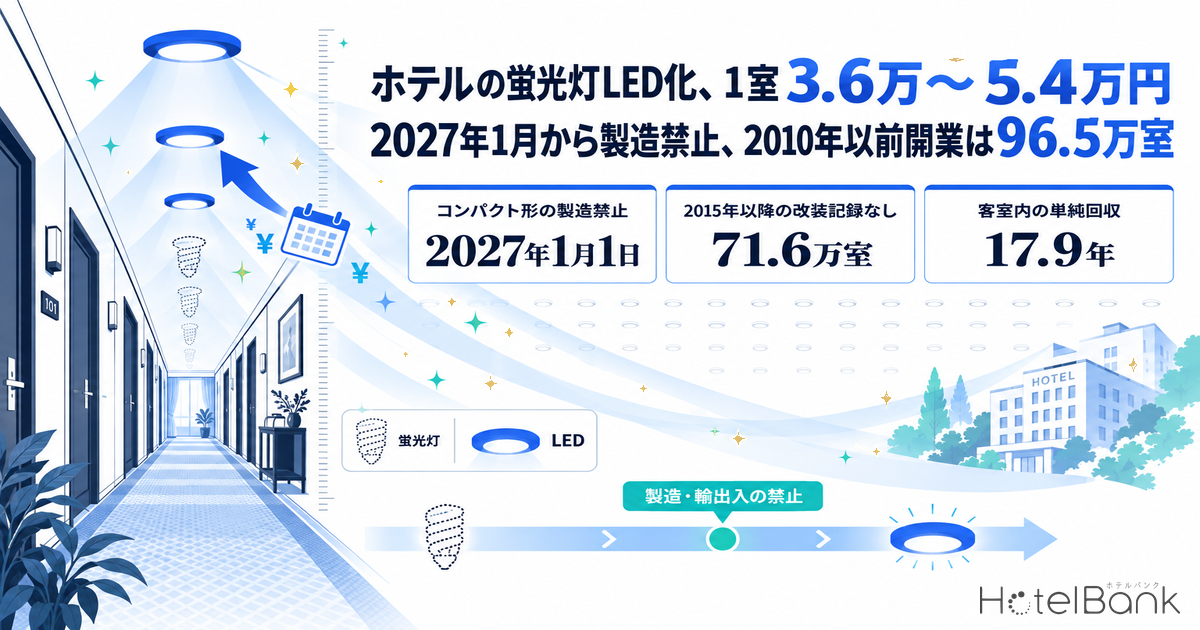
Under the Minamata Convention on Mercury, general-lighting fluorescent lamps are being phased out type by type, with manufacture, import and export ending on set dates. Compact fluorescent lamps — common in hotel guest-room and corridor downlights — hit their deadline on January 1, 2027, while the straight-tube and circular lamps that dominate office discussions follow on January 1, 2028. Lodging properties therefore face their deadline a year earlier than offices. This article focuses narrowly on the replacement timing dictated by the manufacturing and import/export ban: we count the guest-room stock opened in 2010 or earlier using the MetroEngines Research & Consulting property master database, and use a 100-room model to estimate LED-conversion Capex per room and payback periods.
Utility-cost levels and the payback of energy-saving investment in general are outside the scope of this piece; in that broader picture, LED conversion is only one of several possible measures. Rather than revisit electricity costs, this article sets out the “by when, where and how much” for asset managers and funds estimating equipment-replacement costs in acquisition due diligence (DD), owners building maintenance plans for assets they hold, and regional lenders underwriting renovation loans.
Metric Definitions Used in This Article
- Guest-room stock: Of the domestic properties tracked by MetroEngines Research, the 27,248 properties and 1,266,597 rooms confirmed as operating (as of September 2026). Of these, 24,720 properties and 1,233,032 rooms with a known opening date were tallied by opening year. Because only properties confirmed as operating are counted, the figures run slightly below actual supply and should be read as a lower-bound guide.
- Opening year: The opening date in the property master database. It is used not as evidence of whether LED lighting has been installed, but as a proxy indicating that the lighting plan was likely designed around fluorescent fixtures at completion. For ryokan, the founding year rather than the building’s completion year is sometimes registered. For the 4,032 properties and 75,057 rooms registered with an opening date of January 1, 1990, figures excluding them are also shown in the text.
- Renovation on record: Properties with a renovation date of January 2015 or later registered in the property master database. Since their lighting may have been updated during renovation, they are shown separately and excluded from the estimation base.
- Simple payback period: Initial investment ÷ (annual electricity savings + savings on lamp replacement). Excludes subsidies, tax effects and interest.
- Data sources: MetroEngines Research & Consulting (property master database), Ministry of the Environment, Ministry of Economy, Trade and Industry (METI), Japan Lighting Manufacturers Association (JLMA)
The conclusions first. First, compact fluorescent lamps — the most common type in lodging-facility lighting — will stop being manufactured, imported and exported on January 1, 2027, roughly three months from now, and the end of 2027 is the last date for straight-tube lamps as well. Use, sale and purchase are not prohibited, so the lamps do not suddenly become unusable, but replacement lamps will increasingly depend on existing market inventory. Second, there are 965,000 guest rooms in properties opened in 2010 or earlier, and 716,000 remain even after excluding properties with a renovation on record since 2015. Third, in a 100-room model, LED conversion is estimated at ¥36,000–¥54,000 per room, with a simple payback of 4.9–7.3 years for the property as a whole. However, while common areas lit 24 hours a day pay back in around three years, in-room lighting takes 17.9 years. In-room replacement is an investment whose timing is set by the deadline and fixture age, not by payback, and whether it is budgeted in a planned way changes how Capex should be read at acquisition and during ownership.
- — On January 1, 2027, manufacture, import and export of compact lamps (common in guest-room and corridor downlights) stop, followed by straight-tube and circular lamps on January 1, 2028. Use, and buying and selling existing stock, remain permitted.
- — Guest rooms in properties opened in 2010 or earlier total 965,000 (78.3% of rooms with a known opening date). Even excluding the 75,000 rooms registered with an opening date of January 1, 1990, the figure is 890,000.
- — Narrowing to properties with no renovation on record since 2015 still leaves 716,000 rooms; by hotel type, business hotels account for the most, at 365,000 rooms.
- — LED conversion in a 100-room model costs ¥36,000–¥54,000 per room, with a simple payback for the whole property of 4.9–7.3 years (assuming electricity at ¥27/kWh and a 40% reduction).
- — Common areas pay back in 3.0 years, while in-room lighting takes 17.9 years. Time in-room replacement by the deadline and fixture age, and budget it alongside guest-room renovation.
What Stops When — Manufacturing and Import/Export Deadlines by Lamp Type
According to the Ministry of the Environment’s “Regulation of Fluorescent Lamps for General Lighting”, the deadlines differ by lamp shape and phosphor type. Self-ballasted (bulb-type) lamps already stopped being manufactured, imported and exported on January 1, 2026 (January 1, 2027 for those above 30W); compact lamps follow on January 1, 2027, and straight-tube and circular lamps on January 1, 2028. Among straight-tube and circular lamps, products whose phosphor is mainly halophosphate stop a year earlier, on January 1, 2027.
| Lamp type | Manufacturing and import/export ban begins | Typical locations in lodging facilities (general examples) |
|---|---|---|
| Self-ballasted (bulb-type) fluorescent lamps (30W or less) | Jan 1, 2026 (already in effect) | Guest-room table lamps and wall brackets, corridor fixtures with bulb sockets |
| Self-ballasted (bulb-type) fluorescent lamps (over 30W) | Jan 1, 2027 | Some fixtures in lobbies and banquet halls |
| Compact fluorescent lamps | Jan 1, 2027 | Downlights in guest rooms, corridors and elevator halls |
| Straight-tube / circular (halophosphate phosphor) | Jan 1, 2027 | Older fixtures in back-of-house areas, car parks, etc. |
| Straight-tube / circular (tri-phosphor and all other types) | Jan 1, 2028 | Vanity mirror lights; offices, kitchens and linen rooms; signage |
METI’s material describes the deadlines as “year-end”, while the Ministry of the Environment says “banned from January 1 of the following year”, but both refer to the same point in time. Both state explicitly that continued use of products, and the sale and use of existing stock, remain permitted after the regulations take effect. METI also urges a planned switch to LED lighting and, where switching is difficult, securing replacement fluorescent lamps.
Progress on the industry side is worth noting too. According to the Japan Lighting Manufacturers Association’s FY2026 business plan, the LED share of the installed base of lighting fixtures stood at 67.5% as of end-March 2026, still short of the target of 100% SSL (solid-state lighting) in the installed base by 2030. Awareness of the end of fluorescent-lamp manufacturing is only 42.4%. In other words, about one-third of lighting fixtures in Japan have yet to be converted to LED, and as the deadlines approach the market is entering a phase in which contractor bookings are likely to bunch up.
Where Fluorescent Lighting Remains in a Hotel — Guest Rooms, Corridors, Banquet Halls and Back of House
In lodging-facility lighting plans, compact lamps have commonly been used in guest-room downlights and in ceiling lights in corridors and elevator halls, and straight-tube lamps in vanity mirror lights and back-of-house areas. Lighting in lodging facilities therefore faces replacement on two separate deadlines: compact lamps, concentrated in guest-room and common-area ceiling lighting, in January 2027, and the straight-tube lamps in back-of-house areas in January 2028. Working from the “by end-2027” understanding that has the straight-tube lamps of office buildings in mind would leave a lodging facility a year off.
Differences in operating hours also shape the investment decision. Corridors, elevator halls and lobbies are typically lit 24 hours a day, and a hotel-sector pamphlet prepared by the Energy Conservation Center, Japan (ECCJ) under commission from METI’s Agency for Natural Resources and Energy notes that replacing constantly lit common-area lighting yields large energy savings and is easy to pay back quickly. Guest-room lighting, by contrast, is on only while guests are in the room, so electricity savings are small. Banquet halls split into general lighting and decorative lighting such as chandeliers, and decorative lighting has to be replaced as part of the fixture design.
There are two broad ways to upgrade: “fixture replacement”, swapping whole fixtures for LED fixtures, and “lamp replacement”, keeping the existing fixtures, rewiring them to remove the ballast (bypass work) and fitting straight-tube LED lamps or similar. METI sets out accident patterns such as fires caused by fitting incompatible lamps or by continuing to use LED lamps in fixtures that have been in service for a long time, and asks owners to consult a specialist contractor when it is unclear whether work is needed or when fixture deterioration is a concern. According to the JLMA, failure rates of lighting fixtures rise after 10 years. In a property opened in 2010 or earlier that has not updated its lighting, the fixtures will be more than 15 years old, so it is practical to estimate on the basis of fixture replacement as the base case.
In older buildings the ballasts themselves also need checking. According to the Ministry of the Environment and METI, some ballasts in lighting fixtures manufactured in Japan between January 1957 and August 1972 contain PCBs, and buildings built or renovated by March 1977 are expected to be checked. The disposal period for high-concentration PCB waste ended on March 31, 2023, and any that is found requires prescribed procedures such as notifying the local government. A site survey for a lighting upgrade is also an opportunity to check ballast nameplates.
965,000 Guest Rooms Opened in 2010 or Earlier — 716,000 Even After Excluding Renovation Records
In the MetroEngines Research & Consulting property master database, of the 27,248 properties and 1,266,597 rooms confirmed as operating, we counted the 24,720 properties and 1,233,032 rooms with a known opening date by opening year. Properties opened in 2010 or earlier number 18,062 with 965,450 rooms, or 78.3% of rooms with a known opening date. LED lighting fixtures began to be widely available for commercial facilities around 2010, so properties completed before then are likely to have had their lighting plans designed around fluorescent fixtures.
Some properties, however, have replaced their lighting in a post-opening renovation. We therefore show separately the 2,158 properties and 249,672 rooms with a renovation date of January 2015 or later on record. Even excluding these, 15,904 properties and 715,778 rooms opened in 2010 or earlier have no renovation on record. This article treats these 716,000 rooms as the base in which a lighting upgrade may not yet be planned. Some properties without a registered renovation date have nonetheless completed partial LED conversion, so the 716,000 figure is an upper-end guide.
| Opening-year band | Properties | Guest rooms | Of which, renovation since 2015 on record (rooms) | No renovation on record (rooms) |
|---|---|---|---|---|
| 1980 or earlier | 4,547 | 223,665 | 63,692 | 159,973 |
| 1981–1990 | 6,541 | 246,123 | 57,700 | 188,423 |
| 1991–2000 | 2,745 | 207,803 | 62,365 | 145,438 |
| 2001–2010 | 4,229 | 287,859 | 65,915 | 221,944 |
| Total, 2010 or earlier | 18,062 | 965,450 | 249,672 | 715,778 |
| 2011–2015 | 2,680 | 105,645 | 10,304 | 95,341 |
| 2016–2020 | 3,825 | 147,761 | 7,608 | 140,153 |
| 2021 or later | 153 | 14,176 | 838 | 13,338 |
Note that the 1981–1990 band includes 4,032 properties and 75,057 rooms registered with an opening date of January 1, 1990. That is far more than the neighbouring years (391 properties in 1989, 292 in 1991), so the group may include properties whose registered date does not reflect the actual opening year. Shown excluding this group, properties opened in 2010 or earlier come to 14,030 properties and 890,393 rooms (76.9% of rooms with a known opening date), and the 716,000 rooms with no renovation on record fall to a minimum of 641,000. The group averages 18.6 rooms per property and consists mainly of small properties, so in room terms it does not materially change the scale of the base.
By hotel type, more than 90% of city-hotel and ryokan rooms were opened in 2010 or earlier. Business hotels have the most rooms, with 464,000 opened in 2010 or earlier. City hotels have a large number of rooms — 69,000 — with a renovation on record since 2015, which suggests that lighting has relatively often already been updated within major-renovation cycles. By the number of rooms with no renovation on record, the order is business hotels at 365,000, ryokan at 133,000 and city hotels at 91,000.
| Hotel type | Rooms with known opening date | Of which, opened 2010 or earlier | Share | Of which, no renovation on record |
|---|---|---|---|---|
| Business hotels | 634,220 | 464,239 | 73.2% | 365,388 |
| Ryokan | 174,227 | 159,620 | 91.6% | 132,894 |
| City hotels | 176,103 | 160,222 | 91.0% | 91,245 |
| Resort hotels | 93,270 | 81,651 | 87.5% | 56,101 |
By size, 433,000 rooms — 45% of the rooms opened in 2010 or earlier — are in properties with 100–299 rooms (2,655 properties). Small properties with fewer than 30 rooms are numerous, at 10,589, but account for only 127,000 rooms. Small inns are the core of replacement demand by property count, and mid-sized hotels by room count.
The map plots, by prefecture, guest rooms opened in 2010 or earlier with no renovation on record. Tokyo leads with 59,000 rooms, followed by Hokkaido (50,000), Nagano (34,000), Osaka (33,000) and Shizuoka (30,000). In Hokkaido, Nagano and Shizuoka the share opened in 2010 or earlier is high, in the mid-80% range, with ryokan in onsen and resort areas swelling the base.
Upgrade Cost per Room and Payback — A 100-Room Model Estimate
For the number of fixtures per room, we took as a reference an energy-audit case published by the Energy Conservation Center, Japan (a business hotel in the Kanto region with about 140 rooms), in which 427 guest-room and common-area fixtures were in scope for a lighting upgrade — about 3.0 per room. That case reported an investment of ¥2,519,000 against annual savings of ¥1,246,000, a payback of 2.0 years; but the scope also included incandescent and halogen lamps, so note that the savings come out larger than they would for a fluorescent-to-LED upgrade alone.
Our 100-room model assumes 2.0 fixtures per room in guest rooms, 0.7 per room in corridors, elevator halls and the lobby, and 0.3 per room in back-of-house areas, for a total of 3.0 per room (300 fixtures). For unit installation costs, we referred to market rates published by contractors (around ¥22,000 per fixture for fixture replacement and around ¥16,500 per fixture for bypass work on a surface-mounted 40W twin-lamp fixture, with a range of roughly ¥8,000–¥22,000 per fixture including lamps), and set base values of ¥18,000 per fixture for fixture replacement and ¥12,000 per fixture for lamp replacement (bypass work). These are contractors’ published figures and vary widely with fixture type, ceiling specification and whether night work is required.
| Area | Fixtures | Power per fixture | Operating hours | Annual electricity use | Investment (fixture replacement) | Simple payback |
|---|---|---|---|---|---|---|
| Guest rooms | 200 | 30W | 6 hrs/day × 80% occupancy (full year) | 10,512kWh | ¥3.6M | 17.9 yrs |
| Corridors, elevator halls, lobby | 70 | 40W | 24 hrs | 24,528kWh | ¥1.26M | 3.0 yrs |
| Back of house | 30 | 60W | 12 hrs | 7,884kWh | ¥540,000 | 4.6 yrs |
| Property total | 300 | — | — | 42,924kWh | ¥5.4M | 7.3 yrs |
For the property as a whole, annual electricity savings come to about ¥460,000 and lamp-replacement savings to about ¥270,000, so fixture replacement at ¥5.4M (¥54,000 per room) has a simple payback of 7.3 years. Bypass work at ¥3.6M (¥36,000 per room) pays back in 4.9 years. On electricity savings alone the payback for fixture replacement stretches to 11.6 years, so in 24-hour common areas the benefit of less frequent lamp replacement cannot be ignored.
Broken down by area, the nature of the investment diverges sharply. Corridors, elevator halls and the lobby pay back in 3.0 years and back-of-house areas in 4.6 years, so they stand on their own as energy-saving investments. In-room lighting takes 17.9 years — within the typical design life of LED fixtures (40,000 hours), but easy to defer if judged on payback alone. Yet the compact lamps common in guest-room downlights stop being manufactured, imported and exported on January 1, 2027. In-room replacement is better understood not as a question of whether it pays back, but as an investment determined by when, and alongside which works, an eventually unavoidable replacement is carried out. Folding it into the same programme as guest-room renovation or bathroom upgrades lets the project share scaffolding, protective work and out-of-service days, keeping the effective burden below that of a standalone project. The revenue lost while rooms are out of service is itself a cost: we have separately estimated it at 32.6% of construction cost for hotel renovations.
We also show the sensitivity to the assumptions. Electricity rates are set at three levels — ¥20, ¥27 and ¥35/kWh — and the electricity reduction at 30%, 40% and 50%. The reduction range reflects figures of roughly 30–50% published by manufacturers in comparisons with a twin-lamp 32W Hf fluorescent fixture.
| Simple payback (property total) | 30% reduction | 40% reduction | 50% reduction |
|---|---|---|---|
| Fixture replacement (¥18,000/fixture, ¥54,000/room) | |||
| ¥20/kWh electricity | 10.2 yrs | 8.8 yrs | 7.7 yrs |
| ¥27/kWh electricity | 8.7 yrs | 7.3 yrs | 6.3 yrs |
| ¥35/kWh electricity | 7.5 yrs | 6.2 yrs | 5.3 yrs |
| Lamp replacement + bypass work (¥12,000/fixture, ¥36,000/room) | |||
| ¥20/kWh electricity | 6.8 yrs | 5.8 yrs | 5.1 yrs |
| ¥27/kWh electricity | 5.8 yrs | 4.9 yrs | 4.2 yrs |
| ¥35/kWh electricity | 5.0 yrs | 4.1 yrs | 3.5 yrs |
The number of fixtures per room also varies by property. Ryokan and city hotels with large rooms may have five or more fixtures per room, while the small rooms of limited-service hotels may have around two. Combining fixture counts with unit installation costs, Capex per room ranges from ¥16,000 (2 fixtures × ¥8,000) to ¥110,000 (5 fixtures × ¥22,000). In acquisition DD, the accuracy of the estimate depends on first counting fixtures from drawings and site surveys and pinning down where in this range the property sits.
We also estimate the macro scale. Multiplying the 716,000 rooms opened in 2010 or earlier with no renovation on record by 3.0 fixtures per room gives about 2.15 million fixtures. Assuming, as an upper bound, that all of them are still fluorescent fixtures, the total comes to about ¥25.8bn for bypass work and about ¥38.7bn for fixture replacement. Applying the JLMA’s non-LED share for the whole installed base (100% − 67.5% = 32.5%) gives replacement demand of about ¥8.4bn–¥12.6bn. Both are rough guides built on stacked assumptions, but they indicate that lighting upgrades worth several billion to several tens of billions of yen could move in the lodging industry alone in the few years around the deadlines.
How to Read It in Acquisition DD — Building It into the CapEx Reserve
In acquisition DD, check whether lighting-fixture replacement is included in the long-term maintenance plan in the engineering report and, if so, whether its timing and unit costs are consistent with the deadlines. Long-term maintenance plans often schedule lighting fixtures on a cycle of around 15–20 years, but the manufacturing and import/export ban brings replacement forward for reasons unrelated to fixture life. Whether to secure a stock of maintenance lamps and keep using fixtures until the end of their life, or to upgrade on the occasion of the deadline, is an operating-policy choice, and the choice changes the year in which the Capex is booked. For a benchmark, our separate analysis of IR disclosures by five listed hotel REITs puts capital expenditure at ¥130,000–¥620,000 per room per year.
| Item to check | What to look at | Reflection in Capex |
|---|---|---|
| Fixture types and counts | Number of compact / straight-tube fixtures in guest rooms, common areas and back of house | Split the booking year by whether the deadline is January 2027 or January 2028 |
| Fixture manufacture year | For fixtures over 10 years old, use fixture replacement rather than lamp replacement as the base case | Set unit costs on the fixture-replacement basis |
| Ballast nameplates | Ballasts made in 1957–1972 may contain PCBs | Check disposal-procedure costs and time separately |
| Past renovation history | Scope of lighting updated during renovations | Remove already-updated areas from the base |
| Stock of maintenance lamps | Quantity and storage location of stock if fixtures will be used beyond the deadline | Treat as an operating cost if the upgrade is deferred |
| Concurrent works | Plans for guest-room renovation, ceiling replacement and fire-safety equipment upgrades | Compress construction cost and out-of-service days through concurrent works |
In underwriting a renovation loan, it is clearer to treat the lighting upgrade not as a standalone energy-saving investment but as part of a guest-room renovation package, explaining the fast-payback common-area portion separately from the deadline-driven in-room portion; this makes the link between use of funds and source of repayment explicit. For owners, deciding the upgrade scope and timing this autumn, while the FY2027 maintenance budget is being drawn up, is a realistic way to avoid the crunch in contractor bookings.
Common areas and back of house: an investment that pays back on its own
Corridors and elevator halls lit 24 hours a day pay back in 3.0 years in the 100-room model. Lamp-replacement work also falls, leaving ample room to proceed without waiting for the deadline.
Guest rooms: replacement timed by the deadline and fixture age
Payback is 17.9 years, but compact lamps — common in downlights — end production on January 1, 2027. Folding the work into the same programme as guest-room renovation is efficient.
Acquisition DD: check booking year and unit costs
Fixtures in the 716,000 rooms opened in 2010 or earlier are over 15 years old. Use fixture-replacement unit costs, split the booking year by deadline, and build it into the reserve.
Summary — The Investment Opportunity in Planned Upgrades Anchored on the Deadline
Manufacture, import and export of general-lighting fluorescent lamps stop on January 1, 2027 for compact lamps — the most common type in lodging facilities — and on January 1, 2028 for straight-tube and circular lamps. Use is not prohibited, but the supply of replacement lamps will increasingly depend on market inventory. There are 965,000 guest rooms opened in 2010 or earlier, and 716,000 even when narrowed to properties with no renovation on record; LED conversion in a 100-room model is estimated at ¥36,000–¥54,000 per room, with a simple payback of 4.9–7.3 years for the property as a whole.
The basis for the investment decision differs by area. Common areas and back of house pay back on their own as energy-saving investments, while in-room lighting is a replacement investment whose timing is set by the deadline and fixture age. Budgeting the two separately and combining them with other works such as guest-room renovation keeps the burden of meeting the deadline down while also raising lighting quality. Whether acquiring, holding or lending, a lighting upgrade anchored on the deadline can be positioned as an opportunity to lock in the Capex plan ahead of schedule.
Note on the estimates: The payback periods and Capex in this article are simplified estimates based on assumed fixture counts, power consumption, operating hours, unit installation costs, electricity rates and electricity reduction, and differ from the actual costs and effects at individual properties. They exclude subsidies, taxation, interest and the impact of taking rooms out of service during works. Actual investment decisions require detailed quotations based on a site survey.
References and Sources
■ Data sources
Guest-room stock is from the MetroEngines Research & Consulting property master database (27,248 domestic properties and 1,266,597 rooms confirmed as operating, of which 24,720 properties and 1,233,032 rooms with a known opening date, as of September 2026). Regulatory deadlines are from the Ministry of the Environment and METI; the LED share of the lighting-fixture installed base is from the JLMA; the reference for fixtures per room is the ECCJ’s energy-audit case; and unit installation costs are contractors’ published market rates.
■ Estimation assumptions
100-room model with 300 lighting fixtures (200 in guest rooms at 30W, 6 hrs/day × 80% room occupancy (full year); 70 in corridors, elevator halls and lobby at 40W, 24 hrs; 30 in back of house at 60W, 12 hrs). 40% electricity reduction, ¥27/kWh electricity rate, fluorescent lamp rated life of 12,000 hours at ¥3,000 per replacement. Unit installation costs: ¥18,000 per fixture for fixture replacement, ¥12,000 per fixture for lamp replacement (bypass work). The sensitivity analysis is a 3×3 grid of ¥20–¥35/kWh × 30–50% reduction.
■ Limitations and caveats
Opening year is the date registered in the property master database and does not directly indicate the manufacture year of lighting fixtures or whether LED conversion has taken place. The 4,032 properties and 75,057 rooms registered with an opening date of January 1, 1990 may not reflect the actual opening year, so figures excluding them are given in the text. Some properties with no renovation on record have completed partial LED conversion, so the 716,000 rooms is an upper-end guide. Payback periods are simple paybacks excluding subsidies, tax effects, interest and out-of-service impacts, and are not a substitute for property-specific quotations.
■ Market data
- MetroEngines Research & Consulting — Property master database (27,248 properties / 1,266,597 rooms confirmed as operating; 24,720 properties with a known opening date; as of September 2026)
■ Regulations and public materials
- Ministry of the Environment, “Regulation of Fluorescent Lamps for General Lighting” (in Japanese)
- METI, “Phase-out of Fluorescent Lamp Manufacture under the Minamata Convention and Future Measures” (December 13, 2024) (in Japanese)
- Ministry of the Environment PCB Early Disposal Information Site, “How to Determine Whether PCBs Are Present” (in Japanese)
- METI, “About PCB-Containing Ballasts” (November 2016) (in Japanese)
- Energy Conservation Center, Japan, “Energy Conservation for Hotels” (commissioned by the Agency for Natural Resources and Energy) (in Japanese)
- Energy Conservation and Power Saving Portal, “Energy Audit Case: Lodging (Business Hotel)” (in Japanese)
■ Industry materials
- Japan Lighting Manufacturers Association, “FY2026 Business Plan” (in Japanese)
- Japan Lighting Manufacturers Association, “Information on PCB-Containing Lighting Fixtures” (in Japanese)
- Iwasaki Electric, “Comparison with Hf32W×2 Fluorescent Lamps” (in Japanese)
- Toshiba Lighting & Technology, “Major Expansion of LED Base Lights” (press release) (in Japanese)
- Denkei Co., Ltd., “LED Fixture Replacement or Bypass Work: Which Is Best?” (installation cost rates) (in Japanese)