

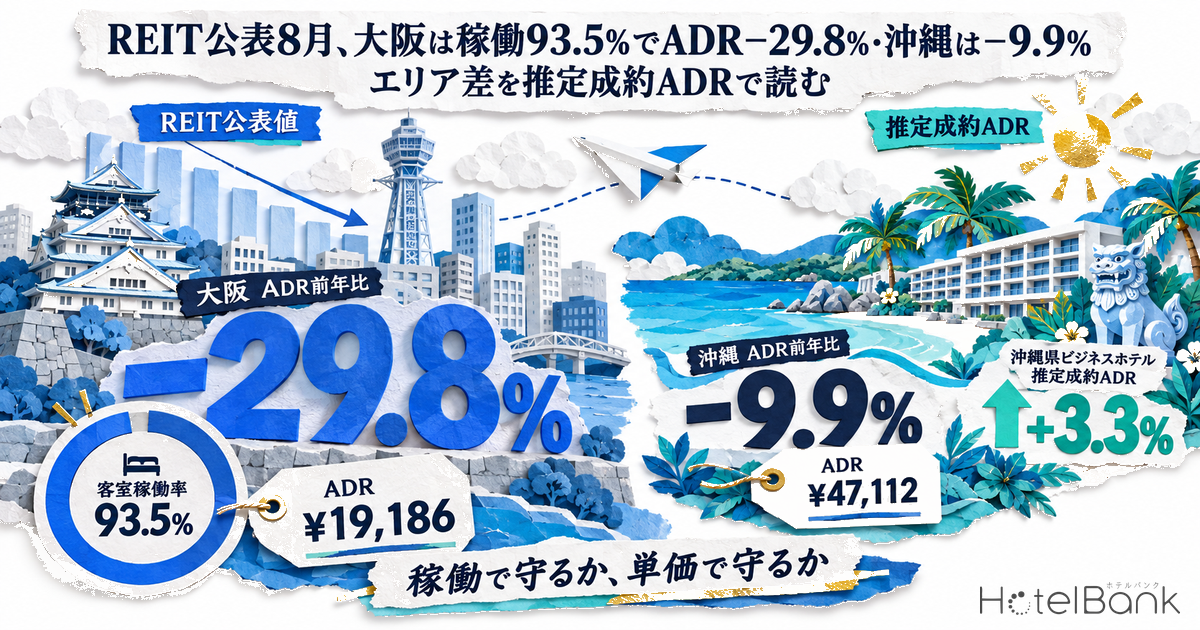
Breaking down the August 2026 monthly operating results that Japan Hotel REIT Investment Corporation (8985) released in late September by region, its Osaka hotels held occupancy at 93.5% (−0.5pt YoY) while ADR fell 29.8% YoY to ¥19,186. Okinawa also saw a notable drop in rates, with ADR at ¥47,112 (−9.9% YoY) and RevPAR down 14.0%. Our settled ADR estimates (finalized values) for Osaka Prefecture point the same way: city hotels were −24.4% (N=97) and business hotels −33.6% (N=503). In Okinawa Prefecture, however, city hotels were −0.2% (N=15) and business hotels +3.3% (N=196), the opposite sign from the REIT figures. Kansai (excluding Osaka) gave up 6.2% in ADR but grew occupancy by 10.4pt, lifting RevPAR 7.3% above the prior year. Even within the same August, the areas that defended performance through occupancy and those that defended it through rate split clearly. This article sets the published actuals side by side with our estimates to identify where that dividing line lies.
Scope: city and business hotels in Osaka, Okinawa, Kyoto, Hyogo and Nara prefectures (settled ADR N=15–503 properties, shown by prefecture × category); estimated OCC covers city, business and resort hotels in the same five prefectures (N=19–288 properties). Price metrics in this article are settled ADR (an estimated transaction price level derived from OTA and other sales data, tax-exclusive equivalent); occupancy is an estimate based on OTA-listed inventory. REIT figures are quoted exactly as published by each investment corporation. All definitions are given at the end of the article. Data as of September 30, 2026.
- — Osaka: ADR −29.8% with occupancy still at 93.5%. Japan Hotel REIT’s August 2026 regional results. Our settled ADR for Osaka business hotels was also −33.6%, but only −5.1% versus two years earlier.
- — Most of the YoY decline comes from the comparison base. April–October of last year coincided with Expo 2025 Osaka, Kansai; Osaka city hotels were −0.9% versus two years earlier and +8.4% versus the pre-Expo level (Jan–Mar 2025 average).
- — In Okinawa, the sign depended on the population measured. REIT Okinawa (mainly high-priced resorts) posted ADR of ¥47,112, −9.9%; our Okinawa city hotels were −0.2% and business hotels +3.3%.
- — Kansai (ex-Osaka) made it back through occupancy. Despite ADR −6.2%, occupancy rose 10.4pt and RevPAR 7.3% (August 2026).
- — Booking pace differed too. Osaka business hotels on 8/8 were a late-filling pattern (76.6% at 7 days out → 88.3% the day before); Okinawa resorts on 8/13 were an early-filling pattern at 78.1% already 45 days out (estimated OCC, August 2026).
The REIT’s Published August Results — By Region, Osaka and Okinawa Dragged Down the Total
Let us start with the published figures themselves. Japan Hotel REIT Investment Corporation reported August 2026 results for its “29 hotels with variable rent, etc.” of 84.1% occupancy (−0.1pt YoY), ADR of ¥23,337 (−8.8% YoY) and RevPAR of ¥19,616 (−8.9% YoY). Occupancy was essentially flat, so the RevPAR decline is explained entirely by lower rates. The same document also discloses a regional breakdown. Of the eight regions, only two raised ADR year on year — Tokyo (+0.4%) and Kanto excluding Tokyo (+3.5%) — while Osaka at −29.8% and Okinawa at −9.9% pulled the total down.
| Region (hotels with variable rent, etc.) | Occupancy | YoY (pt) | ADR | YoY | RevPAR | YoY |
|---|---|---|---|---|---|---|
| Osaka | 93.5% | −0.5pt | ¥19,186 | −29.8% | ¥17,931 | −30.2% |
| Okinawa | 82.5% | −3.9pt | ¥47,112 | −9.9% | ¥38,853 | −14.0% |
| Kansai (ex-Osaka) | 82.4% | +10.4pt | ¥17,863 | −6.2% | ¥14,727 | +7.3% |
| Hokkaido | 89.7% | +3.7pt | ¥18,764 | −3.3% | ¥16,826 | +0.9% |
| Chugoku | 91.3% | +3.5pt | ¥21,634 | −1.6% | ¥19,749 | +2.3% |
| Kyushu (ex-Okinawa) | 72.3% | −2.8pt | ¥21,762 | −0.2% | ¥15,740 | −3.9% |
| Tokyo | 81.9% | +0.3pt | ¥12,172 | +0.4% | ¥9,963 | +0.8% |
| Kanto (ex-Tokyo) | 90.0% | −2.3pt | ¥16,990 | +3.5% | ¥15,290 | +0.9% |
| 29-hotel total | 84.1% | −0.1pt | ¥23,337 | −8.8% | ¥19,616 | −8.9% |
Source: Japan Hotel REIT Investment Corporation, Monthly Key Indicators (August 2026, 29 hotels with variable rent, etc. / by region). Figures quoted exactly as published. Composition of each hotel group per the company’s notes.
The chart below plots these regional figures as two bars: ADR YoY (%) and occupancy YoY change (pt). In Osaka and Okinawa, rates fell sharply and occupancy also came in below the prior year (−0.5pt and −3.9pt, respectively). Kansai (ex-Osaka), Hokkaido and Chugoku offset lower rates with higher occupancy. Kanto (ex-Tokyo) raised rates while giving up occupancy. Even within a single portfolio, the way each region defended August differed completely.
Source: Compiled by HotelBank Editorial Team from Japan Hotel REIT Investment Corporation’s published Monthly Key Indicators (August 2026, by region)
Other hotel REITs have also published their overall August figures. For reference, Invincible Investment Corporation (101 domestic hotels) posted occupancy of 87.3% (−0.5pt YoY), ADR of ¥17,887 (−3.2% YoY) and RevPAR of ¥15,608 (−3.8%), while Ichigo Hotel REIT Investment Corporation (23-hotel total, excluding hotels closed for renovation, etc., August 2026) posted occupancy of 84.9% (−1.4pt), ADR of ¥10,510 (−2.7%) and RevPAR of ¥8,925 (−4.3%). Both show the same shape: occupancy largely held, rates below the prior year. Rather than interpreting these portfolio-wide figures, which are better read with Tokyo as the anchor, this article focuses on 8985’s table, which discloses a regional breakdown.
| Investment corporation (scope) | Occupancy | YoY (pt) | ADR | YoY | RevPAR | YoY |
|---|---|---|---|---|---|---|
| Japan Hotel REIT (29 hotels with variable rent, etc.) | 84.1% | −0.1pt | ¥23,337 | −8.8% | ¥19,616 | −8.9% |
| Invincible (101 domestic hotels) | 87.3% | −0.5pt | ¥17,887 | −3.2% | ¥15,608 | −3.8% |
| Ichigo Hotel REIT (23-hotel total, excluding hotels closed for renovation, etc.) | 84.9% | −1.4pt | ¥10,510 | −2.7% | ¥8,925 | −4.3% |
Source: Japan Hotel REIT Investment Corporation / Invincible Investment Corporation / Ichigo Hotel REIT Investment Corporation, August 2026 monthly disclosures
Osaka — REIT Actuals and Settled ADR Point the Same Way; Last Year’s Expo Period Inflates the Comparison Base
For Osaka, the REIT’s published figures and our estimates move in the same direction. Tracking monthly ADR YoY for January–August 2026, the REIT’s Osaka hotels widened their decline from −13.2% in January to −29.8% in August. Our settled ADR (YoY between finalized months) shows the same trajectory: Osaka business hotels (N=503) were −23.8% in April and −33.6% in August, and Osaka city hotels (N=97) were −18.1% in April and −24.4% in August.
The driver is a high comparison base. April–October of the prior year (2025) overlapped with Expo 2025 Osaka, Kansai (April 13 – October 13, 2025). The YoY decline stepped down further from April because the comparison months began to include Expo-period rates.
Source: REIT Osaka figures from Japan Hotel REIT Investment Corporation’s published Monthly Key Indicators (by region); settled ADR compiled by MetroEngines Research and HotelBank Editorial Team (YoY between finalized months; Osaka city N=89–97, business N=495–503)
That said, occupancy did not fall. The REIT’s Osaka hotels held 93.5% occupancy (−0.5pt YoY) in August 2026. Our monthly average estimated OCC (OTA-listed inventory basis) for August 2026 was 83.6% for Osaka city hotels (35 properties, 8,016 rooms; 34–35 properties depending on the day) and 80.1% for Osaka business hotels (282–288 properties, 47,378–48,247 rooms). By either measure, August was not a month when rooms went unsold, but one in which the same occupancy was captured at lower rates than a year earlier.
Looked at YoY alone this appears to be a price collapse, so it is worth comparing against a base unaffected by the Expo. Against two years earlier (August 2024, finalized), Osaka city hotels were only −0.9% and Osaka business hotels −5.1%. Against pre-Expo January–March 2025 (simple three-month average), city hotels were +8.4% and business hotels −7.7%. For the year after the Expo, then, YoY should be read alongside a two-year comparison and a pre-Expo baseline rather than on its own.
| Osaka — settled ADR (finalized) | Aug 2026 | Aug 2025 | YoY | Aug 2024 | vs. 2 yrs earlier | Jan–Mar 2025 avg. | vs. pre-Expo |
|---|---|---|---|---|---|---|---|
| City hotels | ¥13,078 N=97 | ¥17,291 N=91 | −24.4% | ¥13,203 N=88 | −0.9% | ¥12,061 N=89–90 | +8.4% |
| Business hotels | ¥8,772 N=503 | ¥13,211 N=499 | −33.6% | ¥9,247 N=495 | −5.1% | ¥9,504 N=500–502 | −7.7% |
Source: Compiled by MetroEngines Research and HotelBank Editorial Team (all finalized values; the Jan–Mar 2025 average is a simple average of finalized monthly values)
Looking at the REIT’s rates within the same year, the Osaka hotels’ August ADR of ¥19,186 is almost the same level as January’s ¥19,303 and February’s ¥20,754. The gap to last August looks large, but August is not an extreme low within 2026. The chart below overlays Osaka business hotel settled ADR by year. Only April–October 2025 bulges upward, and the 2026 line has come back close to the 2024 line.
Source: Compiled by MetroEngines Research and HotelBank Editorial Team (Osaka business hotels. 2024 N=484–499; 2025 N=487–503; Jan–Aug 2026 N=495–503 (finalized); Sep–Dec 2026 N=483–496 (estimate based on current sales status, dotted line))
Note that 2026 values from September onward are not finalized; they are estimates based on current sales status. For Osaka business hotels they stand at ¥10,675 in October, ¥11,054 in November and ¥10,185 in December (N=483–496), and may move before month-end. For reference, the finalized values two years earlier were ¥9,268 (October 2024), ¥10,035 (November) and ¥9,940 (December). A like-for-like comparison with finalized values should wait until each month is finalized. A deeper breakdown of Osaka by category and month, including booking pace for the October three-day weekend, is left for separate analysis.
Okinawa — REIT ADR −9.9%, Our City and Business Hotels Flat to Positive: Different Price-Tier Populations
In Okinawa, the REIT’s published figures and our estimates diverged in sign. The REIT’s Okinawa hotels posted August 2026 ADR of ¥47,112 (−9.9% YoY), occupancy of 82.5% (−3.9pt) and RevPAR of ¥38,853 (−14.0%), below the prior year on both rate and occupancy. By contrast, our settled ADR (finalized vs. finalized) showed Okinawa city hotels at ¥20,654 (N=15, −0.2% YoY) and Okinawa business hotels at ¥9,734 (N=196, +3.3%), i.e. flat to slightly positive.
The discrepancy stems from the different populations being measured. The REIT’s variable-rent Okinawa hotels are mainly high-priced resorts with ADR in the ¥40,000s, whereas our figures cover city and business hotels whose ADR is less than half that level. This is not a question of which is correct; the natural reading is that, even within the same prefecture, August results split by price tier.
Source: REIT Okinawa figures from Japan Hotel REIT Investment Corporation’s published Monthly Key Indicators (by region); settled ADR compiled by MetroEngines Research and HotelBank Editorial Team (YoY between finalized months; Okinawa city N=11–15, business N=193–200)
Tracing the monthly trend, however, reveals common ground. Since the start of 2026 all three series ran positive YoY: our Okinawa city hotels were +26.3% in January and +28.7% in February, business hotels +24.9% and +27.4%, and REIT Okinawa reached +15.6% in May. From there, growth narrowed in all three through July and August, with REIT Okinawa passing +2.8% in July before turning negative at −9.9% in August. Our figures also lost momentum, at city +9.0% and business +7.6% in July, and city −0.2% and business +3.3% in August.
The direction — slowing growth — was the same; what differed by price tier was whether it crossed the line from positive to negative. That is the summary for Okinawa in August. On occupancy, the August 2026 monthly average estimated OCC (OTA-listed inventory basis) was 87.2% for Okinawa resort hotels (180–186 properties, 16,291–16,885 rooms) and 84.7% for Okinawa business hotels (134–136 properties, 12,629–12,794 rooms).
Kansai (ex-Osaka) — Giving Up Rate and Winning It Back Through Occupancy
The REIT’s Kansai (ex-Osaka) group consists of hotels in Kyoto, Kobe and Nara. In August 2026, ADR fell to ¥17,863 (−6.2% YoY), while occupancy rose sharply to 82.4% (+10.4pt), lifting RevPAR above the prior year to ¥14,727 (+7.3%). Of the eight regions in the table, this is where the “win it back through occupancy” pattern appeared most clearly.
Our settled ADR (finalized vs. finalized) shows that, even within Kansai, direction split by prefecture and category. Kyoto Prefecture lost rate, with city hotels −10.2% and business hotels −15.6%; Hyogo Prefecture was −8.7% for city hotels and +2.8% for business hotels; and Nara business hotels were +5.9%. Kyoto’s August remains negative even against two years earlier (August 2024), at −7.0% for city and −3.1% for business hotels. (For Hyogo’s first-half trend, see Hyogo Hotel ADR H1 2026: City -12.4% in June, Business -0.4%.)
| Prefecture / category | Settled ADR Aug 2026 (finalized) | YoY | vs. 2 yrs earlier | Aug estimated OCC (monthly avg.) | Estimated OCC coverage (properties / rooms) |
|---|---|---|---|---|---|
| Kyoto city hotels | ¥19,662 (N=59) | −10.2% | −7.0% | 82.7% | 32–36 properties / 4,875–5,050 rooms |
| Kyoto business hotels | ¥9,993 (N=325) | −15.6% | −3.1% | 81.6% | 185–194 properties / 18,888–19,851 rooms |
| Hyogo city hotels | ¥13,366 (N=47) | −8.7% | +5.6% | 87.2% | 22–25 properties / 3,440–3,759 rooms |
| Hyogo business hotels | ¥8,104 (N=167) | +2.8% | +9.9% | 89.1% | 71–76 properties / 8,796–9,090 rooms |
| Nara business hotels | ¥9,461 (N=31) | +5.9% | +18.3% | 80.1% | 19–22 properties / 2,346–2,613 rooms |
| Okinawa city hotels | ¥20,654 (N=15) | −0.2% | +10.2% | — | — |
| Okinawa business hotels | ¥9,734 (N=196) | +3.3% | +14.9% | 84.7% | 134–136 properties / 12,629–12,794 rooms |
Source: Compiled by MetroEngines Research and HotelBank Editorial Team (YoY and two-year comparisons between finalized months. Estimated OCC is based on OTA-listed inventory; the number of properties covered varies by day and is shown as a range. Estimated OCC for Okinawa city hotels is not shown because too few properties are covered)
In summary, August split into areas that defended through occupancy and areas that defended through rate. Among the REIT’s regions, Kansai (ex-Osaka), Hokkaido and Chugoku defended through occupancy, Kanto (ex-Tokyo) defended through rate, and Tokyo was flat on both. Osaka saw rates fall while broadly maintaining occupancy; Okinawa saw rates fall while also losing 3.9pt of occupancy. The underlying circumstances differ: for Osaka, the comparison against last year’s Expo period; for Okinawa, slowing growth in the high-price tier.
August Booking Curves — Osaka Filled Late, Okinawa Resorts Built Up Early
Even at similar occupancy levels, the booking pace differs by area. We compared booking curves for peak August dates from 45 days before the stay date to the day before. For Osaka business hotels on Saturday, August 8, 2026, estimated OCC was 52.7% at 45 days out, 59.9% at 30 days out and 88.3% the day before — a build-up of +35.6pt over 45 days. From 76.6% at 7 days out to 88.3% the day before, the final week alone added +11.7pt. Osaka city hotels on the same date were at 66.9% at 45 days out, 72.4% at 30 days out and 93.5% the day before.
Okinawa resort hotels on Thursday, August 13, by contrast, had already reached 78.1% at 45 days out. They stood at 83.2% at 30 days out and 92.7% the day before, a 45-day build-up of only +14.6pt. Osaka’s curve relies heavily on last-minute pickup to approach full occupancy, while Okinawa resorts lock in close to 80% early — two contrasting shapes.
Source: Compiled by MetroEngines Research and HotelBank Editorial Team (estimated OCC, OTA-listed inventory basis. Osaka business hotels: 286 properties / 47,860 rooms; Osaka city hotels: 35 properties / 8,016 rooms; Okinawa resort hotels: 181 properties / 16,520 rooms; all based on listings on major booking sites)
| Stay date / segment | 45 days out | 30 days out | 7 days out | Day before | 45-day build-up |
|---|---|---|---|---|---|
| Sat 8/8 — Osaka business hotels (286 properties, 47,860 rooms) | 52.7% | 59.9% | 76.6% | 88.3% | +35.6pt |
| Sat 8/8 — Osaka city hotels (35 properties, 8,016 rooms) | 66.9% | 72.4% | 85.5% | 93.5% | +26.6pt |
| Thu 8/13 — Okinawa resort hotels (181 properties, 16,520 rooms) | 78.1% | 83.2% | 89.4% | 92.7% | +14.6pt |
| Thu 8/13 — Okinawa business hotels (136 properties, 12,794 rooms) | 61.9% | 71.8% | 84.3% | 88.0% | +26.1pt |
Source: Compiled by MetroEngines Research and HotelBank Editorial Team (estimated OCC, OTA-listed inventory basis)
Implications for Operators — How Hotels in Osaka, Okinawa and Kansai Should Read This August
1. Re-read Osaka’s YoY with “the Expo year” taken out. Osaka business hotel settled ADR was −33.6% YoY, but only −5.1% versus two years earlier (August 2024) and −7.7% versus the pre-Expo January–March 2025 average. It is worth laying out your own August results on all three bases: YoY, vs. two years earlier and vs. pre-Expo. If your two-year comparison is in line with the market, most of the decline is explained by the high comparison base. If you are well below the market, there may be room to revisit other factors such as pricing or channel mix.
2. When rates fall while occupancy stays high, occupancy is a poor basis for pricing decisions. The REIT’s Osaka hotels held 93.5% occupancy in August 2026 while ADR fell 29.8%, and our estimated OCC also showed rooms filling, at 83.6% for Osaka city and 80.1% for business hotels. Concluding that “pricing is fine because we’re full” hides where the rate floor is. A more effective approach is to use stretches of near-full days as the starting point for bringing rates back up.
3. Osaka fills late; Okinawa resorts fill early. Time price reviews differently by area. Osaka business hotels on Saturday, August 8 built up sharply late, from 59.9% at 30 days out to 88.3% the day before. In this pattern, discounting early may simply pull forward demand that would have come anyway. Okinawa resorts were already at 78.1% at 45 days out, so early prices largely determine occupancy.
4. In Okinawa, choose a benchmark that matches your price tier. For operators in the high-priced resort tier, REIT Okinawa (ADR ¥47,112, −9.9% YoY) is the closer reference. For the city and business tiers, our Okinawa city (−0.2%) and business (+3.3%) figures are closer. Even within “Okinawa,” the key is to compare against the population closest to your own property.
| Time horizon | Action | Decision trigger (figures from this article) | Aim |
|---|---|---|---|
| This week | Restate your August 2026 ADR in three columns: YoY, vs. two years earlier and vs. pre-Expo | Osaka market YoY: city −24.4% / business −33.6%; vs. two years earlier: −0.9% / −5.1%. If your two-year comparison is well below this range, investigate the causes | Separate declines caused by the comparison base from declines specific to your hotel |
| This week | Set October–December rate floors based on the same months two years earlier and pre-Expo levels, not last year | Osaka business hotels, finalized Oct–Dec 2024: ¥9,268 / ¥10,035 / ¥9,940. If your settings remain below these market levels, consider raising the floor | Prevent excessive discounting driven by worry about falling below last year |
| Within 2 weeks (45–30 days out) | For key November dates, compare your occupancy at 45 and 30 days out against the market curve | Osaka business hotels’ peak date was at 52.7% at 45 days out and 59.9% at 30 days out. If you are ahead of these levels, do not rush early discounts | Avoid premature discounting in a late-filling market |
| Close-in (7 days out to day before) | On near-full days, raise rates step by step during last-minute sales | Osaka business hotels picked up heavily at the end, from 76.6% at 7 days out to 88.3% the day before. If your close-in pace matches the market, there is room to raise rates | Use high-occupancy days as the starting point for rate recovery |
| Monthly (after REIT disclosures) | Put the REIT’s published regional figures and your own KPIs in the same table | REIT Osaka (August 2026): occupancy 93.5%, ADR −29.8%; Kansai (ex-Osaka): occupancy +10.4pt, ADR −6.2%. If your occupancy and rate move opposite to the REIT, find out why | Use external actuals as a monthly benchmark |
| Monthly (Okinawa) | Choose a reference that matches your price tier | High-priced resort tier: REIT Okinawa (¥47,112, −9.9%); city and business tiers: our estimates (−0.2% / +3.3%) | Avoid misreading from benchmarks with a different population |
Summary — Three Yardsticks for Reading August
| Yardstick | How August reads | How to use it |
|---|---|---|
| 1. Change the comparison base | Osaka business hotels were −33.6% YoY but −5.1% vs. two years earlier | Read YoY that includes an unusual year (such as the Expo) alongside two-year comparisons and pre-event levels |
| 2. Match the population | Okinawa: REIT −9.9%, our city −0.2% and business +3.3% | When comparing with published figures, choose a population close to your own price tier and category |
| 3. Distinguish how performance was defended | Kansai (ex-Osaka): occupancy +10.4pt, RevPAR +7.3%; Kanto (ex-Tokyo): ADR +3.5% | Decide whether to defend through occupancy or rate according to the shape of your area’s booking curve |
Monthly REIT disclosures are one of the few public data sources that let you confirm actual operating results at the area level. Our estimates, meanwhile, cover a broader population by prefecture × category and extend to current estimates for upcoming months. Using the two side by side, each for its own role, lets you judge where your hotel’s numbers sit within the market without relying on a single yardstick such as YoY.
Frequently Asked Questions
Q. Why is the REIT’s Osaka occupancy as high as 93.5% in August 2026 when ADR is −29.8%?
A. Because August of the previous year (2025) fell within Expo 2025 Osaka, Kansai, so the rate comparison base was high. Rooms filled at about the same level as the previous year (−0.5pt YoY); what fell was the rate. Our settled ADR likewise shows Osaka business hotels at −33.6% YoY, but −5.1% versus two years earlier (August 2024).
Q. In Okinawa, the REIT and your figures point in different directions. Which one is correct?
A. Neither is wrong; they measure different populations. REIT Okinawa is centered on high-priced resorts with ADR of ¥47,112. Our figures cover city hotels (¥20,654) and business hotels (¥9,734), and different price tiers moved differently in August. Refer to whichever is closer to your own price tier.
Q. Can the REIT’s occupancy and your estimated OCC be compared directly?
A. They are not suited to taking a direct difference. The REIT’s occupancy is each hotel’s actual result. Our estimated OCC is derived from the sell-through of inventory listed on OTAs, and because unlisted rooms are counted as sold, it tends to run higher than actual occupancy. In Osaka in August 2026, REIT Osaka was 93.5% while estimated OCC was 83.6% for city and 80.1% for business hotels — the coverage and definitions differ. In practice, it is best to align on YoY changes and month-to-month direction rather than levels.
About the Data
| Estimated OCC | Occupancy based on OTA-listed inventory = 100 − 100 × OTA-listed remaining rooms ÷ total rooms. Covers properties that list at least 30% of their total rooms on OTAs (aggregated over properties observable on each stay date, so the number of properties varies by day and is shown as a range in each chart and table). An estimate based on the sell-through of inventory sold on OTAs, defined differently from actual room occupancy (it runs higher because unlisted rooms are counted as sold). Target month: August 2026 (stay-date basis). |
|---|---|
| Booking curve | Based on observations from 45 days before the stay date to the most recent day. |
| Settled ADR | An estimated transaction price level (tax-exclusive equivalent) derived from OTA and other sales data (lowest-plan level × category-specific coefficient, ensembled across multiple channels). Past months are finalized values; current and future months are estimates based on current sales status. Median error of 6.6% against published operating results. YoY and two-year comparisons are calculated between finalized months. |
| Sample size (N) | Settled ADR (August 2026, finalized): Osaka city 97, business 503; Okinawa city 15, business 196; Kyoto city 59, business 325; Hyogo city 47, business 167; Nara business 31. Estimated OCC (August 2026): Osaka city 34–35 properties, business 282–288; Okinawa resort 180–186, business 134–136; Kyoto city 32–36, business 185–194; Hyogo city 22–25, business 71–76; Nara business 19–22 (based on listings on major booking sites). |
| REIT figures | Quoted exactly as published in each investment corporation’s August 2026 monthly disclosure (no rounding or recalculation). Japan Hotel REIT Investment Corporation’s regional figures aggregate its hotels with variable rent, etc., and are disclosed by the company based on information provided by hotel lessees and others. |
| Data as of | Data as of September 30, 2026. Sales status and inventory change daily, so figures in this article are a snapshot at the time of retrieval. |
References and Sources
■ Data sources
August 2026 monthly disclosures (published figures) of Japan Hotel REIT Investment Corporation, Invincible Investment Corporation and Ichigo Hotel REIT Investment Corporation. MetroEngines Research settled ADR (city and business hotels in Osaka, Okinawa, Kyoto, Hyogo and Nara prefectures, January 2024 – December 2026) and estimated OCC / booking curves (August 2026 stay dates, OTA-listed inventory basis, 45 days before to the day before the stay date). Data as of September 30, 2026.
■ Calculation assumptions
YoY and two-year comparisons are calculated between finalized months. The pre-Expo comparison uses the simple average of finalized monthly values for January–March 2025. Monthly average estimated OCC is the average of daily values; the number of properties varies by day and is shown as a range. REIT figures are quoted as published, with no rounding or recalculation.
■ Limitations
The REIT’s regional figures are limited to hotels with variable rent, etc.; Okinawa, for example, is centered on high-priced resorts, so the price tier differs from our prefecture × category populations. Estimated OCC is defined differently from actual room occupancy and runs higher. Settled ADR has a median error of 6.6% against published operating results; figures from September 2026 onward are estimates based on current sales status and may change once finalized.
■ Market data