

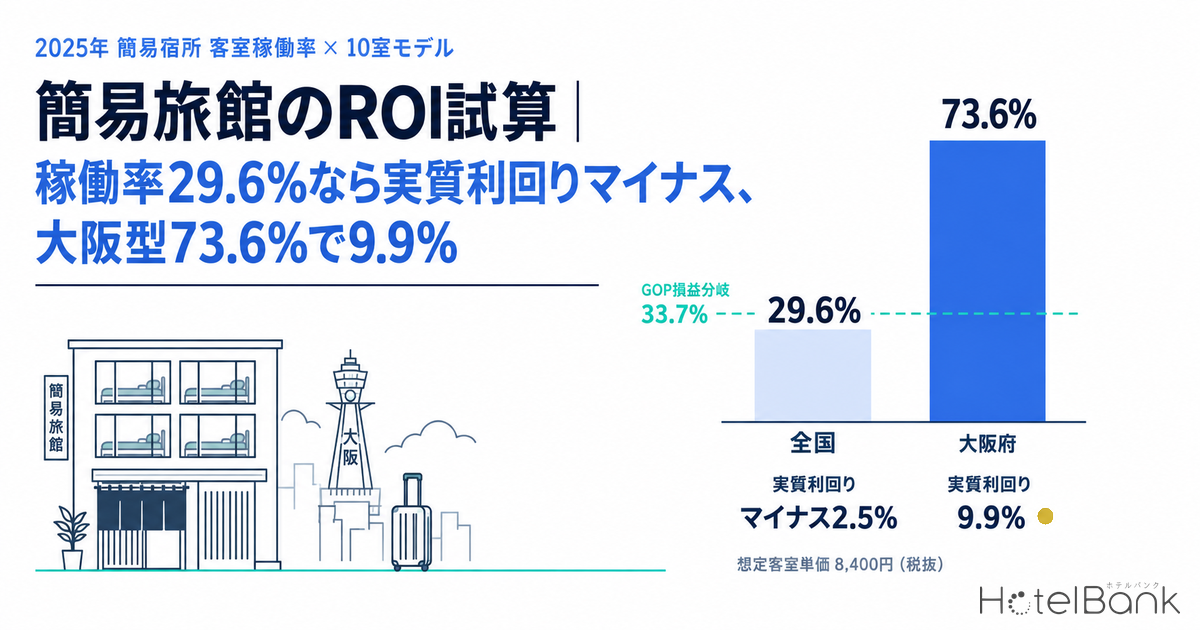
The ROI of a budget inn (a kan’i shukusho, or “simple lodging,” under Japan’s Inns and Hotels Act) is determined almost entirely by room occupancy, far more than by room rate. In the Japan Tourism Agency’s (JTA) Overnight Travel Statistics Survey for full-year 2025, simple lodging occupancy was just 29.6% nationwide (+0.6pt YoY), while Osaka reached 73.6% (final figure; the preliminary figure released on February 27 was 75.2%) — 2.5 times the national level. Starting from this 2025 occupancy gap, this article builds a step-by-step model for a 10-room private-room property: ADR × occupancy × rooms → revenue → GOP → gross/net yield. Under the national-average assumption the net yield is minus 2.5%; under the high-occupancy Osaka assumption it is 9.9%. The numbers show how the same building can lead to opposite investment decisions depending on location.
Metric Definitions Used in This Article
- Room occupancy: Published figures from the JTA Overnight Travel Statistics Survey (rooms occupied ÷ rooms available), using the “simple lodging” facility type. The model uses the final full-year 2025 figures (released July 6, 2026), with the preliminary figures (released February 27, 2026) shown alongside.
- Listed price: The selling price (tax-inclusive) of the cheapest plan published on OTAs and similar channels by properties classified as capsule hotels, guesthouses, dormitories and hostels. Prices for single occupancy and for two guests per room are each summarized as a per-property median, then as the median across properties. This differs from actual transacted prices.
- ADR (assumed room rate in the model): The listed price above (two guests per room) converted to a tax-exclusive basis, used as a modeling assumption. It is not an actual result.
- GOP: Gross operating profit — revenue minus variable costs (OTA and other distribution commissions, housekeeping and linen, consumables, etc.) and fixed operating costs.
- Gross yield = annual revenue ÷ total investment. Net yield = (GOP − property tax, insurance and repair reserve) ÷ total investment.
- Data sources: MetroEngines Research & Consulting; JTA Overnight Travel Statistics Survey
- — Simple lodging occupancy in 2025 was 29.6% nationwide. The top prefectures were Osaka 73.6%, Kyoto 52.0% and Tokyo 48.6% (final figures), with the widest gap exceeding 8x
- — In a 10-room model with an assumed room rate of ¥8,400 (tax-exclusive), the net yield is minus 2.5% at the national-average occupancy of 29.6% (full-year January–December 2025, final figure) and 9.9% at the Osaka-level 73.6% (same basis)
- — The break-even occupancy at which GOP turns positive is 33.7%. A 5% net yield requires 56.1% occupancy, and 8% requires 66.7%
- — Across prefectures, the correlation coefficient between the share of foreign guest-nights and simple lodging occupancy is 0.73. Depth of inbound demand is the first filter for site selection
- — Even the national-average case shows a double-digit gross yield of 15.1%, but after commissions, housekeeping and fixed costs the net yield is negative. Judging by gross yield alone misreads the reality
Simple Lodging Occupancy Is 29.6% Nationwide — the Gap to Osaka’s 73.6% Decides the Yield
According to the JTA Overnight Travel Statistics Survey, room occupancy across all accommodation in 2025 was 61.6% (final figure). By facility type, business hotels posted 75.3% and city hotels 74.1%, while simple lodging was the lowest at 29.6%. However, this national average cannot be used as-is as a benchmark for investment decisions. Simple lodging covers everything from urban hostels and capsule hotels to rural guesthouses (minshuku), mountain huts and vacation rentals, so formats with completely different occupancy dynamics are blended into a single average.
By prefecture, the difference is stark. In 2025, Osaka ranked first nationwide in simple lodging occupancy at 73.6%, followed by Kyoto 52.0%, Tokyo 48.6%, Fukuoka 44.8% and Aichi 38.2%. At the bottom, Akita was 8.9% — a gap of more than 8x between top and bottom. In other words, the answer to “Are budget inns profitable?” depends far less on the category average than on where you build.
Source: Compiled by MetroEngines Research & Consulting from JTA Overnight Travel Statistics Survey (2025 full-year, final figures)
| Prefecture | Occupancy (final) | Occupancy (preliminary) | Foreign guest-night share |
|---|---|---|---|
| National | 29.6% | 29.6% | 27.2% |
| Osaka | 73.6% | 75.2% | 41.7% |
| Kyoto | 52.0% | 53.4% | 55.2% |
| Tokyo | 48.6% | 50.1% | 55.7% |
| Fukuoka | 44.8% | 45.6% | 33.0% |
| Aichi | 38.2% | 37.1% | 21.4% |
| Okinawa | 34.7% | 35.1% | 27.2% |
| Okayama | 33.8% | 33.4% | 11.6% |
| Mie | 33.2% | 34.3% | 4.1% |
| Miyagi | 31.0% | 27.7% | 9.6% |
| Kagawa | 29.6% | 29.2% | 22.9% |
Source: JTA Overnight Travel Statistics Survey (2025 full-year, preliminary/final figures). Foreign guest-night share calculated from total guest-nights across all facility types (final figures)
Note that the preliminary figures released on February 27 showed Osaka at 75.2%, Tokyo at 50.1% and Okinawa at 35.1%; the final figures released on July 6 revised these down to 73.6%, 48.6% and 34.7%, respectively. The national figure was 29.6% in both releases. This article’s model uses the final figures, and the sensitivity to using the preliminary figures is shown later. Revisions between preliminary and final releases are typically within about 1pt for occupancy.
Over time, national simple lodging occupancy fell from 33.4% in 2019 to 15.5% in 2020, then recovered to 25.1% in 2023, 29.0% in 2024 and 29.6% in 2025. It is still 3.8pt below 2019, a slower recovery than hotels (business hotels are 0.5pt below 2019). The recovery has been concentrated in urban areas, which further underscores the importance of site selection.
Source: Compiled by MetroEngines Research & Consulting from JTA Overnight Travel Statistics Survey (2019–2025; 2025 final figures)
Inbound Share and Occupancy Correlate at 0.73 — the First Filter for Site Selection
So what drives simple lodging occupancy up? Plotting each prefecture’s foreign guest-night share (all facility types combined) against simple lodging occupancy using the 2025 final figures yields a correlation coefficient of 0.73 — a strong positive relationship. Osaka (41.7%), Kyoto (55.2%), Tokyo (55.7%) and Fukuoka (33.0%), whose foreign shares exceed the national average (27.2%), all rank in the top five for simple lodging occupancy.
Low-priced bed- and capsule-type rooms fit well with international visitors — especially independent travelers — who want to keep nightly costs down on long trips. By contrast, simple lodging in regions with a low foreign share depends heavily on domestic leisure guests whose demand concentrates on weekends and peak seasons, making it hard to raise annual occupancy. The takeaway: in simple lodging investment, choosing a city with deep inbound demand comes before the building’s specifications as a precondition for yield.
Source: Compiled by MetroEngines Research & Consulting from JTA Overnight Travel Statistics Survey (2025 full-year, final figures) (N=47 prefectures)
That said, Tokyo has the highest foreign share at 55.7%, yet its simple lodging occupancy of 48.6% is 25pt below Osaka. Tokyo has a large total number of properties and a deep supply of business hotels, so budget demand appears to be spread across multiple formats. Inbound share is a necessary condition, not a sufficient one; investors also need to check the supply of competing rooms in the same price range.
Source: Compiled by MetroEngines Research & Consulting from JTA Overnight Travel Statistics Survey (2025 full-year, final figures). Circle size represents simple lodging occupancy (top 10 prefectures, plotted at each prefectural capital)
Budget Segment Listed Prices — Osaka ¥9,200 and Tokyo ¥13,200 for Two per Room
The room rate underlying revenue is set from listed prices at budget properties (capsule hotels, guesthouses, dormitories and hostels) compiled by MetroEngines Research. Listed prices (tax-inclusive) of the cheapest plan for stays on the second Wednesday and second Saturday of each month from September 2025 to August 2026 (24 stay dates in total) were summarized as a per-property median, covering properties with at least six observations.
| Prefecture | Single occupancy | N (properties) | Two per room | N (properties) |
|---|---|---|---|---|
| Osaka | ¥4,600 | 86 | ¥9,200 | 74 |
| Tokyo | ¥6,000 | 151 | ¥13,200 | 118 |
| Kyoto | ¥10,500 | 163 | ¥14,200 | 158 |
| Fukuoka | ¥6,400 | 48 | ¥14,500 | 40 |
| Okinawa | ¥6,100 | 143 | ¥8,500 | 140 |
Source: MetroEngines Research & Consulting (properties classified as capsule hotels, guesthouses, dormitories and hostels)
Osaka’s two-per-room price of about ¥9,200 is 30–40% lower than Tokyo (about ¥13,200), Kyoto (about ¥14,200) and Fukuoka (about ¥14,500). Osaka has the highest occupancy in Japan but moderate prices, making it a market that builds revenue through “low rate × high occupancy.” Tokyo and Kyoto, by contrast, are “high rate × mid occupancy” markets, with higher prices but occupancy of around 50%. To isolate the effect of occupancy in the model below, both scenarios use an assumed room rate of ¥8,400 — Osaka’s two-per-room listed price converted to a tax-exclusive basis.
Dormitory vs. Private Room Pricing — ¥4,600 per Bed × 4 Beds Is About Double a Private Room
Another revenue lever for simple lodging is the mix of dormitory (shared) and private rooms. Looking at Osaka by format over the same period, the cheapest single-occupancy plans were ¥5,000 at capsule hotels (N=13 properties) and ¥5,000 at dormitories (N=7), while two-per-room plans were ¥8,300 at guesthouses (N=33) and ¥9,800 at hostels (N=28). In Tokyo, the figures were ¥4,500 for capsule hotels (single, N=48), ¥4,100 for dormitories (single, N=12), ¥13,200 for guesthouses (two per room, N=33) and ¥15,200 for hostels (two per room, N=51).
Source: MetroEngines Research & Consulting (cheapest-plan listed prices, tax-incl., property median, 24 stay dates Sep 2025–Aug 2026)
If one room is converted into a four-bed dormitory and every bed is filled at Osaka’s single-occupancy median of ¥4,550 (about ¥4,100 tax-exclusive), the room generates about ¥16,500 — roughly double what it earns sold as a private room (¥8,400). Put differently, 50% bed occupancy yields the same revenue as a fully occupied private room. However, dormitories incur housekeeping and linen changes per bed, and add work for common-area management and front-desk operations. In addition, simple lodging under the Inns and Hotels Act is subject to a floor-area standard per guest (3.3㎡), which caps how many beds can be added. A higher dormitory ratio raises the revenue ceiling, but operating costs rise proportionally, and this needs to be built into the model.
Yield Model — Five Steps from ADR × Occupancy × Rooms to Net Yield
Below, we assume a 10-room private-room simple lodging property and calculate step by step from revenue to yield. The assumptions are as follows; all are this article’s own assumptions and do not reflect the results of any specific property or operator.
| Item | Assumption |
|---|---|
| Rooms | 10 rooms (private-room type) |
| ADR (assumed room rate) | ¥8,400 (Osaka two-per-room listed price of ¥9,232 converted to tax-exclusive) |
| OTA/distribution commissions and payment fees | 12% of revenue |
| Consumables, amenities, etc. | 3% of revenue |
| Housekeeping and linen | ¥2,500 per occupied room |
| Fixed operating costs | ¥5.7M per year (management fees and front-desk labor ¥3.0M; utilities and telecom ¥1.8M; systems, insurance, supplies, etc. ¥0.9M) |
| Property tax, insurance and repair reserve | ¥0.8M per year |
| Total investment | ¥60M (including building acquisition, change of use, fire-safety equipment and interiors) |
The calculation has five steps: (1) Room nights sold = rooms × 365 days × occupancy; (2) Revenue = room nights sold × ADR; (3) GOP = revenue × (1 − 15% variable cost ratio) − room nights sold × housekeeping cost per room − fixed operating costs; (4) NOI = GOP − property tax, insurance and repair reserve; (5) Gross yield = revenue ÷ total investment, and net yield = NOI ÷ total investment. Housekeeping cost is tied to room nights sold because housekeeping tends to be the largest variable cost in simple lodging; average length of stay also moves housekeeping cost materially, since fewer turnovers mean fewer full cleans.
| Item | A. National-average case | B. Osaka case |
|---|---|---|
| Room occupancy (2025) | 29.6% (national) | 73.6% (Osaka) |
| (1) Room nights sold | 1,080 | 2,686 |
| (2) Revenue | ¥9.08M | ¥22.57M |
| OTA commissions and consumables (15%) | ¥1.36M | ¥3.38M |
| Housekeeping and linen | ¥2.70M | ¥6.72M |
| Fixed operating costs | ¥5.70M | ¥5.70M |
| (3) GOP | −¥0.69M | ¥6.76M |
| GOP margin | −7.6% | 30.0% |
| Property tax, insurance and repair reserve | ¥0.80M | ¥0.80M |
| (4) NOI | −¥1.49M | ¥5.96M |
| (5) Gross yield (revenue ÷ investment) | 15.1% | 37.6% |
| (5) Net yield (NOI ÷ investment) | −2.5% | 9.9% |
Source: JTA Overnight Travel Statistics Survey (2025 full-year, final figures); MetroEngines Research & Consulting estimates
Source: MetroEngines Research & Consulting estimates
In the national-average case (occupancy: 29.6% national), annual revenue is about ¥9.08M and the gross yield of 15.1% looks attractive at first glance. But after commissions, housekeeping and fixed costs, GOP is −¥0.69M and the net yield is −2.5% — the property cannot absorb its fixed operating costs. The fact that net yield can be negative even when gross yield is in double digits is probably the most commonly overlooked point in simple lodging investment.
In the Osaka case (occupancy: 73.6% Osaka), revenue rises to about ¥22.57M, GOP to about ¥6.76M (GOP margin 30.0%), and the net yield reaches 9.9%. Because the ¥5.7M in fixed costs is the same regardless of occupancy, higher occupancy spreads fixed costs more thinly per room, and profit accelerates. Using the preliminary figure of 75.2%, the net yield would be 10.4% — only about 0.5pt different from the final-figure result.
For reference, we also model a Tokyo case. With occupancy of 48.6% (full-year January–December 2025, final figure), a rate of ¥12,000 (Tokyo’s two-per-room listed price of about ¥13,200 converted to tax-exclusive), and total investment of ¥90M reflecting land prices, the net yield is 8.0%. Higher rates compensate for the occupancy gap, showing that “high rate × mid occupancy” markets can also be investable depending on the combination of location and acquisition price.
Break-Even Occupancy Is 33.7% — an 8% Net Yield Requires 66.7%
We next check sensitivity to the two most volatile assumptions: occupancy and room rate. At an assumed rate of ¥8,400, the break-even occupancy at which GOP turns positive is 33.7%, and NOI turns positive at 38.4%. A 5% net yield requires 56.1% occupancy, and 8% requires 66.7%. Applied to 2025 results, only Osaka (73.6%) recorded occupancy high enough to exceed an 8% net yield; Kyoto (52.0%) and Tokyo (48.6%) would fall below 5% without a higher rate or a lower investment amount.
Source: MetroEngines Research & Consulting estimates (10 rooms, total investment ¥60M)
| Rate \ Occupancy | 29.6% | 40% | 48.6% | 60% | 73.6% |
|---|---|---|---|---|---|
| ¥7,000 | −4.6% | −2.4% | −0.6% | 1.8% | 4.6% |
| ¥8,400 | −2.5% | 0.5% | 2.9% | 6.1% | 9.9% |
| ¥10,000 | 0.0% | 3.8% | 6.9% | 11.1% | 16.0% |
| ¥12,000 | 3.0% | 7.9% | 11.9% | 17.3% | 23.6% |
Source: MetroEngines Research & Consulting estimates. Occupancy of 29.6% = national, 48.6% = Tokyo, 73.6% = Osaka (all 2025 final figures)
The table shows that at an occupancy level of 48.6%, raising the rate by ¥1,000 (net yield +2.5pt) has roughly the same effect as raising occupancy by about 9pt. If the rate is cut to ¥7,000, the net yield stays at 4.6% even at 73.6% occupancy. A strategy of chasing occupancy through low prices rarely translates into profit in simple lodging, where housekeeping costs rise in proportion to room nights sold. Instead, a design that secures rate through private-room quality and a dormitory mix while building occupancy offers the greatest upside in yield.
Four Decision Points — Location, Inbound Demand, Operating Costs and Room Mix
| Decision point | What to check | Impact on yield |
|---|---|---|
| Location | Is it a city where 2025 simple lodging occupancy exceeds 50% (Osaka 73.6%, Kyoto 52.0%), or one close to that level (Tokyo 48.6%, Fukuoka 44.8%)? | 10pt of occupancy moves net yield by about 2.8pt (at a ¥8,400 rate) |
| Inbound share | Does the foreign guest-night share exceed the national average of 27.2%? | Prefecture-level correlation coefficient of 0.73; also tends to smooth seasonal demand swings |
| Operating cost structure | Outsource or in-house housekeeping? Can the front desk be unstaffed? | Cutting fixed costs by ¥1M lowers break-even occupancy by about 5.9pt |
| Room mix | Ratio of dormitory to private rooms; beds per room | A fully booked four-bed dormitory earns about twice a private room; per-bed housekeeping costs and floor-area standards set the ceiling |
Source: JTA Overnight Travel Statistics Survey; MetroEngines Research & Consulting estimates
Operating cost structure in particular is the largest variable an operator can control once the location is decided. In this model, ¥3.0M of the ¥5.7M in fixed operating costs is labor and management fees; if self check-in and outsourced housekeeping can cut fixed costs by ¥1M, the GOP break-even occupancy falls from 33.7% to about 27.8%. That is low enough for GOP to turn positive even at the national average of 29.6%, which likely explains why family-run and side-business operations remain viable at small rural properties. The choice of operating structure — lease, management contract or franchise — also shapes how revenue and costs are split between owner and operator.
Simple Lodging vs. Private Lodging (Minpaku) — 365 Days vs. a 180-Day Annual Cap
When considering simple lodging investment, the usual point of comparison is the private lodging business (minpaku) under the Private Lodging Business Act. Both involve accommodating guests for a fee, but they differ sharply in the cap on operating days and the requirements placed on the building, which directly affects the ceiling on yield.
| Item | Simple lodging business | Private lodging business (minpaku) |
|---|---|---|
| Governing law | Inns and Hotels Act (simple lodging business) | Private Lodging Business Act |
| Procedure | License from the prefectural governor, etc. | Notification to the prefectural governor, etc. |
| Definition | A business that accommodates guests for a fee in facilities whose structure and equipment are mainly for accommodation shared by many people | A business in which a person other than a licensed inn/hotel operator accommodates guests in a dwelling for a fee, for no more than 180 days per year |
| Operating days | No cap (365 days) | Capped at 180 days per year |
| Room floor-area standard | Total guest-room floor area of 33㎡ or more (for fewer than 10 guests, 3.3㎡ × number of guests or more) | Living space of 3.3㎡ or more per guest |
| Building use | Hotel/inn use (generally not permitted in exclusively residential zones) | Remains a dwelling (local ordinances may restrict areas and periods) |
| Impact on yield | Occupancy can reach 100% under the rules, but initial investment for change of use and fire-safety equipment is large | Because of the 180-day cap, operating days are limited to about 49% of 365 |
Source: Compiled by MetroEngines Research & Consulting from Ministry of Health, Labour and Welfare, “About the Inns and Hotels Act,” and JTA Private Lodging Business Act portal site
Because private lodging is capped at 180 days per year, operating days are limited to about 49% of 365. Applied to this article’s 10-room model, the property could clear the 33.7% break-even, but the rules make it impossible to reach the 56.1% needed for a 5% net yield. To capture yield in a high-occupancy market like Osaka, the licensed simple lodging business — which can operate 365 days — has the higher revenue ceiling. In exchange, it requires a change of building use to hotel/inn (a building confirmation is required if the area exceeds 200㎡) and fire-safety equipment such as automatic fire alarm systems, lengthening both initial investment and the time to licensing. The choice between the two regimes comes down to the balance between expected occupancy and the payback period on initial investment.
Summary
The biggest determinant of budget inn (simple lodging) ROI is room occupancy, which in 2025 ranged from 29.6% nationwide to 73.6% in Osaka. In a model with 10 rooms, an assumed room rate of ¥8,400 and total investment of ¥60M, the net yield was −2.5% at national-average occupancy and 9.9% in the Osaka case; GOP break-even was 33.7%, and an 8% net yield required 66.7%. Because gross yield exceeds 15% even in the national-average case, judging on gross yield alone easily misreads the reality.
A rational sequence for the investment decision is: first, choose a city with deep inbound demand (correlation of 0.73 with the foreign share); next, check competing supply in the same price range; and finally, optimize the combination of rate and occupancy through housekeeping and front-desk operating costs and the dormitory ratio. The higher a city’s occupancy, the more fixed costs are absorbed and the greater the upside in yield. We recommend replacing the assumptions with your own property’s conditions and testing both occupancy and rate using the sensitivity table.
Frequently Asked Questions (FAQ)
Q. What is a typical yield for a budget inn (simple lodging)?
A. In this article’s 10-room model (assumed room rate ¥8,400, total investment ¥60M), the net yield was −2.5% at the 2025 national-average occupancy (29.6%) and 9.9% at Osaka’s 73.6%. A 5% net yield requires 56.1% occupancy and 8% requires 66.7%, so the difference by location is extremely large.
Q. Why is national simple lodging occupancy so low at 29.6%?
A. Simple lodging includes not only urban hostels and capsule hotels but also rural guesthouses, mountain huts and vacation rentals, and formats whose demand concentrates in peak seasons appear to pull the average down. By prefecture, Osaka is at 73.6% versus 8.9% in Akita — a gap of more than 8x.
Q. What is the difference between simple lodging and private lodging (minpaku)?
A. The simple lodging business requires a license under the Inns and Hotels Act and has no cap on operating days. The private lodging business requires notification under the Private Lodging Business Act and is capped at 180 days per year, so its operating days are limited to about 49% of 365.
Q. Which is better for yield: dormitories or private rooms?
A. Based on Osaka listed prices, a fully booked four-bed dormitory earns about twice as much as the same room sold as a private room. However, housekeeping and linen costs arise per bed, and there is a floor-area standard of 3.3㎡ per guest, so the ratio should be set with operating costs and the cap on beds in mind.
Related Articles
References and Sources
■ Data sources
Room occupancy and guest-nights are from the JTA Overnight Travel Statistics Survey, full-year 2025 (final figures released July 6, 2026; preliminary figures released February 27, 2026). Listed prices cover, within the scope tracked by MetroEngines Research, properties classified as capsule hotels, guesthouses, dormitories and hostels (Osaka 281, Tokyo 381, Kyoto 695, Fukuoka 84, Okinawa 340 properties), aggregating those with at least six observation days (N in the tables). Stay dates were the second Wednesday and second Saturday of each month from September 2025 to August 2026, 24 days in total.
■ Model assumptions
Room count, rate, costs and investment amount are this article’s assumptions, not the results of any specific property or operator. The assumed room rate was converted to tax-exclusive by dividing the tax-inclusive listed price by 1.1. Housekeeping costs are proportional to room nights sold, commissions and consumables proportional to revenue, and fixed operating costs and property tax etc. constant regardless of occupancy. Borrowing, depreciation and corporate tax are not considered.
■ Limitations and caveats
Listed prices are the published prices of the cheapest plans and differ from actual transacted prices. JTA simple lodging occupancy is the average of all simple lodging in each prefecture, not only budget properties in city centers. The foreign guest-night share is for all facility types combined, not simple lodging alone. Correlation does not imply causation.
■ Market data
- MetroEngines Research & Consulting — Cheapest-plan listed prices at budget properties (Osaka N=74–86, Tokyo N=118–151, Kyoto N=158–163, Fukuoka N=40–48, Okinawa N=140–143 properties)
■ Government statistics and public sources
- Japan Tourism Agency, Overnight Travel Statistics Survey (2025 full-year, preliminary figures) (released February 27, 2026)
- Japan Tourism Agency, Overnight Travel Statistics Survey (2025 full-year, final figures) (released July 6, 2026)
- Japan Tourism Agency, Overnight Travel Statistics Survey statistics page
- Ministry of Health, Labour and Welfare, “About the Inns and Hotels Act”
- Japan Tourism Agency, Private Lodging Business Act portal site