

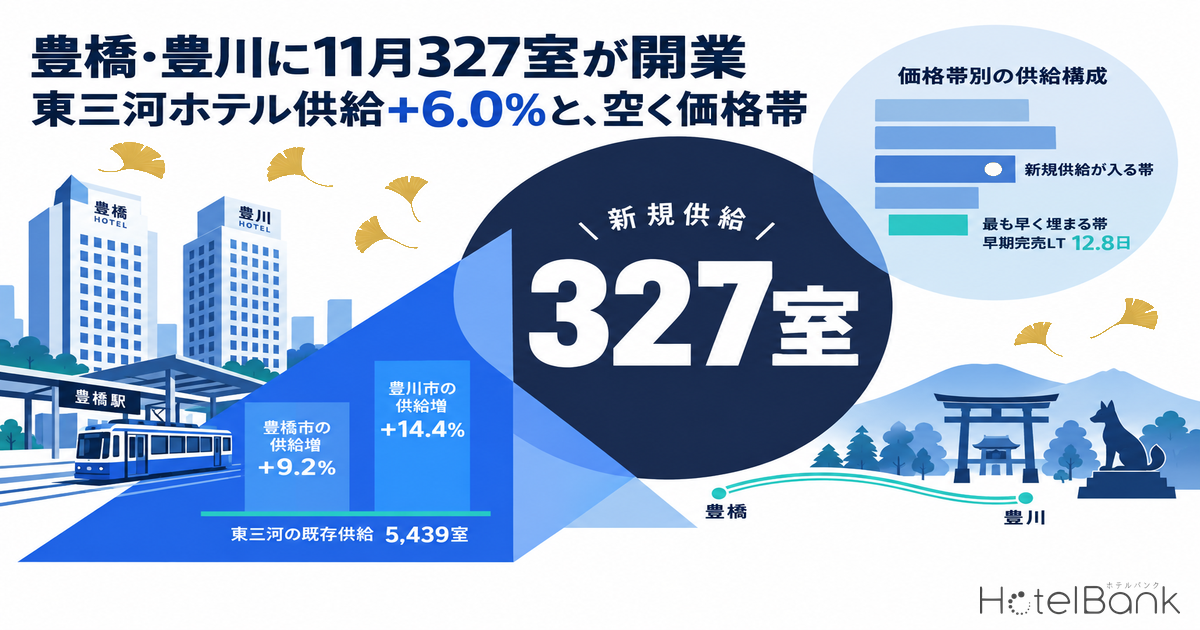
In November 2026, two hotels will open nine days apart in Toyohashi and Toyokawa, the core cities of the Higashi-Mikawa (East Mikawa) region of Aichi Prefecture: 215 rooms six minutes’ walk from the east exit of Toyohashi Station, and 112 rooms in a mixed-use building in front of Toyokawa Station. The combined 327 rooms equal 10.5% of the 3,111 existing rooms in the two cities whose sales activity can be confirmed on OTAs. This article re-tallies room supply across the five Higashi-Mikawa cities (Toyohashi, Toyokawa, Gamagori, Tahara and Shinshiro), then cross-references estimated settled ADR against inventory absorption (early sell-out lead time) to quantify which price band these 327 rooms are likely to land in, and which price bands keep inventory unsold until the very end.
Metric Definitions Used in This Article
- ADR (Average Daily Rate): An estimated settled rate (tax-excluded equivalent), calculated by applying segment-specific adjustment factors to the lowest-plan rate each property publishes on OTAs and elsewhere (per room, 2 guests, tax included). Checked against property-level results disclosed by listed hotel REITs (91 properties, most recent 3 months), the median error is about 7%. These are estimates and differ from each property’s actual settled prices and accounting figures. City-level ADR is the median of the covered properties (the level of a typical property in that area).
- LT (Lead Time): Days until check-in. LT0 = same day.
- Early sell-out LT: The lead time at which remaining rooms first reached zero (a larger value means the property sold out earlier).
- Remaining-room ratio of OTA-published inventory: Rooms remaining at each lead time, expressed as a share of the maximum inventory observed on OTAs for that stay date (= 100).
- Listed price: Rate per room for 2 guests (tax included, average of all plans). Because its basis differs from ADR, the two are not compared directly.
- Data sources: MetroEngines Research & Consulting / Ministry of Land, Infrastructure, Transport and Tourism (MLIT) Real Estate Information Library
- — In November 2026, Toyohashi (215 rooms) and Toyokawa (112 rooms) will see openings nine days apart. That is +6.0% against the existing 5,439 rooms across the five Higashi-Mikawa cities, and +9.2% for Toyohashi and +14.4% for Toyokawa on their own.
- — Demand-side pricing is diverging within the same market area. Toyohashi’s estimated settled ADR is +6.7% YoY (about ¥7,200 → ¥7,700), while Toyokawa’s is −5.7% YoY. Official land prices point the same way: Toyohashi +5.3% over two years, Toyokawa flat for three years.
- — 40–50% of supply in both cities is concentrated in the ¥6,000–8,000 band, and the 327 new rooms are likely to land there too. After the openings the band reaches 45.2% in Toyohashi and 53.3% in Toyokawa, so competition will turn on factors other than price.
- — Inventory fills from the bottom price band up. At LT30, 25.1% of OTA-published inventory was absorbed below ¥8,000 versus 9.6% at ¥8,000 and above; at LT14 the figures were 36.7% vs 18.6%. The gap persisted even after controlling for property size.
- — ¥8,000 is where the revenue model changes. Raising the assumed ADR from ¥7,500 to ¥8,000 lifts the sell-out ceiling, but cumulative room revenue at LT30 falls 59% in our reference calculation, making a revenue strategy that captures last-minute demand a prerequisite.
327 Rooms, Nine Days Apart in November — Two New Openings in Higashi-Mikawa
MetroEngines Research & Consulting tracks 22 new openings in Aichi Prefecture in 2026 (based on confirmed OTA listings). Four of them are in the five Higashi-Mikawa cities, but excluding two single-unit vacation rentals, only two are hotels, and both open in November.
| Property | Location | Rooms | Opening date | Location & configuration |
|---|---|---|---|---|
| Toyoko Inn Toyohashi-eki-mae Odori (東横INN豊橋駅前大通り) | 3-2-1 Ekimae-odori, Toyohashi | 215 | November 6, 2026 | 6 min walk from the east exit of JR/Meitetsu Toyohashi Station; 14 floors above ground. 104 singles, 26 wide singles, 7 Premium Plus, 39 economy doubles, 13 doubles, 23 twins, 3 Heartful (accessible twin) rooms |
| Tabino Hotel lit Toyokawa (たびのホテルlit豊川) | Toyokawa (inside FRONTIS TOYOKAWA) | 112 | November 15, 2026 | Guest rooms on floors 6–11 of a 12-story mixed-use building in front of Toyokawa Station; artificial hot-spring large bath, sauna and lounge on the 12th floor. Mainly doubles and twins, including suites for up to 5 guests. Operated by Sunfrontier Hotel Management |
Source: Compiled by MetroEngines Research & Consulting from company announcements (Toyoko Inn release dated September 15, 2026; Sun Frontier Fudousan release dated May 13, 2026)
The Toyohashi property is a high-rise, single-room-focused hotel facing Ekimae-odori, and will be Toyoko Inn’s second location in Toyohashi and 17th in Aichi Prefecture. According to the announcement, it will have the most rooms of any hotel around Toyohashi Station as of September 15, 2026. The Toyokawa property occupies a redevelopment mixed-use building in front of the station, with a large bath and sauna on the top floor and microwaves and two-door refrigerators in rooms — a design explicitly aimed at extended-stay demand. Its mix centers on doubles and twins and includes suites for up to five guests.
Defining the Denominator — 77 Properties and 5,439 Rooms in Five Cities
Measuring supply impact requires a definition of the denominator. Higashi-Mikawa includes a certain number of properties that are temporarily closed, not listed on OTAs, or double-registered after a name change, so using the raw count in a property master makes the denominator unstable. This article therefore counts only properties for which estimated settled ADR could be calculated continuously over the most recent 12 months (September 2025–August 2026) — that is, properties with actual sales observed on OTAs.
| City | Properties | Rooms | Median ADR | Median early sell-out LT | Main composition |
|---|---|---|---|---|---|
| Toyohashi | 19 | 2,332 | ¥7,247 | 3.3 days | 13 business, 3 city, 1 resort, 1 ryokan, etc. |
| Toyokawa | 8 | 779 | ¥6,294 | 1.9 days | 7 business, 1 ryokan |
| Gamagori | 21 | 1,200 | ¥15,297 | 16.0 days | 10 hot-spring ryokan, 9 business, 1 resort, etc. |
| Tahara | 17 | 772 | ¥7,988 | 8.7 days | 9 ryokan, 5 business, 3 resort |
| Shinshiro | 12 | 356 | ¥13,802 | 5.5 days | 11 ryokan, 1 business |
| Higashi-Mikawa total | 77 | 5,439 | — | — | The 327 new rooms equal 6.0% of the total |
Source: MetroEngines Research & Consulting (77 properties with estimated settled ADR calculable for September 2025–August 2026. Early sell-out LT covers the 14 check-in dates from August 31 to September 13, 2026, and only properties whose OTA-published inventory is at least 30% of total rooms)
On this definition, adding 215 rooms to Toyohashi’s 2,332 is +9.2%, adding 112 rooms to Toyokawa’s 779 is +14.4%, and against the 5,439 rooms across all five cities the increase is +6.0%. That is not a small increment for a single year. In Toyokawa in particular, only four of the eight existing properties have more than 100 rooms, so a 112-room entrant is large enough to change the composition of the market itself.
Toyohashi +6.7%, Toyokawa Soft — Two Years of Estimated Settled ADR
As a premise for rising supply, we look at how demand-side pricing has moved. Overlaying the two cities’ estimated settled ADR year by year shows that, even within Higashi-Mikawa, they are heading in different directions.
Source: MetroEngines Research & Consulting (Toyohashi N=19 properties / Toyokawa N=8 properties, settled months only)
Comparing January–August averages, Toyohashi rose from about ¥7,200 in 2025 to about ¥7,700 in 2026, +6.7% YoY. In August it reached about ¥8,100, in the upper range of the observation period. Toyokawa, by contrast, eased from about ¥6,900 to about ¥6,500 over the same period, −5.7% YoY. The two cities are within 20 minutes of each other on the JR Iida Line and the Meitetsu Nagoya Main Line and form a contiguous market area, yet their rate trends are not in sync. Rate gaps of this kind between municipalities are wide across Aichi Prefecture as a whole, with full-year median ADR varying by a factor of about 2.8 across 23 municipalities.
This divergence is also consistent with the movement in official land prices discussed below. The median commercial land price in Toyohashi rose continuously from 2023 to 2025, while Toyokawa’s commercial median was essentially flat for three years. Rates and land prices pointing the same way suggests that Toyohashi’s increase is not a one-off, event-driven effect but may be supported by the depth of the market area itself.
Supply by Price Band — Where Will the 327 Rooms Land?
Next, we stratify the two cities’ existing supply by estimated settled ADR band. The two new properties have no sales record yet, so their price band cannot be confirmed. However, Toyoko Inn uses a single-room-focused pricing design nationwide, and the estimated settled ADR of the brand’s existing Toyohashi property is about ¥7,200. Tabino Hotel lit Toyokawa, with its large bath and extended-stay amenities, can reasonably be expected to price close to Toyokawa properties with comparable facilities. Both are highly likely to land in the ¥6,000–8,000 band.
Source: MetroEngines Research & Consulting (Toyohashi N=19 properties, 2,332 rooms / Toyokawa N=8 properties, 779 rooms)
| Price band (estimated settled ADR) | Toyohashi properties | Toyohashi rooms | Share | Median early sell-out LT |
|---|---|---|---|---|
| Under ¥6,000 | 4 | 238 | 10.2% | 12.8 days (n=3) |
| ¥6,000–7,999 | 7 | 937 | 40.2% | 3.6 days (n=4) |
| ¥8,000–9,999 | 5 | 794 | 34.0% | 0.1 days (n=3) |
| ¥10,000–14,999 | 2 | 313 | 13.4% | 0.8 days (n=2) |
| ¥15,000 and above | 1 | 50 | 2.1% | 7.6 days (n=1) |
Source: MetroEngines Research & Consulting (Early sell-out LT covers the 14 check-in dates from August 31 to September 13, 2026, and only properties whose OTA-published inventory is at least 30% of total rooms. For Toyohashi, inventory data was available for 19 of the 64 target properties, and the 13 meeting the criteria were tallied)
Toyohashi’s supply is concentrated in the ¥6,000–8,000 band (40.2%) and the ¥8,000–10,000 band (34.0%); these two bands alone account for three-quarters of the total. If the 215 rooms enter the ¥6,000–8,000 band, it grows from 937 to 1,152 rooms and its share rises to 45.2%. Toyokawa is similar: adding 112 rooms to the 363 in its ¥6,000–8,000 band yields 475 rooms, or 53.3%, meaning more than half the market would sit in a single price band.
Conversely, the upper bands are thin. In Toyohashi only two properties (313 rooms, 13.4%) are above ¥10,000, and only one (50 rooms, 2.1%) is above ¥15,000. In Toyokawa, apart from one 11-room ryokan known for its cuisine, there is no inventory above ¥10,000 at all.
The Higher the Rate, the Later the Sell-Out — Price Band vs. Inventory Absorption
“The upper bands are thin” does not immediately mean “there is demand in the upper bands.” Supply may be thin precisely because there is no demand there. We therefore cross-referenced each property’s estimated settled ADR against its early sell-out LT.
Source: MetroEngines Research & Consulting (Toyohashi and Toyokawa, N=18 properties. Averages over the 14 check-in dates from August 31 to September 13, 2026; only properties whose OTA-published inventory is at least 30% of total rooms. Individual property names are not shown)
The distribution is clear. Properties with estimated settled ADR below ¥8,000 show early sell-out LTs spread widely from under one day to 33 days, whereas almost all properties above ¥8,000 are under one day — that is, inventory remains until just before the stay date. One resort in the ¥16,000 range (early sell-out LT 7.6 days) is an exception, reflecting its different, weekend-driven demand profile.
This relationship, however, is confounded by property size. Properties tend to get larger as price bands rise (an average of 60 rooms in the under-¥6,000 band versus 159 rooms in the ¥8,000–10,000 band), and naturally more inventory takes longer to sell out. We therefore normalized each property’s maximum OTA inventory for the stay date to 100 and compared remaining-room ratios by lead time.
Source: MetroEngines Research & Consulting (Below ¥8,000: N=11 properties, 44 series / ¥8,000 and above: N=7 properties, 28 series; medians of observations for check-ins on September 2, 3, 9 and 10, 2026)
The gap persisted even after controlling for size. At LT30, the band below ¥8,000 had absorbed 25.1% of its published inventory versus 9.6% for the band at ¥8,000 and above. At LT14 absorption was still 36.7% vs 18.6%, with the lower band moving at roughly twice the pace. The two converge only around LT7, after which last-minute demand arrives in bulk.
In other words, in Higashi-Mikawa’s core cities, demand fills from the bottom price band up, and the upper bands do not move until the last minute. The thinness of inventory above ¥10,000 likely reflects not room for more supply but a thin layer of guests willing to book early at that price. Nationally, the ADR ¥8,000–10,000 band sells out fastest, so the center of gravity of absorption in Higashi-Mikawa differs from the national picture.
Properties with a Track Record of Early Sell-Outs (Toyohashi and Toyokawa)
| # | Property | City | Total rooms | Avg. early sell-out LT | Days sold out |
|---|---|---|---|---|---|
| 1 | Business Hotel Okadaya Toyohashi (ビジネスホテル おかだ家 豊橋) | Toyohashi | 53 | 32.5 days | 14/14 days |
| 2 | Toyoko Inn Toyohashi-eki Higashi-guchi (東横INN豊橋駅東口) | Toyohashi | 134 | 22.9 days | 14/14 days |
| 3 | Toyokawa Grand Hotel (豊川グランドホテル) | Toyokawa | 58 | 13.2 days | 14/14 days |
| 4 | New Toyo Hotel 1 (ニュー東洋ホテル1) | Toyohashi | 70 | 12.8 days | 14/14 days |
| 5 | Toyohashi Business Hotel (豊橋ビジネスホテル) | Toyohashi | 26 | 11.1 days | 14/14 days |
Source: MetroEngines Research & Consulting (14 check-in dates from August 31 to September 13, 2026. Tallied 13 of 64 target properties in Toyohashi and 5 of 37 in Toyokawa. Properties whose OTA-published inventory is less than 30% of total rooms are excluded)
Every property at the top of the list sold out (zero rooms remaining) on all 14 check-in dates. Toyoko Inn Toyohashi-eki Higashi-guchi in particular, despite its 134 rooms, sold out an average of 22.9 days ahead, demonstrating solid pulling power in the value segment in front of Toyohashi Station. That the same brand’s 215-room property opening in November adds supply to this proven price band is a rational design in terms of the market’s capacity to absorb it.
Landing-Band Sensitivity — What Changes Depending on Where the 327 Rooms Enter
The analysis so far rests on a single assumption: that the two new properties land in the ¥6,000–8,000 band. Neither has a sales record yet, and since the assumption itself is an estimate, we need to look separately at what changes if the landing band shifts up or down. Below is the change in share by landing band when 215 rooms are added to Toyohashi’s price-band supply (2,332 existing rooms).
| Scenario | Landing band of the new properties | Band share (before → after opening) | Band median early sell-out LT | Interpretation |
|---|---|---|---|---|
| Optimistic (upper band) | ¥8,000–9,999 | 34.0% → 39.6% 794 → 1,009 rooms | 0.1 days | A band where rates hold but inventory remains until just before the stay date. Upside in room rate and slower absorption offset each other |
| Middle (base case) | ¥6,000–7,999 | 40.2% → 45.2% 937 → 1,152 rooms | 3.6 days | Demand is confirmed, but over 40% of the market concentrates in one band and products become increasingly homogeneous |
| Pessimistic (lower band) | Under ¥6,000 | 10.2% → 17.8% 238 → 453 rooms | 12.8 days | A large block of supply enters the thin band that sells out fastest, erasing the pricing headroom left in the existing lower band |
Source: MetroEngines Research & Consulting (215 new rooms added to the price-band composition of Toyohashi, N=19 properties, 2,332 rooms. Median early sell-out LT covers the 14 check-in dates from August 31 to September 13, 2026, and only properties whose OTA-published inventory is at least 30% of total rooms)
Looking at share alone, the pessimistic scenario swings the most, but in revenue terms it is the optimistic scenario that matters. Because the pace of inventory absorption changes discontinuously at ¥8,000, a higher rate does not necessarily translate directly into higher revenue. Applying the published-inventory absorption rates measured in the previous section (below ¥8,000: 25.1% at LT30 and 36.7% at LT14; ¥8,000 and above: 9.6% and 18.6%) uniformly to each assumed ADR and accumulating gives the following.
| Assumed ADR (estimated settled) | At LT30 | At LT14 | If published inventory sells out | LT30 vs. ¥7,500 |
|---|---|---|---|---|
| ¥6,000 | ¥150,600 | ¥220,200 | ¥600,000 | 80% |
| ¥7,000 | ¥175,700 | ¥256,900 | ¥700,000 | 93% |
| ¥7,500 | ¥188,300 | ¥275,300 | ¥750,000 | 100% |
| ¥8,000 | ¥76,800 | ¥148,800 | ¥800,000 | 41% |
| ¥8,500 | ¥81,600 | ¥158,100 | ¥850,000 | 43% |
| ¥9,500 | ¥91,200 | ¥176,700 | ¥950,000 | 48% |
Source: MetroEngines Research & Consulting (Absorption rates: below ¥8,000 N=11 properties, 44 series / ¥8,000 and above N=7 properties, 28 series; medians of observations for check-ins on September 2, 3, 9 and 10, 2026. Shaded rows apply the ¥8,000-and-above absorption rates)
The key point is that the numbers break at the shaded boundary. Raising the rate by ¥500, from ¥7,500 to ¥8,000, lifts the sell-out ceiling by ¥50,000, but cumulative revenue 30 days before the stay date falls 59%, from ¥188,300 to ¥76,800. Even at LT14 it nearly halves, from ¥275,300 to ¥148,800. To win back through rate the absorption that was banked early, a substantial volume must be sold in the remaining two weeks.
Assumptions behind this calculation: Absorption rates are medians for each price band applied uniformly to the given ADR, and are reference values, not actual results for any individual property. The purpose is a relative comparison per 100 rooms of published inventory; each property’s actual room count, sales-channel mix and fixed costs are not considered. Because absorption was observed on four stay dates in September 2026, differences between peak and off-peak seasons are not reflected.
Which Price Bands Stay Open — Three Readings
1. Fills fastest: under ¥6,000
Only 238 rooms (10.2%) in Toyohashi, with a median early sell-out LT of 12.8 days — the fastest of any band. It is dominated by small, older properties and receives no new supply. Options in this band disappear two weeks before the stay date, which also means existing operators still have a revenue opportunity in revisiting their pricing.
2. Where the 327 new rooms enter: ¥6,000–8,000
Already the thickest band, at 40.2% in Toyohashi and 46.6% in Toyokawa. The median early sell-out LT in Toyohashi is 3.6 days: demand is certainly there, but absorption skews to the middle and later part of the booking window. Adding 327 rooms takes the band to 45–53% of supply in both cities, making product differentiation within the band (large baths, extended-stay amenities, range of room types) the axis of competition.
3. Stays open to the end: above ¥8,000
This band makes up 1,157 rooms (49.6%) in Toyohashi, but its median early sell-out LT is 0.1–0.8 days, with inventory remaining until the day before the stay. It is not that supply is thin but that the layer of guests booking early is thin. Rather than stacking up rooms through new entry, there is more room for a revenue strategy that captures last-minute demand at higher rates.
The implications for investment decisions are as follows. If you are adding rooms in Higashi-Mikawa’s core cities, the ¥6,000–8,000 band, where demand is confirmed, is the realistic landing point. But this band will thicken further with the 327 new rooms, so offering the same product at the same price makes it hard to stand out. From the perspective of existing stock, there is pricing headroom in the lower band that sells out fastest, and upside from lead-time-based pricing in the upper bands where inventory remains until the last minute.
Location Fundamentals — Official Land Prices, Zoning and Station Ridership
If the gaps in rates and inventory reflect differences in the depth of the market area, they should also show up in real estate indicators. We obtained official land prices for both cities from the MLIT Real Estate Information Library.
Source: Compiled by MetroEngines Research & Consulting from the MLIT Real Estate Information Library (official land prices) (Toyohashi commercial N=27 points, residential N=44–45 points / Toyokawa commercial N=15–16 points, residential N=31–32 points)
Toyohashi’s median commercial land price rose from ¥131,000/㎡ in 2023 to ¥138,000/㎡ in 2025, +5.3% over two years, with the median year-on-year change running at +2.0–2.6% each year. The highest-priced point is in front of Toyohashi Station at ¥625,000/㎡ (+2.8% YoY), and even a point 300m from the station is ¥416,000/㎡ (+2.2%), indicating that appreciation around the station is spreading across the area. In Toyokawa, the median commercial price barely moved (¥97,900 → ¥97,500 → ¥97,500), with a median YoY change of 0.0% for three years. Residential land in both cities has been edging up slightly.
Both new sites are zoned commercial. The Toyokawa site (FRONTIS TOYOKAWA) is designated with a 400% floor-area ratio and 80% building coverage ratio, and the 12-story mixed-use format can be seen as using this allowance to the full. The Toyohashi site is also within a commercial zone, where a 14-story building is feasible.
Source: Compiled by MetroEngines Research & Consulting from the MLIT Real Estate Information Library (station ridership, National Land Numerical Information)
We also look at how far travel demand has recovered. Daily passengers at Shin-Toyohashi Station (Toyohashi Railroad Atsumi Line), adjacent to Toyohashi Station, fell from 17,989 in FY2019 to 11,072 in FY2020, then recovered to 16,327 in FY2023 — 90.8% of the FY2019 level. Toyokawa Station (JR) went from 6,625 to 6,030 (91.0%), and Toyokawa-inari Station (Meitetsu) from 5,239 to 5,025 (95.9%). All are on a recovery trend, but in absolute terms Toyohashi is 2.5–3 times the scale of Toyokawa.
Note that Toyohashi Station is shared by JR and Meitetsu and its ridership cannot be separated by operator, so the trend in foot traffic around the station has to be read from these nearby stations.
Room Supply Map: Toyohashi and Toyokawa
Source: MetroEngines Research & Consulting (N=27 properties with estimated settled ADR calculable over the most recent 12 months)
On the map, circle size shows room count and color shows the estimated settled ADR band. In Toyohashi, more than 10 properties are clustered within a 500m radius of the station’s east exit, and the 215 rooms will join them. Toyokawa divides into three clusters — in front of Toyokawa Station, around Toyokawa Inari, and around the Toyokawa IC — and the 112 rooms will enter the station-front cluster. The IC area serves business demand from expressway users while the station area serves rail-access demand; this difference in customer channels within the same city is important for gauging the degree of competition with existing properties.
Higashi-Mikawa as a Whole — Gamagori, Tahara and Shinshiro Follow Different Demand Curves
Higashi-Mikawa cannot be described by its two core cities alone. Gamagori on Mikawa Bay, Tahara on the Atsumi Peninsula, and Shinshiro in Oku-Mikawa have rate and absorption profiles that look entirely different from Toyohashi and Toyokawa.
Gamagori has the highest median ADR in Higashi-Mikawa at about ¥15,300 and also the earliest median early sell-out LT at 16.0 days. With 10 hot-spring ryokan in its mix, several properties sell out more than two weeks before the stay date. Tahara’s median ADR is mid-range at about ¥8,000, yet its median early sell-out LT is 8.7 days; Shinshiro’s median ADR is about ¥13,800 with 5.5 days. Both sell out earlier than Toyohashi (3.3 days) and Toyokawa (1.9 days).
In other words, demand in Higashi-Mikawa has a two-tier structure. In the three leisure-driven cities, bookings come in early even at high prices. In the two business-driven cities, the higher the price, the later the bookings arrive. Even under the same “Higashi-Mikawa hotel” label, the approach to pricing and lead-time management is entirely different. Because all 327 new rooms go into the two business-driven cities, they are unlikely to directly affect supply and demand in the three leisure cities. Nishi-Mikawa (West Mikawa), elsewhere in Aichi Prefecture, has a different price structure again, with its own whitespace band and breakeven lines.
Summary
In November 2026, 327 rooms will be added to Higashi-Mikawa’s two core cities. That is +6.0% against the existing 5,439 rooms confirmed active on OTAs, +9.2% for Toyohashi alone and +14.4% for Toyokawa alone.
Demand-side pricing is diverging. Toyohashi’s estimated settled ADR is +6.7% YoY, in line with rising official land prices. Toyokawa’s is −5.7% YoY, with commercial land prices flat for three years. Even within the same market area, the drivers of rates are not the same.
Stratified by price band, 40–50% of supply in both cities sits in the ¥6,000–8,000 band, and the 327 new rooms are likely to land there too. Demand in this band is confirmed, but after the openings it will account for 45–53% of supply, so factors other than price (large baths, extended-stay amenities, range of room types) will decide competition.
From an absorption standpoint, demand fills from the lower price bands up. The under-¥6,000 band sells out about 13 days before the stay date, while the band above ¥8,000 remains available until the day before. The gap did not disappear even after controlling for size. The thinness of the upper bands reflects demand structure rather than room for supply, and the more reasonable reading is that the revenue opportunity lies less in adding new rooms than in lead-time-based pricing of existing stock.
Note on rates for future dates: The estimated settled ADR in this article covers only settled months through August 2026. Months from September 2026 onward are provisional values estimated from rates listed on OTAs and elsewhere at the time of research, which change as check-in approaches, so they are excluded from this article’s analysis and charts. The price bands of the two new properties are also estimates based on comparable existing properties and may differ from their actual selling prices.
Related Reading
References & Sources
■ Data sources
Estimated settled ADR is an estimate (tax-excluded equivalent) calculated by applying segment-specific adjustment factors to the lowest-plan rate each property publishes on OTAs and elsewhere (per room, 2 guests, tax included). City-level values use the median of the covered properties. The denominator is the 77 properties and 5,439 rooms in the five Higashi-Mikawa cities for which estimated settled ADR could be calculated continuously over the most recent 12 months (September 2025–August 2026). Inventory absorption (early sell-out lead time and remaining-room ratio of OTA-published inventory) covers the 14 check-in dates from August 31 to September 13, 2026, and remaining-room curves by price band cover four stay dates: September 2, 3, 9 and 10, 2026. Land prices, zoning and station ridership are from the MLIT Real Estate Information Library; room counts, opening dates and facility details of the two new properties are from the companies’ announcements.
■ Calculation assumptions
Supply impact is calculated by simply adding the two new properties’ room counts to each city’s existing room count. Because the estimated settled ADR of the two new properties is not yet established, the landing-band scenarios set side by side the change in composition if they land in the under-¥6,000, ¥6,000–7,999 or ¥8,000–9,999 band. The assumed ADR × lead-time sensitivity applies the median published-inventory absorption rate observed for each price band (below ¥8,000: 25.1% at LT30 and 36.7% at LT14; ¥8,000 and above: 9.6% and 18.6%) uniformly to each assumed ADR, converted into cumulative room revenue per 100 rooms of published inventory as a reference value. Checked against property-level results disclosed by listed hotel REITs (91 properties, most recent 3 months), the median error of estimated settled ADR is about 7%.
■ Limitations
Estimated settled ADR is an estimate and differs from each property’s actual settled prices and accounting figures. Ryokan, minshuku and simple lodgings not listed on OTAs are not included in the denominator. Early sell-out lead time is tallied only for properties whose OTA-published inventory is at least 30% of total rooms; because smaller properties with small published inventories tend to reach zero remaining rooms sooner, compositional differences should be kept in mind when comparing cities. The sensitivity calculation is intended as a relative comparison per 100 rooms of published inventory and does not consider individual properties’ room counts, sales-channel mix, fixed costs or seasonality. Estimated settled ADR is limited to settled months through August 2026; provisional values from September 2026 onward are excluded from the analysis and charts. The price bands of the two new properties are estimates based on comparable existing properties and may differ from their actual selling prices.
■ Market data
- MetroEngines Research & Consulting — Estimated settled ADR (five Higashi-Mikawa cities, 77 properties), OTA remaining-inventory curves and early sell-out lead time (check-ins August 31–September 13, 2026), new-opening data (based on confirmed OTA listings)
■ Government statistics and public data
- MLIT Real Estate Information Library (国土交通省 不動産情報ライブラリ) — Official land prices (2023–2025), city planning GIS (zoning), station ridership (National Land Numerical Information)
■ Corporate press releases
- Toyoko Inn Co., Ltd., “New hotel Toyoko Inn Toyohashi-eki-mae Odori opens for reservations on September 15” (September 15, 2026; Japanese)
- Sun Frontier Fudousan Co., Ltd., “Tabino Hotel lit Toyokawa opens for reservations on Friday, May 15” (May 13, 2026; Japanese)
- Tabino Hotel lit Toyokawa official website (scheduled to open November 15, 2026; Japanese)