

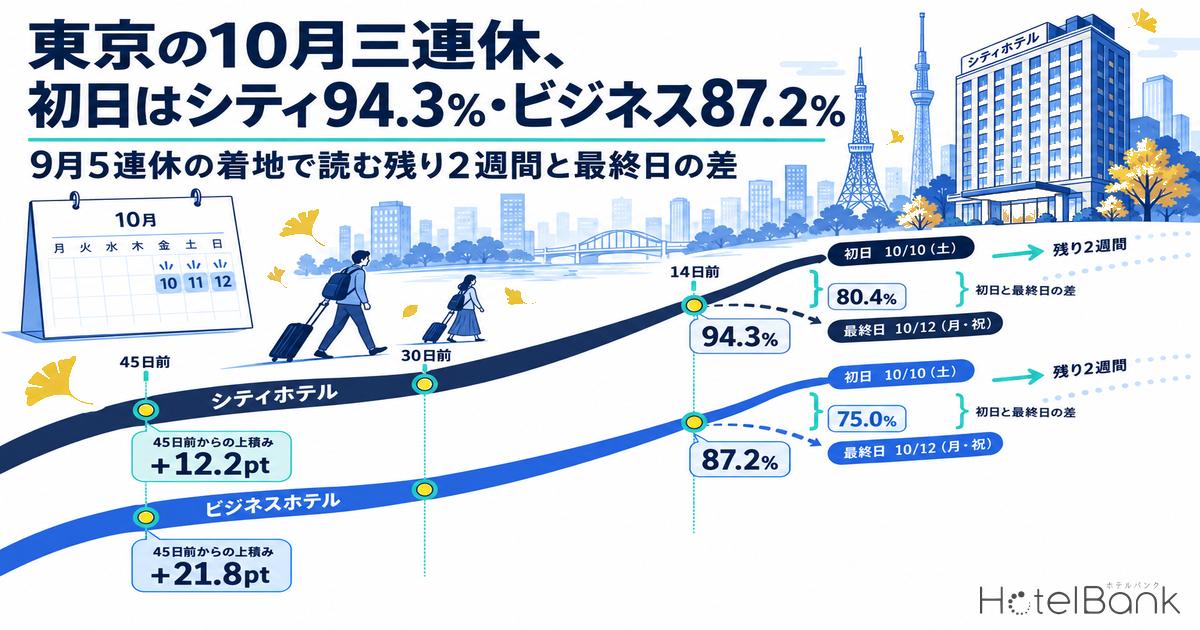
For Tokyo’s October three-day weekend (October 10–12, 2026), with a little over two weeks to go, estimated OCC (based on OTA-listed inventory) for the first night, 10/10, has already reached 94.3% for city hotels (N=54 properties) and 87.2% for business hotels (N=561 properties). The gain since 45 days out differs sharply by hotel type: +12.2pt for city hotels versus +21.8pt for business hotels. The last night of the holiday, 10/12, however, stood at only 80.4% (city) and 75.0% (business) 16 days out, leaving a gap to the first night of 13.0pt (city) and 11.2pt (business). Using the final pickup of the most recent holiday period — the five-day September holiday (September 19–23, 2026) — as an “answer key,” the last night grew far more than the first night over the final two weeks, and the gap to the first night narrowed. This article compares how bookings built up by hotel type at three points (45 days out, 30 days out, and the latest observation) and sets out the inventory and pricing decisions for the remaining two weeks.
Scope: Tokyo city hotels N=54 properties (16,495 rooms in total) and business hotels N=561–562 properties (80,793–80,843 rooms in total), all based on listings on major booking sites. The price metric in this article is the estimated settled ADR (the transacted price level estimated from OTA and other sales data, tax-exclusive equivalent); occupancy is an estimate based on OTA-listed inventory. Definitions of both are at the end of the article. Data as of September 27, 2026.
- — Fourteen days out (as of September 26, 2026), estimated occupancy for the first night, 10/10, was 94.3% for city hotels (N=54 properties) and 87.2% for business hotels (N=561 properties). The gain since 45 days out was +12.2pt for city and +21.8pt for business — roughly a 1.8x difference.
- — On 9/19, the first night of the September five-day holiday, city hotels gained only +3.2pt from 14 days out to the day before. City hotels on 10/10 are already above where 9/19 stood at the same point (92.7%) — this is the phase to prioritize rate over volume.
- — Business hotels on 10/10 were at 87.2% 14 days out, almost the same pace as 9/19 at the same point (87.3%). Since 9/19 grew +9.2pt over its final two weeks, early price cuts are best avoided.
- — The last night, 10/12, was at 80.4% (city) and 75.0% (business) 16 days out, a gap to the first night of 13.0pt and 11.2pt. The sold-out property rate was 0.0% for city and 2.1% for business, so most inventory remains unsold.
- — 9/23 (the last day of the holiday) grew +9.7pt for city and +14.1pt for business over the final two weeks, and its gap to the first night narrowed to 15.5pt by the day before. Assuming the 10/12 gap will also narrow late in the window, the core decision is to hold off on deep early discounts.
Where the October Three-Day Weekend Stands: First and Last Nights Diverge
First, we line up estimated OCC (based on OTA-listed inventory) for the three target nights at three points: 45 days out, 30 days out, and the latest observation. The panel covers 54 city hotels (16,495 rooms) and 561 business hotels (80,793 rooms; 562 properties and 80,843 rooms for 10/12 only), tracking the same set of properties for each stay date. The latest observation falls 14–16 days before the stay date (as of September 26, 2026).
| Type | Stay date | N | 45 days out | 30 days out | Latest observation | Gain since 45 days out | Sold-out property rate (latest) |
|---|---|---|---|---|---|---|
| City | 10/10 (Sat) | 54 properties / 16,495 rooms | 82.1% | 87.6% | 94.3% (14 days out) | +12.2pt | 42.6% |
| City | 10/11 (Sun) | 54 properties / 16,495 rooms | 79.9% | 84.7% | 88.9% (15 days out) | +9.0pt | 11.1% |
| City | 10/12 (Mon, holiday) | 54 properties / 16,495 rooms | 71.0% | 76.5% | 80.4% (16 days out) | +9.4pt | 0.0% |
| Business | 10/10 (Sat) | 561 properties / 80,793 rooms | 65.4% | 76.1% | 87.2% (14 days out) | +21.8pt | 36.7% |
| Business | 10/11 (Sun) | 561 properties / 80,793 rooms | 63.1% | 72.8% | 82.5% (15 days out) | +19.4pt | 14.1% |
| Business | 10/12 (Mon, holiday) | 562 properties / 80,843 rooms | 58.1% | 67.0% | 75.0% (16 days out) | +16.9pt | 2.1% |
Source: Compiled by the HotelBank Editorial Team from MetroEngines Research data
On the first night, 10/10 (Sat), city hotels rose from 82.1% at 45 days out to 94.3%, and business hotels from 65.4% to 87.2%. Because city hotels started from a higher base, their gain was limited to +12.2pt, while business hotels, starting lower, gained +21.8pt — absorbing inventory at roughly 1.8 times the pace. The sold-out property rate (the estimated share of properties with no listed inventory visible on OTAs and other channels) reached 42.6% for city and 36.7% for business on 10/10. Estimated OCC and the sold-out property rate answer different questions: the former measures how much of the market’s listed inventory has been absorbed, while the latter shows how many properties have already closed out entirely.
By contrast, the last night of the holiday, 10/12 (Mon, holiday), started low at 71.0% (city) and 58.1% (business) 45 days out and was still only at 80.4% and 75.0% 16 days out. Its sold-out property rate was 0.0% for city and 2.1% for business, meaning almost every property still has inventory. The middle night, 10/11 (Sun), sits between the two at 88.9% (city) and 82.5% (business), both 15 days out.
Source: Compiled by the HotelBank Editorial Team from MetroEngines Research data
In the chart, the two business-hotel lines (first and last night) rise almost in parallel, and their slope has not flattened after 30 days out. The city-hotel first night crossed 90% at 90.6% 25 days out and is entering the final stretch with little inventory left. The gap between the first and last nights widened from 11.1pt (city) and 7.3pt (business) at 45 days out to 13.0pt (93.4% vs. 80.4%) and 11.2pt (86.2% vs. 75.0%) at 16 days out, because the first night is filling faster than the last. This pattern — business hotels building right up to the stay date while city hotels approach their ceiling early — is a recurring shape in Tokyo’s booking curves by hotel type.
What the September Five-Day Holiday Says About Pickup in the Final Two Weeks
The October three-day weekend has not yet arrived, so its final result is unknown. We therefore check how much the most recent major holiday — the five-day September holiday (September 19–23, 2026) — picked up between 14 days out and the day before each stay date. The panel is again Tokyo, with 52–54 city hotels and 550–554 business hotels. For reference, we also include an ordinary Saturday after the holiday, 9/26 (54 city and 560 business properties).
Source: Compiled by the HotelBank Editorial Team from MetroEngines Research data
| Type | Stay date | N | 14 days out | 7 days out | 3 days out | Day before | 14 days out → day before |
|---|---|---|---|---|---|---|
| City | 9/19 (Sat) | 54 properties | 92.7% | 93.6% | 94.2% | 95.9% | +3.2pt |
| City | 9/20 (Sun) | 53 properties | 90.3% | 92.7% | 93.9% | 96.5% | +6.2pt |
| City | 9/21 (Mon, holiday) | 53 properties | 87.3% | 90.0% | 91.8% | 95.5% | +8.2pt |
| City | 9/22 (Tue, bridge holiday) | 52 properties | 81.9% | 86.1% | 87.8% | 93.0% | +11.1pt |
| City | 9/23 (Wed, holiday) | 54 properties | 70.7% | 73.2% | 74.9% | 80.4% | +9.7pt |
| City | 9/26 (Sat) | 54 properties | 89.8% | 90.2% | 90.6% | 93.0% | +3.2pt |
| Business | 9/19 (Sat) | 550 properties | 87.3% | 90.5% | 93.6% | 96.5% | +9.2pt |
| Business | 9/20 (Sun) | 553 properties | 88.6% | 92.9% | 95.7% | 98.0% | +9.4pt |
| Business | 9/21 (Mon, holiday) | 552 properties | 81.5% | 86.7% | 90.8% | 94.5% | +13.0pt |
| Business | 9/22 (Tue, bridge holiday) | 554 properties | 79.2% | 83.3% | 88.3% | 92.9% | +13.7pt |
| Business | 9/23 (Wed, holiday) | 554 properties | 66.9% | 71.2% | 76.1% | 81.0% | +14.1pt |
| Business | 9/26 (Sat) | 560 properties | 74.7% | 78.5% | 82.8% | 88.3% | +13.6pt |
Source: Compiled by the HotelBank Editorial Team from MetroEngines Research data
Three points stand out.
1. For city hotels, the first night was already near its ceiling 14 days out. City hotels on 9/19 (Sat) stood at 92.7% 14 days out, then 93.6% at 7 days out and 94.2% at 3 days out — a gain of only +3.2pt by the day before. The ordinary Saturday 9/26 followed the same shape: 89.8% at 14 days out to 93.0% the day before (+3.2pt). City hotels on 10/10 were already at 94.3% 14 days out, above where 9/19 stood at the same point (92.7%).
2. Business hotels kept growing into the final week. Business hotels on 9/19 went from 87.3% at 14 days out to 90.5% at 7 days out, 93.6% at 3 days out and 96.5% the day before — roughly 3pt in each interval, +9.2pt in total. Business hotels on 10/10 stood at 87.2% 14 days out, almost identical to 9/19 at the same point (87.3%). They also overlapped closely at 45 days out (65.4% vs. 66.9%) and 30 days out (76.1% vs. 75.4%), so 10/10 is tracking almost exactly the pace of the first night of the September holiday.
3. The last day of the holiday saw the largest pickup in the final two weeks. 9/23 (Wed, holiday) gained +9.7pt for city and +14.1pt for business — for business hotels, the largest gain of any night in the holiday. Its gap to the first night was 21.8pt (city) and 20.2pt (business) at 16 days out, but by the day before both had narrowed to 15.5pt.
Source: Compiled by the HotelBank Editorial Team from MetroEngines Research data
Note, however, that September was a five-day holiday and October is a three-day weekend. Both are followed by a weekday after the last night, but the length of the holiday and the sequence of weekdays differ. The September results are best used as a reference for “how much can move in the final two weeks,” not as a forecast of where October will land. For a view of how Tokyo’s pickup looked for ordinary dates earlier in September, see our Tokyo early-September booking curves at T-45/T-30/T-14.
Supplementary Metric: Estimated Settled ADR for October
This article centers on estimated OCC, but as a reference point for pricing decisions we also check Tokyo’s estimated settled ADR for October (monthly).
| Type | October 2025 (final) | October 2026 (current estimate) |
|---|---|---|
| City hotels | ¥31,970 (N=106) | ¥33,327 (N=107) |
| Business hotels | ¥15,348 (N=897) | ¥18,813 (N=897) |
Source: Compiled by the HotelBank Editorial Team from MetroEngines Research data
The October 2026 figures are estimates based on current sales and may change. A straight comparison with last year’s final figures will wait until the month closes. Because estimated settled ADR is a monthly metric, we do not use it to compare daily prices across the three-day weekend.
For Revenue Managers at Tokyo City and Business Hotels — Implications and Action Plan
Operator Insights
1. For city hotels, the first night is at the “choose your rate” stage rather than the “sell out” stage. City hotels on 10/10 are at 94.3% estimated OCC (as of September 26, 2026, 14 days out, N=54 properties) with a sold-out property rate of 42.6%. City hotels on the first night of the September holiday gained only +3.2pt from 14 days out to the day before, which suggests this is a phase for choosing rate rather than adding room nights. The same logic applies to any hotel type that is already near its ceiling 45 days out. When closing inventory early near the ceiling, steering the remaining rooms to higher room categories or plans with a multi-night condition is usually easier to justify than simply stopping sales.
2. For business hotels, plan on demand continuing into the final week for the first night. Business hotels on 10/10 are tracking almost the same pace as 9/19, which gained +9.2pt over its final two weeks. In other words, “87% at 14 days out is enough” does not hold. Rather than cutting prices at the last minute to clear inventory, there is room to keep settings that capture final-week demand.
3. Assume the last-night gap will “narrow at the end” rather than trying to “stop it widening.” For now, 10/12’s gap to the first night is widening, but 9/23 grew strongly over its final two weeks (+9.7pt city, +14.1pt business). Cutting prices deeply and early based only on today’s gap risks selling late-window demand too cheaply.
4. The market curve is a yardstick for your own booking pace. The figures in this article are market figures tracking a fixed set of properties. Placing your own bookings for the same date at the same lead time alongside them shows whether you are ahead of or behind the market.
Action Plan (Through the October Three-Day Weekend)
| Timing | Action | Decision trigger (figures from this article) | Goal |
|---|---|---|---|
| This week | Review how remaining 10/10 inventory is allocated | If your 10/10 is close to or above the city-hotel market’s 94.3% | Steer remaining rooms to higher categories or multi-night conditions to protect rate |
| This week | Consider holding off on early discounts for 10/12 | If your 10/12 pace is similar to the market (city 80.4%, business 75.0%) | Capture a late surge like 9/23’s (+9.7 to +14.1pt) at regular rates |
| Up to 7 days out | Do not lower business-hotel rates for the first and middle nights | If your business-hotel 10/10 is on track to reach 9/19’s 7-days-out level (90.5%) | Capture final-week demand (9/19 gained +9.2pt) |
| Up to 7 days out | Prepare a 10/11→10/12 plan with a multi-night condition | If your gap between 10/12 and the first night is larger than the market level at 16 days out (city 13.0pt, business 11.2pt) | Fill last-night vacancies with stays extending from the middle night |
| 3 days out to day before | Adjust remaining last-night inventory by one step only | If, even 3 days out, your 10/12 is below 9/23’s 3-days-out level (city 74.9%, business 76.1%) | Keep any price cut small, in line with the final day-before surge (9/23: city +5.5pt, business +4.9pt) |
| After the holiday | Check October estimated settled ADR against final figures | Once the current October 2026 estimates (city ¥33,327, business ¥18,813) are finalized | Update your benchmark for when to revisit pricing ahead of the next major holiday |
All of these actions are meant to be weighed against your own hotel’s situation; none of them guarantees a result.
Summary: Three Yardsticks for Three-Day Weekend Inventory Decisions
1. How close to the ceiling. For nights already above the low 90s% 14 days out (city hotels on 10/10 at 94.3%), September’s results (+3.2pt) show that pickup in the final two weeks is small. Decisions should center on choosing rate rather than adding volume.
2. Whether the slope continues. The business-hotel first night is tracking the same pace as the September five-day holiday (87.2% vs. 87.3% at 14 days out). The baseline is not to cut prices early, on the assumption that growth continues through the final two weeks (9/19 gained +9.2pt).
3. The last-night gap narrows at the end. The gap between the last and first nights widened for most of the window and then narrowed late (in September: city 21.8pt → 15.5pt, business 20.2pt → 15.5pt). The 10/12 gap (city 13.0pt, business 11.2pt at 16 days out) should be viewed as having room to narrow over the remaining two weeks.
Frequently Asked Questions
Q. Is estimated OCC (OTA-listed inventory basis) the same as actual room occupancy?
A. No. It is estimated from how inventory listed on OTAs and other channels is being absorbed, and rooms not listed on OTAs are counted as already absorbed, so it reads higher than actual room occupancy. When comparing with your own hotel, it is better to compare the pace of progress at 45 days out, 30 days out and the latest point than the absolute level.
Q. Can the September five-day holiday results predict where the October three-day weekend will land?
A. We do not use them as a forecast, because the length of the holiday and the sequence of weekdays differ. They serve as a reference for how much can move in the final two weeks.
Q. Which night of the October three-day weekend has the most inventory left?
A. The last night, 10/12 (Mon, holiday). At 16 days out (as of September 26, 2026), it stood at 80.4% for city hotels and 75.0% for business hotels, with sold-out property rates of 0.0% and 2.1%, so almost every property still has inventory. That said, 9/23, the last day of the September five-day holiday, grew +9.7pt (city) and +14.1pt (business) over its final two weeks.
Q. How should city and business hotels think differently about the final two weeks?
A. The city-hotel first night is near its ceiling at 94.3% 14 days out, and 9/19 gained only +3.2pt from 14 days out to the day before, so this is the stage to choose rate over volume. The business-hotel first night is tracking almost the same pace as 9/19, which gained +9.2pt over its final two weeks, so plan on demand continuing into the final week.
Q. How should estimated settled ADR be used for three-day weekend pricing decisions?
A. Estimated settled ADR is a monthly metric. The current estimate for October 2026 is ¥33,327 for city hotels (N=107) and ¥18,813 for business hotels (N=897); it is not used to compare daily prices across the three-day weekend. After the holiday, check it against the final figures and use it as a benchmark for revisiting prices ahead of the next major holiday.
About the Data in This Article
- Definition of estimated OCC (OTA-listed inventory basis): OTA-listed-inventory occupancy = 100 − 100 × OTA-listed remaining rooms ÷ total rooms. The panel is a fixed cohort (the same set of properties for each stay date) made up of properties that list at least 30% of their total rooms on OTAs. It is an estimate based on how inventory sold through OTAs is being absorbed, and it is defined differently from actual room occupancy (rooms not listed are counted as absorbed, so it reads higher).
- Booking curves: based on observations from 45 days before the stay date to the latest available.
- Estimated settled ADR: the transacted price level (tax-exclusive equivalent) estimated from OTA and other sales data (lowest-plan level × type-specific coefficients, ensembled across multiple channels). Past months are final values; current and future months are estimates based on sales to date. Median error against published operating results is 6.6%.
- Sample N: estimated OCC covers 52–54 city hotels (16,339–17,294 rooms) and 550–562 business hotels (79,726–80,843 rooms) in Tokyo. Property and room counts for each stay date are as shown in the tables, all based on listings on major booking sites. Estimated settled ADR covers 106–107 city hotels and 897 business hotels. Capsule hotels were excluded from the estimated OCC in this article because fewer than 10 properties met the fixed-cohort criteria above.
- Sold-out property rate: the estimated share of properties with no listed inventory visible on OTAs and other channels.
- Data as of: September 27, 2026. Sales and inventory change daily, so the figures in this article are a snapshot at the time of retrieval.
■ Data Sources
Listed-inventory and selling-price data from OTAs and other channels collected by MetroEngines Research. Estimated occupancy uses a fixed cohort of 52–54 city hotels and 550–562 business hotels in Tokyo; estimated settled ADR is a monthly aggregate of 106–107 city hotels and 897 business hotels. Data as of September 27, 2026.
■ Calculation Assumptions
Estimated occupancy = “100 − 100 × OTA-listed remaining rooms ÷ total rooms” (queried for two adults), tracking the same set of properties for each stay date. The October three-day weekend is compared at three points (45 days out, 30 days out, and latest at 14–16 days out); the September five-day holiday and 9/26 are compared at four points (14 days out, 7 days out, 3 days out and the day before). The September results are reference values for the range of movement possible in the final two weeks and are not used to forecast where October will land.
■ Limitations and Caveats
Rooms not listed on OTAs and other channels are counted as absorbed, so figures read higher than actual room occupancy. The number of properties covered varies by a few properties from one stay date to another. The October 2026 estimated settled ADR is a mid-sales estimate and will change. Differences in individual properties’ plan mix, sales channels and group demand are not reflected.