

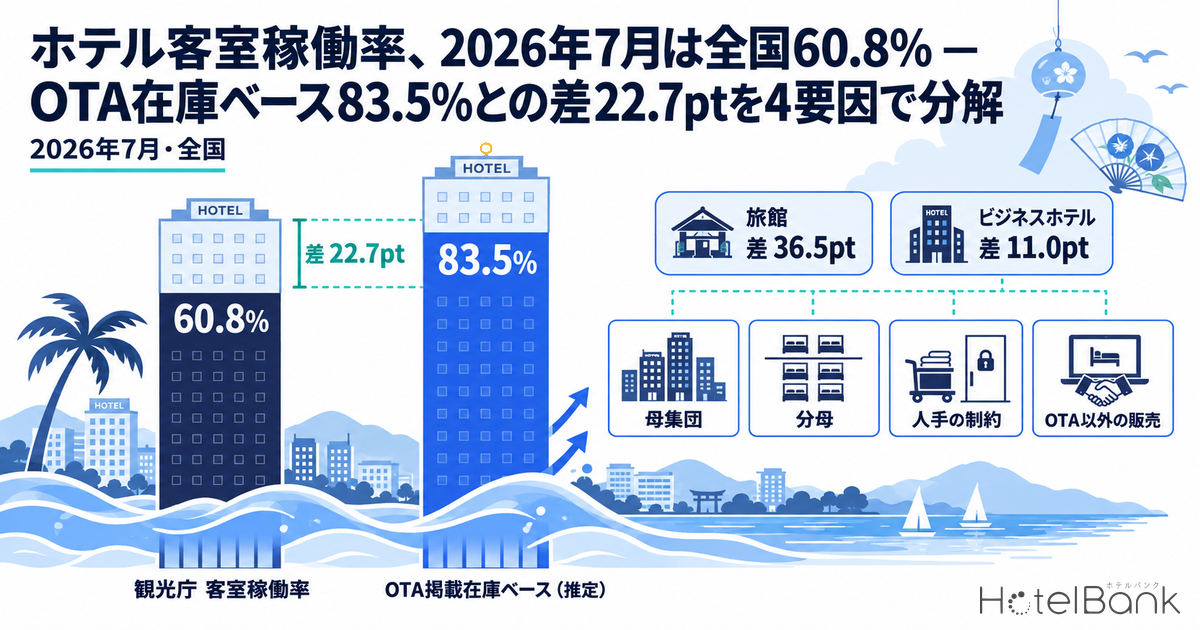
Hotel room occupancy in Japan was 60.8% nationwide in July 2026 (Japan Tourism Agency, Overnight Travel Statistics Survey, first preliminary release). Estimating the same month from how quickly inventory listed on OTAs and other booking sites was absorbed, MetroEngines Research arrives at 83.5% nationwide. The gap is 22.7 points, yet neither figure is wrong: they count differently and answer different questions. This article breaks the gap into four factors — the population of properties, the denominator, rooms held back from sale because of staffing constraints, and non-OTA sales — and sets out which number to use for budgeting and which for day-to-day inventory decisions.
Metric Definitions Used in This Article
- Room occupancy rate (Japan Tourism Agency): The published figure from the Japan Tourism Agency’s Overnight Travel Statistics Survey. Rooms occupied divided by the property’s room count, covering every property type: ryokan, resort hotels, business hotels, city hotels, simple lodgings (簡易宿所) and company/group lodging facilities. The July 2026 figures are first preliminary values.
- OCC (occupancy rate): Rooms sold as a share of total rooms in the area (an estimate based on OTA sales inventory). This article labels it “occupancy rate (OTA listed-inventory basis, estimated)”. The formula is 100 − 100 × OTA-listed rooms remaining ÷ total rooms, so rooms not listed on OTAs are counted on the sold side. Because it is an estimate based on how OTA inventory is absorbed, it differs from a property’s actual occupancy and runs higher than actual occupancy.
- Coverage: A fixed set of properties that list at least 30% of their total rooms on OTAs and similar channels (the same properties for every stay date). Property and room counts are shown alongside each table and chart.
- Data sources: MetroEngines Research; Japan Tourism Agency, Overnight Travel Statistics Survey
- — 60.8% vs 83.5%: July 2026 room occupancy was 60.8% nationwide per the Japan Tourism Agency (first preliminary release) and 83.5% on the OTA listed-inventory estimate (11,938 properties). The gap is 22.7 points.
- — The gap varies by segment: +11.0 points for business hotels, +36.5 points for ryokan. Matching segments does not make the gap disappear.
- — Four factors: the population of properties; a numerator that treats unlisted rooms as absorbed; rooms held back to match staffing; and unsold non-OTA allocations.
- — Regional gaps of +12.3 to +46.2 points: In the June 2026 comparison across all 47 prefectures, the lower a prefecture’s official figure, the wider the gap (correlation coefficient −0.8).
- — Which to use when: Use the Japan Tourism Agency figures for occupancy assumptions in budgets and investment cases, and relative changes in the OTA listed-inventory measure for day-to-day inventory decisions.
July 2026 Room Occupancy — The Japan Tourism Agency’s Published Figures
On August 31, 2026, the Japan Tourism Agency released the July 2026 Overnight Travel Statistics Survey (first preliminary release). Room occupancy across all properties was 60.8%, down 0.4 points year on year and up 3.6 points from the previous month (June, second preliminary release: 57.2%). Total guest nights were 54.67 million (−3.5% YoY), of which foreign guests accounted for 13.58 million (−4.6% YoY).
By property type, business hotels were highest at 74.2%, followed by city hotels at 71.9%. Resort hotels were at 59.6%, ryokan 40.6%, simple lodgings 30.9% and company/group lodging facilities 32.7%. Prefecture-level figures are not included in the first preliminary release; they will appear in the second preliminary release scheduled for September 30. In the most recent June data (second preliminary release), Tokyo was the highest in the country at 75.4%, and Fukuoka was 70.3%. The Japan Tourism Agency notes that from January 2026 it changed the stratification criterion in its sample design from number of employees to number of rooms, so year-on-year comparisons may include effects of that revision.
| Property type | Room occupancy (July 2026) | Rooms occupied |
|---|---|---|
| All properties | 60.8% | 31,930,050 rooms |
| Business hotels | 74.2% | 16,640,130 rooms |
| City hotels | 71.9% | 4,852,300 rooms |
| Resort hotels | 59.6% | 3,192,420 rooms |
| Ryokan | 40.6% | 3,281,170 rooms |
| Company/group lodging facilities | 32.7% | 288,220 rooms |
| Simple lodgings | 30.9% | 1,311,890 rooms |
Source: Japan Tourism Agency, Overnight Travel Statistics Survey, July 2026, first preliminary release (results tables 3 and 5). The all-properties total for rooms occupied includes properties of unknown type.
The Same July, the OTA Listed-Inventory Occupancy Rate Was 83.5%
Looking at the same July 2026 through MetroEngines Research’s occupancy rate (OTA listed-inventory basis, estimated), the national figure (daily remaining rooms summed across all 47 prefectures) was 83.5%. Coverage was 11,938 properties / 761,558 rooms (based on listings on major booking sites). By segment: business hotels 85.2% (3,719 properties / 448,539 rooms), city hotels 84.9% (421 properties / 77,004 rooms), resort hotels 81.9% (857 properties / 69,131 rooms) and ryokan 77.1% (3,300 properties / 93,823 rooms).
Set against the Japan Tourism Agency’s figures, the gap is 11.0 points for business hotels, 13.0 points for city hotels, 22.3 points for resort hotels and 36.5 points for ryokan, and 22.7 points overall. That the size of the gap differs so much by segment is the key to the breakdown that follows.
Source: Japan Tourism Agency, Overnight Travel Statistics Survey, July 2026, first preliminary release / compiled by the HotelBank Editorial Team from MetroEngines Research (11,938 properties / 761,558 rooms nationwide; based on listings on major booking sites; estimated)
The pattern holds by area as well. Because prefecture-level Japan Tourism Agency figures for July have not been released, comparing like-for-like months using June (second preliminary release): Tokyo was 75.4% per the Japan Tourism Agency versus 90.5% on the OTA listed-inventory basis (780 properties / 103,314 rooms), a gap of 15.1 points. Fukuoka was 70.3% versus 87.8% (381 properties / 28,992 rooms), a gap of 17.5 points. For July, the OTA listed-inventory figures were 91.1% for Tokyo (804 properties / 104,099 rooms) and 88.4% for Fukuoka (380 properties / 28,979 rooms).
| Segment (July 2026) | Japan Tourism Agency room occupancy | OTA listed-inventory basis (est.) | Gap | Estimate coverage |
|---|---|---|---|---|
| National, all properties | 60.8% | 83.5% | +22.7pt | 11,938 properties / 761,558 rooms |
| National, business hotels | 74.2% | 85.2% | +11.0pt | 3,719 properties / 448,539 rooms |
| National, city hotels | 71.9% | 84.9% | +13.0pt | 421 properties / 77,004 rooms |
| National, resort hotels | 59.6% | 81.9% | +22.3pt | 857 properties / 69,131 rooms |
| National, ryokan | 40.6% | 77.1% | +36.5pt | 3,300 properties / 93,823 rooms |
| Tokyo, all properties (June 2026) | 75.4% | 90.5% | +15.1pt | 780 properties / 103,314 rooms |
| Fukuoka, all properties (June 2026) | 70.3% | 87.8% | +17.5pt | 381 properties / 28,992 rooms |
Source: Japan Tourism Agency, Overnight Travel Statistics Survey, July 2026, first preliminary release / compiled by the HotelBank Editorial Team from MetroEngines Research (OTA listed-inventory basis, estimated; based on listings on major booking sites. The national figure is our aggregation of daily remaining rooms across the 47 prefectures. Because prefecture-level Japan Tourism Agency figures for July have not been released, Tokyo and Fukuoka are compared using the June 2026 second preliminary release and the June OTA listed-inventory figures.)
Across All 47 Prefectures — The Lower the Official Figure, the Wider the Gap (June 2026)
Tokyo and Fukuoka alone cannot show how the size of the gap varies by region. We therefore compared all 47 prefectures like-for-like for June 2026 (second preliminary release), the latest month with prefecture-level Japan Tourism Agency figures. Nationally, the OTA listed-inventory basis was 81.2% (12,041 properties / 762,484 rooms) against 57.2% per the Japan Tourism Agency, a gap of 24.0 points. By prefecture, the gap ranged from +12.3 points in Osaka (the smallest) to +46.2 points in Nagano (the largest), with a median of +26.3 points.
What stands out is that the lower a prefecture’s Japan Tourism Agency figure, the wider the gap. The correlation coefficient between Japan Tourism Agency occupancy and the gap is −0.8. Japan Tourism Agency figures span 40.7 points, from 34.7% (Nagano) to 75.4% (Tokyo), while the OTA listed-inventory basis fits within 27.5 points, from 63.0% (Kagoshima) to 90.5% (Tokyo). Because the OTA listed-inventory measure counts unlisted rooms and rooms held back from sale as “absorbed”, it lifts the level most in regions with low actual occupancy and makes regional differences look smaller. When comparing regions, use this measure for rankings and direction of change, not for reading level differences at face value.
| Prefecture | Japan Tourism Agency room occupancy | OTA listed-inventory basis (est.) | Gap | Estimate coverage |
|---|---|---|---|---|
| Osaka | 65.3% | 77.6% | +12.3pt | 405 properties / 59,272 rooms |
| Toyama | 57.2% | 71.8% | +14.6pt | 101 properties / 7,299 rooms |
| Tokyo | 75.4% | 90.5% | +15.1pt | 780 properties / 103,314 rooms |
| Kanagawa | 64.4% | 80.2% | +15.8pt | 390 properties / 30,735 rooms |
| Fukuoka | 70.3% | 87.8% | +17.5pt | 381 properties / 28,992 rooms |
| (… omitted; median gap +26.3pt) | ||||
| Nagano | 34.7% | 80.9% | +46.2pt | 502 properties / 18,467 rooms |
| Niigata | 42.5% | 82.9% | +40.4pt | 231 properties / 10,755 rooms |
| Yamanashi | 37.1% | 74.3% | +37.2pt | 260 properties / 8,692 rooms |
| Fukui | 47.0% | 79.3% | +32.3pt | 135 properties / 4,902 rooms |
| Fukushima | 50.8% | 83.0% | +32.2pt | 217 properties / 11,521 rooms |
Source: Japan Tourism Agency, Overnight Travel Statistics Survey, June 2026, second preliminary release (room occupancy by prefecture and property type) / compiled by the HotelBank Editorial Team from MetroEngines Research (OTA listed-inventory basis, estimated; based on listings on major booking sites; June 2026)
Factor 1: Different Populations — The Statistics Cover All Properties, the Estimate Covers OTA-Listed Properties
The first difference is the set of properties being counted in the first place. The Japan Tourism Agency survey grosses up its sample to the population of lodging facilities as of January 1, 2026, and so includes ryokan, simple lodgings and company/group lodging facilities that list little or nothing on OTAs. Working back from the published July figures (rooms occupied ÷ room occupancy ÷ 31 days; our estimate), the statistics cover roughly 1.69 million rooms per day. Of the rooms whose property type is known, ryokan account for about 16.9%, simple lodgings about 8.9% and company/group lodging facilities about 1.8%. These three types, with occupancy in the 30–41% range, pull the overall figure down to 60.8%.
The OTA listed-inventory estimate, by contrast, is limited to properties that list at least 30% of their total rooms on OTAs and similar channels. The properties meeting that condition and included in the July aggregation came to 11,938 properties / 761,558 rooms nationwide and 804 properties / 104,099 rooms in Tokyo. Properties that rely heavily on OTAs are more likely to be included, while popular properties that can fill up without OTAs — and, at the other end, small properties that barely use OTAs for sales — are less likely to be.
The difference in population cannot, however, explain the whole gap. As the table in the previous section shows, a gap of 11.0 points remains even between business hotels, and 36.5 points between ryokan. Since the gap persists after matching the segment mix, the difference in the “denominator” examined next is likely to have a larger effect.
Factor 2: Different Denominators — Total Rooms Versus Rooms Listed on OTAs
The Japan Tourism Agency’s room occupancy divides “rooms actually occupied” by “the property’s room count”. The OTA listed-inventory estimate divides “total rooms minus rooms remaining on OTAs” by total rooms. Both denominators are total rooms, but the numerators mean different things. The estimate treats every room not remaining on OTAs as “absorbed”. The numerator therefore includes not only rooms actually sold, but also rooms never listed on OTAs and rooms whose listings were withdrawn along the way.
A numerical example makes this concrete. The following is a hypothetical illustration, not the results of any specific property. Suppose a 100-room hotel, for a given stay date, lists 50 rooms on OTAs and similar channels and sells 40, leaving 10. It sets aside 30 rooms for direct, group and corporate-contract sales and sells 20 of them, and holds back the remaining 20 rooms from sale because of staffing. Actual occupancy is then (40 + 20) ÷ 100 = 60%. Meanwhile, 10 rooms remain on OTAs, so the OTA listed-inventory basis gives 100 − 10 = 90%. The 30-point gap is explained exactly by the 20 rooms held back from sale (20 points) and the 10 rooms allocated outside OTAs that went unsold (10 points).
Source: Prepared by the HotelBank Editorial Team (hypothetical 100-room example; figures are illustrative)
This relationship can be generalized. Let the “non-OTA share” be the share of total rooms not placed on OTAs (direct, group and corporate allocations plus rooms held back from sale), and the “non-OTA unused rate” the share of those rooms that actually went unused. The gap between the two measures is then roughly “non-OTA share × non-OTA unused rate”. The hypothetical example above corresponds to a non-OTA share of 50% and an unused rate of 60%, giving a 30-point gap (bold in the table).
| Non-OTA share \ unused rate | 10% | 20% | 40% | 60% |
|---|---|---|---|---|
| 10% | +1pt | +2pt | +4pt | +6pt |
| 20% | +2pt | +4pt | +8pt | +12pt |
| 30% | +3pt | +6pt | +12pt | +18pt |
| 50% | +5pt | +10pt | +20pt | +30pt |
| 70% | +7pt | +14pt | +28pt | +42pt |
Source: Prepared by the HotelBank Editorial Team (hypothetical calculation. Remaining rooms in the OTA-listed allocation appear on OTAs and are therefore not part of the gap.)
As an example of how to read the table, the measured gap of 11.0 points for business hotels is around “non-OTA 30%, unused 40%” (12 points), and the 36.5 points for ryokan corresponds to a combination between “non-OTA 70%, unused 60%” (42 points) and “non-OTA 50%, unused 60%” (30 points). Actual shares differ by property, and individual properties’ allocations cannot be reverse-engineered from this table, but the multiplicative structure explains why segments with gaps of a few points sit alongside segments with gaps above 30 points.
Two things follow from this structure. First, the OTA listed-inventory estimate almost never falls below actual occupancy; it runs structurally high. Second, the size of the gap is determined by how many rooms are not placed on OTAs and how many of those go unsold. The large 36.5-point gap for ryokan likely reflects the higher weight of group and travel-agency sales, and the practice of adjusting the number of rooms on sale day by day, both of which are more common than at business hotels.
Factor 3: Rooms on Sale Trimmed to Match Staffing
The third factor is the practice of limiting the number of rooms on sale to match housekeeping and front-of-house staffing. Even while operating, a property keeps some rooms off OTAs and other channels so that cleaning can keep up — a practice known in Japan as heya-dome (room blocking). In the statistics, these rooms stay in the denominator as “unused” and push occupancy down. On the OTA listed-inventory basis they do not appear as remaining rooms on OTAs, so they are treated as “absorbed” and push the estimate up. The same practice moves the two measures in opposite directions.
In Teikoku Databank’s Survey of Corporate Attitudes Toward Labor Shortages (April 2026), the share of ryokan and hotel companies reporting a shortage of non-regular staff fell to 38.5%, dropping into the 30% range for the first time in four years and two months, since February 2022. Conditions are improving, but the figure remains high compared with the survey-wide share for non-regular staff (28.8% in the July 2026 survey), so the practice of adjusting rooms on sale to staffing is likely to persist for now, particularly at ryokan and resorts. The pattern of larger gaps at ryokan and resorts and smaller gaps at business hotels is also consistent with differences in how widespread this practice is.
Factor 4: Non-OTA Sales — Direct, Group and Corporate Contracts
The fourth factor is non-OTA sales allocations: direct sales via the official website, travel agencies and groups, and corporate contracts. Coverage is limited to properties listing at least 30% of total rooms on OTAs and similar channels — which means a property is still included even if up to 70% of its rooms are allocated outside OTAs. If non-OTA allocations sell out, both measures rise; if they go unsold, the statistics count them as unused while the OTA listed-inventory basis counts them as absorbed. This corresponds to the 10 points in the numerical example.
How rooms are allocated outside OTAs is each property’s sales strategy itself. Allocations vary widely — from central-city business hotels with many corporate contracts, to ryokan in tourist areas with a heavy group mix, to hotels growing member sales on their official websites. Applied to an individual property, the OTA listed-inventory figure can therefore be far off. A similar gap between inventory-derived indicators and actual transactions also exists on the price side, where listed prices run well above settled ADR. That is why this article presents the measure only at prefecture and national level: aggregating by area smooths out much of the variation in allocation between properties.
Daily Swings Hidden by Monthly Averages — Tokyo in July
Where the OTA listed-inventory estimate excels is in capturing day-to-day movement rather than the level itself. Looking at Tokyo (804 properties / 104,099 rooms, based on listings on major booking sites) day by day in July, the high was 96.8% on Saturday, July 4 and the low was 82.2% on Monday, July 20 (Marine Day holiday), a range of 14.6 points. By day of week, the averages were 95.1% on Saturdays and 93.0% on Thursdays, versus 86.5% on Mondays and 88.8% on Sundays.
Source: Compiled by the HotelBank Editorial Team from MetroEngines Research (Tokyo, 804 properties / 104,099 rooms; based on listings on major booking sites; estimated) / reference line: Japan Tourism Agency, Overnight Travel Statistics Survey, June 2026 second preliminary release, Tokyo
The Japan Tourism Agency’s monthly statistics aggregate rooms occupied over the whole month, so these day-to-day variations do not show up. Publication also has to wait for the first preliminary release at the end of the following month. The OTA listed-inventory measure, by contrast, can be observed every day ahead of the stay date, capturing changes such as the difference between weekends and the day after a holiday, or sudden absorption on specific dates, as they happen. Its level runs higher than actual occupancy, but it is well suited to relative comparisons between days and between weeks.
Not Which Is Right, but Which Is Right for the Job
To sum up the breakdown so far: the two numbers do not reveal each other’s errors; they answer different questions. The Japan Tourism Agency’s room occupancy shows, on an all-properties basis, how much of an area’s or segment’s rooms were actually used. The OTA listed-inventory estimate shows how quickly, and how far, the inventory placed on OTAs is being absorbed. In practice, use each according to purpose.
| Aspect | Japan Tourism Agency room occupancy | OTA listed-inventory occupancy (est.) |
|---|---|---|
| Coverage | All property types, all rooms (grossed-up estimate) | Properties listing at least 30% of total rooms on OTAs and similar channels |
| Numerator | Rooms actually occupied | Total rooms − rooms remaining on OTAs (includes unlisted rooms) |
| Level | Close to actual occupancy | Runs higher than actual occupancy |
| Granularity / timeliness | Monthly; first preliminary release at the end of the following month | Daily; observed every day ahead of the stay date |
| Best suited for | Annual budgets and business plans, occupancy assumptions for investment decisions, verifying year-on-year change | Day-to-day inventory decisions, timing of rate changes, comparing demand by day of week and event date |
| Caveats | Preliminary figures may be revised; stratification criterion changed from 2026 | Do not read the absolute level as actual occupancy; use at area level |
Source: Prepared by the HotelBank Editorial Team
For budgeting and occupancy assumptions in investment cases, the Japan Tourism Agency’s statistics — all-properties based and close to actual occupancy — are the appropriate choice. When budgeting for a business hotel in Tokyo, for example, starting from the statistical level rather than the 90%-plus OTA listed-inventory figure keeps the revenue plan closer to reality. Keep in mind that the preliminary figures are subject to revision in later releases.
For day-to-day inventory decisions, on the other hand, the OTA listed-inventory measure, which shows how fast inventory is being absorbed, is the better fit. If the area’s absorption rate is rising faster than the previous week, that is a signal there may be room to hold or raise your own rates. Tracking absorption for future dates by lead time extends the same approach to forward-looking decisions. The way to use this measure is to read relative changes — week over week, day over day, differences between days of the week — rather than the absolute level.
Frequently Asked Questions
Q. What is the difference between room occupancy and guest (capacity) occupancy?
Room occupancy measures occupancy in rooms; guest occupancy measures it in number of guests relative to capacity. The Japan Tourism Agency publishes both; this article deals with room occupancy.
Q. Can I compare the OTA listed-inventory occupancy rate with my property’s actual occupancy?
Avoid comparing them directly. Because unlisted rooms are treated as absorbed, the area figure runs higher than actual occupancy. To compare with your own property, calculate your own OTA inventory absorption using the same definition and compare movements such as week-over-week change and day-of-week differences.
Q. Is the 22.7-point gap for July the same every month?
No. The gap is determined by the volume of unsold non-OTA allocations and rooms held back from sale, so it changes month to month with seasonal swings in group demand and staffing. The figures in this article are as of July 2026.
Summary
July 2026 room occupancy per the Japan Tourism Agency was 60.8% nationwide and 74.2% for business hotels (by prefecture, the June second preliminary release puts Tokyo at 75.4% and Fukuoka at 70.3%). The OTA listed-inventory estimate for the same July was 83.5% nationwide, 85.2% for business hotels, 91.1% for Tokyo and 88.4% for Fukuoka. The gap is explained by four factors: (1) the population — all properties versus OTA-listed properties; (2) a numerator definition that treats unlisted rooms as absorbed; (3) rooms held back from sale to match staffing; and (4) unsold non-OTA allocations. Because a gap remains even within segments and is larger for ryokan and resorts, factors (2)–(4) likely have the greater effect.
It is not a question of which is right, but of purpose. In practice, the workable split is the Japan Tourism Agency statistics for occupancy assumptions in budgeting and investment decisions, and the OTA listed-inventory measure — which shows the movement of inventory absorption — for day-to-day inventory decisions and the timing of pricing. Read the latter as relative change, on the understanding that it is an estimate that runs higher than actual occupancy.
Note: The occupancy rate in this article (OTA listed-inventory basis, estimated) is an estimate based on how inventory sold on OTAs is absorbed and differs from a property’s actual occupancy. Because rooms not listed on OTAs are treated as absorbed, it runs higher than actual occupancy. The Japan Tourism Agency’s July 2026 figures are first preliminary values and may be revised in the second preliminary release and the final figures.
References and Sources
■ Data sources
Japan Tourism Agency, Overnight Travel Statistics Survey: July 2026 first preliminary release (national, by property type) and June 2026 second preliminary release (by prefecture). MetroEngines Research’s occupancy rate (OTA listed-inventory basis, estimated) observes daily remaining rooms on major booking sites for each stay date, aggregates them for each of the 47 prefectures, and sums the results.
■ Calculation assumptions
OTA listed-inventory occupancy = 100 − 100 × OTA-listed rooms remaining ÷ total rooms. Coverage is a fixed set of properties listing at least 30% of total rooms on OTAs and similar channels. The national figure is calculated by summing daily remaining rooms and total rooms by prefecture (July 2026: 11,938 properties / 761,558 rooms; June 2026: 12,041 properties / 762,484 rooms). Rooms per day on the statistics side is our estimate from rooms occupied ÷ room occupancy ÷ 31 days. The sensitivity table is a hypothetical calculation of non-OTA share × non-OTA unused rate.
■ Limitations and caveats
The Japan Tourism Agency’s July 2026 figures are a first preliminary release and may be revised in the second preliminary release scheduled for September 30, 2026. Because July figures by prefecture have not been released, the regional comparison uses June figures. The OTA listed-inventory basis treats unlisted rooms as absorbed and is therefore an estimate that runs higher than actual occupancy; it is not a substitute for an individual property’s actual occupancy. Values for prefectures and segments with few covered properties are more volatile.
- Japan Tourism Agency, Overnight Travel Statistics Survey (July 2026 first preliminary release; June 2026 second preliminary release), press release (August 31, 2026) (Japanese)
- Japan Tourism Agency press materials, Overnight Travel Statistics Survey (July 2026 first preliminary release; June 2026 second preliminary release) (PDF, Japanese)
- Japan Tourism Agency, Overnight Travel Statistics Survey, July 2026 (first preliminary values), results tables (Excel, Japanese)
- Japan Tourism Agency, Overnight Travel Statistics Survey statistics page (Japanese)
- Teikoku Databank, Survey of Corporate Attitudes Toward Labor Shortages (April 2026) (Japanese)
- Teikoku Databank, Survey of Corporate Attitudes Toward Labor Shortages (July 2026) (Japanese)
- MetroEngines Research — occupancy rate (OTA listed-inventory basis, estimated), July 2026: 11,938 properties / 761,558 rooms nationwide; Tokyo 804 properties / 104,099 rooms; Fukuoka 380 properties / 28,979 rooms (based on listings on major booking sites)