

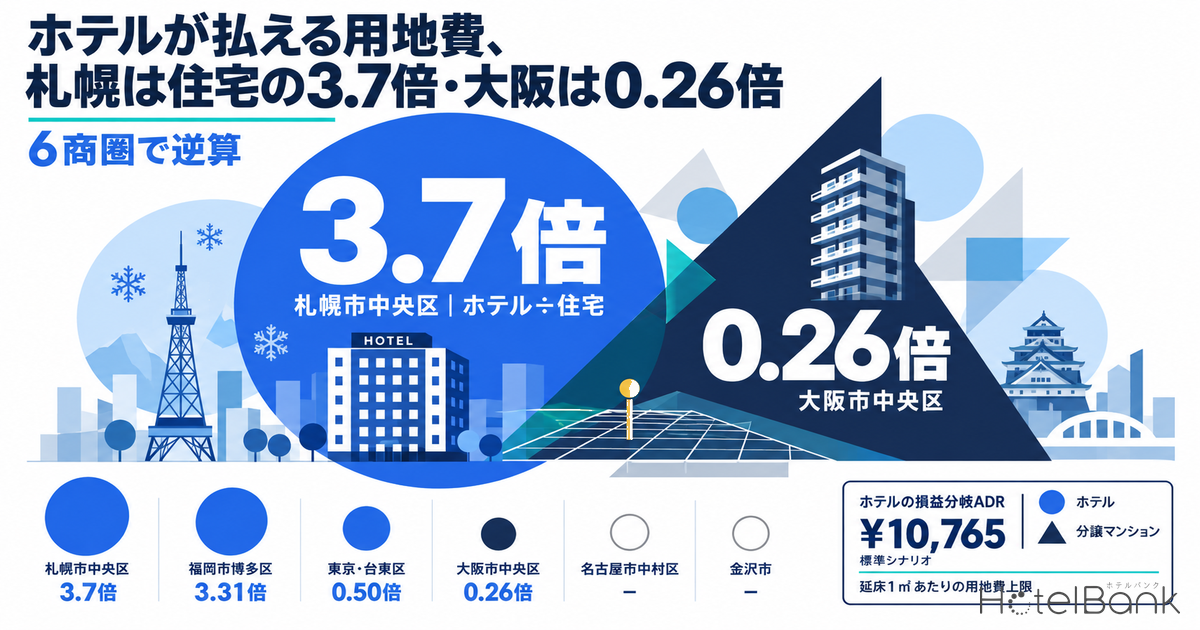
When a hotel developer and a condominium developer bid side by side for the same commercial site, how much each can pay per tsubo of land depends on the use. Land is priced by whoever can generate the highest return on it. This article back-calculates the maximum land price for each use — the hotel side from the estimated settled ADR, the residential side from the for-sale unit price — and puts both on the same footing, “how much can be paid for land per 1 m² of gross floor area (GFA)”, to compare six markets.
The conclusion first. In Sapporo’s Chuo Ward and Fukuoka’s Hakata Ward, the hotel side’s maximum land bid reaches 3.3–3.7 times that of the residential side, while in Tokyo’s Taito Ward it is only 0.50 times and in Osaka’s Chuo Ward just 0.26 times. In Nagoya’s Nakamura Ward and Kanazawa, under the standard scenario both hotels and condominiums exhaust the project budget before paying anything for land. The dividing line is not the floor-area ratio, but the amount each square meter of floor can earn.
HotelBank has previously published analyses of hotel land from other angles: a back-calculation of the maximum ground rent under a fixed-term business land lease, a test of the gap between transaction prices and official land prices for setting a land unit price, and an estimate of carrying costs after acquisition. This article differs from all of them — it is not about ground rent, unit-price estimation or holding costs, but about bidding power relative to a competing use. Using a single formula, it separates markets where hotels can win land from markets where they struggle to.
Metric Definitions Used in This Article
- ADR (Average Daily Rate): An estimated settled rate (tax-exclusive equivalent), calculated by applying segment-specific adjustment factors to the lowest-priced plan level each property publishes on major booking sites (per room, 2 guests, tax-inclusive). Checked against property-level results disclosed by listed hotel REITs (91 properties, most recent 3 months), the median error is about 7%. These are estimates and differ from each property’s actual settled prices and accounting figures. Area-level ADR is the median of the target properties (the level of a typical property in the area). This article uses the average of the 12 closed months from September 2025 to August 2026 and does not use any future months.
- OCC (occupancy rate): The share of rooms sold out of total rooms in the area (an estimate based on inventory offered on major booking sites). In this article it is shown for reference only; the calculations use the assumed OCC of the three scenarios described below.
- Maximum land price: The residual left after deducting construction costs, design/supervision costs and similar from the total project cost at which the assumed project meets its target yield. This follows the residual method and indicates the upper limit that can be paid for land.
- Per m² of GFA: How much can be paid for land for each 1 m² of gross floor area that can be built. Used to compare uses across markets with different floor-area ratios. The amount per tsubo of site area (1 tsubo = 3.3058 m²) is converted by multiplying this by each market’s median floor-area ratio and the effective ratio.
- Data sources: ADR, occupancy and supply — MetroEngines Research & Consulting. Land prices, transaction prices and construction costs — Ministry of Land, Infrastructure, Transport and Tourism (MLIT). Condominium prices — Real Estate Economic Institute Co., Ltd. (for comparison).
- — Sapporo Chuo Ward 3.71x, Fukuoka Hakata Ward 3.31x — the only two markets where the hotel’s maximum land bid exceeds the condominium’s. Estimated settled ADR is high at around ¥14,300–14,400, while near-new condo prices stay in the ¥700,000s per m².
- — Tokyo Taito Ward 0.50x, Osaka Chuo Ward 0.26x — Taito’s ADR of ¥14,400 is on par with Sapporo, but its near-new condo price of ¥1,356,000/m² is 1.9 times Sapporo’s, so the residential side can pay more.
- — Hotel break-even ADR is ¥10,800 (standard scenario) — Nagoya Nakamura Ward (¥10,400) and Kanazawa (¥10,200) fall below this line, so under standard assumptions a hotel does not work even with zero land cost.
- — Hotels cost 1.71 times as much to build as condominiums — ¥591,000 vs ¥345,000 per m² of floor (2024 construction starts). This structurally depresses hotels’ bidding power.
- — ADR matters most (±20% moves the maximum land price ±79.2%) — followed by GOP margin (±5pt → ±58.2%). The floor-area ratio multiplies both uses by the same factor, so it determines scale, not who wins.
The Back-Calculation — Hotels from ADR, Condos from Sale Price, Both per 1 m² of GFA
For both uses, the maximum land price is obtained by the residual method. What remains after subtracting building costs from the total project cost the business can justify is the most that can be paid for land. The only difference is the input figure.
1. Rooms per m² of GFA = 1 ÷ GFA per room
2. Annual room revenue = rooms × ADR × assumed OCC × 365
3. NOI = revenue × (GOP margin − deduction rate for FF&E reserve, property taxes, etc.)
4. Maximum total project cost = NOI ÷ target NOI yield
5. Maximum land price = (4) − construction cost × (1 + design/supervision and pre-opening cost rate)
1. Saleable area per m² of GFA = saleable-area ratio
2. Sales revenue = saleable area × sale price per m²
3. Project deductions = revenue × (selling expense rate + developer profit margin)
4. Maximum land price = (2) − (3) − construction cost × (1 + design/supervision cost rate)
* Consumption tax and interest are ignored. Because land transactions are tax-exempt, everything is aligned on a tax-exclusive basis.
Because both are calculated per 1 m² of GFA, markets with different floor-area ratios can be compared directly. If you need the amount per tsubo of site area, multiply the per-m²-of-GFA figure by “floor-area ratio × effective ratio × 3.3058”.
The assumptions are set as three scenarios rather than single values. The standard construction cost is based on MLIT’s “Statistics on Building Construction Starts” for 2024, with ±15% as the conservative/optimistic range. The key fact here is that hotels cost 1.71 times as much to build as condominiums. In 2024 construction starts, the planned construction cost of accommodation buildings was ¥591,000 per m² of floor (¥1,955,000/tsubo, 2,836 buildings), versus ¥345,000 (¥1,141,000/tsubo, 86,294 units) for for-sale reinforced-concrete apartment buildings. Hotels, with plumbing in every room and a high share of corridors, stairs and common areas, cost 1.7 times as much as housing to build the same floor area. This structurally depresses the hotel side’s bidding power.
| Assumption (hotel) | Conservative | Standard | Optimistic |
|---|---|---|---|
| Effective floor-area ratio (share of designated FAR actually used) | 80% | 85% | 90% |
| Assumed OCC (annual average) | 78% | 84% | 88% |
| GFA per room (incl. common areas) | 33 m² | 30 m² | 27 m² |
| GOP margin (% of room revenue) | 35% | 40% | 50% |
| FF&E reserve, property taxes, insurance (% of revenue) | 8% | 6% | 5% |
| Target NOI yield | 6.0% | 5.5% | 5.0% |
| Construction cost (per tsubo) | ¥2,250,000 | ¥1,955,000 | ¥1,662,000 |
| Design/supervision and pre-opening costs (% of construction) | 18% | 15% | 12% |
| Assumption (condominium) | Conservative | Standard | Optimistic |
|---|---|---|---|
| Saleable-area ratio (saleable area ÷ GFA) | 72% | 76% | 80% |
| Selling expense rate (% of revenue) | 9% | 7% | 6% |
| Developer profit margin (% of revenue) | 15% | 12% | 10% |
| Construction cost (per tsubo) | ¥1,312,000 | ¥1,141,000 | ¥970,000 |
| Design/supervision costs (% of construction) | 10% | 8% | 6% |
Inputs for the Six Markets — Settled ADR ¥10,200–14,400, Condo Prices ¥660,000–1,360,000/m²
The six markets are one each in Tokyo, Osaka, Nagoya, Fukuoka and Sapporo, plus Kanazawa as a regional hub for comparison. Each market is defined at the city or ward level, and the hotel ADR is the average estimated settled ADR over the 12 closed months (September 2025 to August 2026).
The residential sale price is the median per-m² transaction price, by market, of condominiums completed in 2019 or later (near-new) and sold in 2024–2025, taken from MLIT’s “Real Estate Transaction Price Information”. New-build sale prices themselves are not published at the city/ward level, so the near-new transaction price — which can be aligned across all six markets from the same public source — is used instead. For reference, the Real Estate Economic Institute’s “Kinki Region New Condominium Market Trends, H1 2026” puts the new-build price in the city of Osaka at ¥1,159,000/m², broadly consistent with this article’s near-new transaction price of ¥1,232,000 for Osaka Chuo Ward. The same institute’s “Greater Tokyo” report for H1 2026 gives ¥2,226,000 for Tokyo’s 23 wards, but that is a 23-ward average including the six central wards (¥3,436,000) and differs from the level of Taito Ward alone.
| Market | Estimated settled ADR | Properties / rooms | Near-new condo price (¥/m² saleable) | Median FAR | Ref.: estimated OCC |
|---|---|---|---|---|---|
| Sapporo Chuo Ward Odori / Susukino | ¥14,424 N=135 properties | 103 properties / 14,899 rooms | 706,667 N=281 deals | 400% | 93.5% |
| Fukuoka Hakata Ward Hakata Station | ¥14,314 N=146 properties | 137 properties / 12,518 rooms | 715,476 N=162 deals | 500% | 93.1% |
| Tokyo Taito Ward Asakusa / Ueno | ¥14,403 N=175 properties | 145 properties / 13,435 rooms | 1,356,349 N=398 deals | 600% | 91.0% |
| Osaka Chuo Ward Shinsaibashi / Honmachi | ¥12,322 N=193 properties | 127 properties / 19,287 rooms | 1,232,051 N=620 deals | 600% | 83.0% |
| Nagoya Nakamura Ward Meieki | ¥10,441 N=72 properties | 41 properties / 7,076 rooms | 753,846 N=133 deals | 500% | 87.4% |
| Kanazawa Kanazawa Station / Korinbo | ¥10,226 N=116 properties | 99 properties / 9,605 rooms | 661,538 N=37 deals | 300% | 80.9% |
Maximum Land Price Compared — Hotels Pay 3.71x Condos in Sapporo, 0.26x in Osaka
Plugging in the assumptions and back-calculating gives the following amounts that can be paid for land per 1 m² of GFA. The figures discussed are for the standard scenario.
| Market | Hotel: maximum land price (¥/m² GFA) | Condominium: same | Hotel ÷ condo (standard) | ||||
|---|---|---|---|---|---|---|---|
| Conservative | Standard | Optimistic | Conservative | Standard | Optimistic | ||
| Sapporo Chuo Ward | -243,159 | 231,186 | 981,922 | -49,214 | 62,259 | 163,850 | 3.71x |
| Fukuoka Hakata Ward | -247,429 | 224,237 | 970,144 | -44,394 | 67,682 | 169,769 | 3.31x |
| Tokyo Taito Ward | -243,974 | 229,860 | 979,673 | 306,292 | 462,204 | 600,436 | 0.50x |
| Osaka Chuo Ward | -324,764 | 98,386 | 756,867 | 238,276 | 385,686 | 516,908 | 0.26x |
| Nagoya Nakamura Ward | -397,789 | -20,452 | 555,475 | -23,398 | 91,303 | 195,554 | — |
| Kanazawa | -406,136 | -34,036 | 532,456 | -73,909 | 34,478 | 133,523 | — |
Hotels come out ahead in two markets: Sapporo Chuo Ward (3.71x) and Fukuoka Hakata Ward (3.31x). In both, estimated settled ADR is around ¥14,300–14,400, near the top of the six markets, while near-new condo prices stay in the ¥700,000s per m². A high ceiling on room rates combined with relatively low residential sale prices is what lifts hotels’ bidding power.
Conversely, in Tokyo Taito Ward (0.50x) and Osaka Chuo Ward (0.26x) the residential side comes out ahead. Taito’s estimated settled ADR of ¥14,400 is almost the same as Sapporo’s, but its near-new condo price of ¥1,356,000/m² is 1.9 times Sapporo’s. Osaka Chuo Ward has a lower ADR of ¥12,300 and a condo price of ¥1,232,000/m². When a lower ADR is combined with a high condo price, the gap widens sharply.
In Nagoya Nakamura Ward and Kanazawa, the hotel’s maximum land price turned negative under the standard scenario. Their ADRs of ¥10,400 and ¥10,200 fall below the break-even ADR discussed below (¥10,800 in the standard scenario). This is a matter that comes before any comparison between uses: under standard specifications and yield assumptions, construction and design/supervision costs use up almost all of the total project budget. However, in the optimistic scenario (construction cost −15%, assumed OCC 88% (full-year average), GOP margin 50%, target yield 5.0%), both markets turn positive, so the picture can change depending on how specifications, operating efficiency and financing terms are worked out.
Checked Against Official Land Prices — Hotels Can Reach the Bottom Quartile to the Median of Commercial Land
Next, we look at where the back-calculated maximum land prices sit relative to actual land prices. For the commercial land in each market, we collected the survey points of the 2026 Official Land Price Publication (as of January 1, 2026) and the 2026 Prefectural Land Price Survey (as of July 1, published September 2026), used the newer prefectural survey where the same site appears in both, and took the distribution by quartile.
| Market | Commercial survey points | YoY median | Land price bottom 25% (¥/m²) | Land price median (¥/m²) | Hotel maximum (¥/m² GFA) | Bottom 25% → per m² GFA | Median → per m² GFA |
|---|---|---|---|---|---|---|---|
| Sapporo Chuo Ward | 42 incl. 9 prefectural survey | +7.0% | 365,000 | 775,000 | 231,186 | 107,353 | 227,941 |
| Fukuoka Hakata Ward | 38 incl. 16 prefectural survey | +9.4% | 620,000 | 1,585,000 | 224,237 | 145,882 | 372,941 |
| Tokyo Taito Ward | 71 incl. 24 prefectural survey | +19.2% | 1,200,000 | 1,740,000 | 229,860 | 235,294 | 341,176 |
| Osaka Chuo Ward | 52 incl. 15 prefectural survey | +15.8% | 1,620,000 | 2,245,000 | 98,386 | 317,647 | 440,196 |
| Nagoya Nakamura Ward | 44 incl. 12 prefectural survey | +5.0% | 451,000 | 1,335,000 | -20,452 | 106,118 | 314,118 |
| Kanazawa | 59 incl. 35 prefectural survey | +3.2% | 84,000 | 113,000 | -34,036 | 32,941 | 44,314 |
In Sapporo Chuo Ward, the hotel maximum of ¥231,000 per m² of GFA compares with ¥228,000 for the commercial-land median converted to GFA terms. The numbers work on land up to the median. In Fukuoka Hakata Ward, the hotel maximum of ¥224,000 compares with ¥146,000 for the bottom quartile and ¥373,000 for the median, so land from the lower to the middle part of the distribution is within reach.
In Tokyo Taito Ward, the hotel maximum of ¥230,000 is roughly level with the bottom quartile at ¥235,000 — the numbers only just work in the cheapest quarter of commercial land. The residential maximum of ¥462,000, on the other hand, exceeds the median of ¥341,000. If both bid for the same site in Taito Ward, the hotel can only compete for bottom-quartile land, while the condominium developer can take land above the median. In Osaka Chuo Ward the gap is even wider: the hotel’s ¥98,000 against a bottom quartile of ¥318,000. Under standard-scenario assumptions, acquiring vacant commercial land in Shinsaibashi/Honmachi to build a new hotel is hard to make pencil out.
| Market | Highest-priced commercial site, 2026 | Price (¥/m²) | YoY | Designated FAR |
|---|---|---|---|---|
| Sapporo Chuo Ward | Sapporo Chuo 5-1 / 1-13 Kita-Sanjo-Nishi 2-chome and others (札幌中央5-1/北三条西二丁目1番13外) | 5,670,000 | +5.0% | 800% |
| Fukuoka Hakata Ward | Fukuoka Hakata 5-1 / 245 Hakata-Eki-Higashi 1-chome and others (福岡博多5-1/博多駅東一丁目245番外) | 5,800,000 | +1.8% | 600% |
| Tokyo Taito Ward | Taito 5-18 / 109-1 Ueno 6-chome (台東5-18/上野六丁目109番1) | 13,800,000 | +12.2% | 800% |
| Osaka Chuo Ward | Chuo 5-3 / 46-1 Soemoncho and others (中央5-3/宗右衛門町46番1外) | 25,800,000 | +7.1% | 500% |
| Nagoya Nakamura Ward | Nakamura 5-1 / 2701 Meieki 3-chome and others (中村5-1/名駅三丁目2701番外) | 19,900,000 | +1.0% | 1,300% |
| Kanazawa | Kanazawa 5-29 / 571-1 Honmachi 2-chome and others (金沢5-29/本町二丁目571番1外) | 1,280,000 | +8.5% | 600% |
Floor-Area Ratio Does Not Decide the Winner — Payment Capacity per m² of Floor Does
In competition for land, it is sometimes said that “the higher the floor-area ratio, the more housing is favored”. Checked against this article’s formula, that intuition is only half right.
For both hotels and housing, the maximum land price takes the form “payment capacity per 1 m² of GFA × floor-area ratio × effective ratio”. Because the floor-area ratio multiplies both by the same factor, the hotel-to-housing ratio does not change with the floor-area ratio. Whether the site has a FAR of 200% or 1,000%, in Sapporo Chuo Ward a hotel can pay 3.71 times what a condominium can. What the FAR changes is not who wins, but the absolute amount the winner can pay and the sale proceeds the landowner receives.
So what does decide the winner? The payment capacity per 1 m² of GFA itself — ADR for hotels, and the sale price for condominiums. Starting from there, the break-even points at which each use “works even with zero land cost” are as follows. These break-even points also do not depend on the floor-area ratio.
| Scenario | Hotel break-even ADR | Condo break-even sale price |
|---|---|---|
| Conservative | ¥20,687 | ¥797,000/m² saleable |
| Standard | ¥10,765 | ¥606,000/m² saleable |
| Optimistic | ¥5,253 | ¥463,000/m² saleable |
Under the standard scenario, the break-even point is an estimated settled ADR of ¥10,800 for hotels and a sale price of ¥606,000/m² for condominiums. The six markets’ ADRs range from ¥10,200 to ¥14,400, with Nagoya Nakamura Ward (¥10,400) and Kanazawa (¥10,200) below the line. On the residential side, all six markets exceed ¥606,000, with the distance from break-even ranging from 2.2 times in Taito Ward to 1.1 times in Kanazawa.
Sensitivity — ADR ±20% Moves the Maximum Land Price by ±79%
To see how strongly each assumption sways the result, we tested sensitivities against Tokyo Taito Ward’s standard scenario (maximum land price ¥229,860 per m² of GFA).
ADR has the largest effect: a ±20% swing moves the maximum land price by ±79.2% (+¥182,000 / −¥182,000). Next is GOP margin, where ±5pt means ±58.2%. Reducing GFA per room from 30 m² to 27 m² adds 44.0%, while enlarging it to 33 m² subtracts 36.0%. Construction cost ±15% moves it by ∓44.4%; lowering the target yield from 5.5% to 5.0% adds 39.6%, and raising it to 6.0% subtracts 33.0%. Assumed OCC ±5pt moves it by ±23.6%.
There are two takeaways. First, if you want to win in competition for land, ADR is the lever to pull first. Choosing a market that can command ADR at the site-selection stage, and raising the achievable ADR through room mix, brand and ancillary design at the planning stage, translate into bidding power more directly than any other variable. Second, the design of GFA per room is a lever almost as powerful as construction cost. Cutting 30 m² to 27 m² has nearly the same effect as lowering the construction unit cost by 15% (measured GFA per room in practice ranges from 13 to 196 m²).
Cross-Check on the Supply Side — Plans Pile Up Where Land Can Be Won
The bidding-power calculation is a desk exercise, but whether land is actually being secured shows up in supply. Below, planned projects from MLIT’s “Building Dynamics Statistics Survey” (based on building-permit applications) are shown alongside 2026 new openings confirmed via listings on major booking sites.
| Market | Planned hotels (building-permit basis) | Rooms | 2026 new openings (prefecture) | Rooms |
|---|---|---|---|---|
| Sapporo Chuo Ward | 4 | 714 rooms | Hokkaido: 135 properties | 2,702 rooms |
| Fukuoka Hakata Ward | 0 | 0 rooms | Fukuoka: 56 properties | 1,372 rooms |
| Tokyo Taito Ward | 1 | 168 rooms | Tokyo: 80 properties | 2,324 rooms |
| Osaka Chuo Ward | 2 | 340 rooms | Osaka: 41 properties | 2,986 rooms |
| Nagoya Nakamura Ward | 0 | 0 rooms | Aichi: 18 properties | 672 rooms |
| Kanazawa | 0 | 0 rooms | Ishikawa: 11 properties | 257 rooms |
The population is small, so no conclusion can be drawn from the counts alone. Still, 4 planned projects totaling 714 rooms were found in Sapporo Chuo Ward, where hotels’ bidding power exceeded housing, while none were extracted in Nagoya Nakamura Ward or Kanazawa, where the hotel’s maximum land price was negative — consistent with the direction of the back-calculation. Both of the 2 projects (340 rooms) in Osaka Chuo Ward list hotel as their principal use.
At the prefecture level, 2026 new openings are led by Hokkaido with 135 properties and 2,702 rooms, followed by Tokyo with 80 properties and 2,324 rooms and Fukuoka with 56 properties and 1,372 rooms. Ishikawa had only 11 properties and 257 rooms, and Aichi 18 properties and 672 rooms.
When Hotels Can Win Land — Three Checkpoints
From the back-calculation across six markets, whether a hotel can go after a site alongside a competing use can be judged on the following three points.
1. Is the estimated settled ADR above ¥11,000?
The break-even ADR under the standard scenario is ¥10,800. In markets below it, the target yield cannot be reached even with zero land cost. First check the ADR tier; if it falls short, work out first whether specifications, operating efficiency and financing terms can be pushed toward the optimistic side.
2. Is the condo sale price below ¥1,000,000/m²?
In Sapporo Chuo Ward and Fukuoka Hakata Ward, where hotels came out ahead, near-new condo prices were both in the ¥700,000s per m². In markets where residential prices exceed ¥1,000,000/m², hotels’ relative bidding power drops sharply even at the same ADR.
3. Floor-area ratio shapes scale, not the winner
Because the floor-area ratio applies the same factor to both uses, it does not move the ratio between them. What it changes is the absolute amount that can be paid and the landowner’s proceeds. Looking for high-FAR sites is not a condition for outbidding the competition, but a condition that makes the deal bigger once you win.
From the land seller’s perspective, this structure is a guide to “which use to approach”. In central districts where condo prices exceed ¥1,000,000/m², residential developers tend to bid high; in markets where condo prices are sluggish but room rates hold up, hotel operators are competitive. Sapporo Chuo Ward and Fukuoka Hakata Ward are, at present, among the markets where the hotel side can put the highest price on land.
For non-hotel developers considering a hotel project, simply adding checkpoints 1 and 2 to the initial screening of markets goes a long way toward ordering the evaluation. Beyond that, concentrating planning effort on the three factors with the greatest sensitivity — ADR, GOP margin and GFA per room — is a rational use of limited time. It is also worth checking the financing ceiling (how much can be borrowed) and the carrying costs of land after acquisition.
References and Sources
■ Data sources
The hotel-side estimated settled ADR is the 12-closed-month average from September 2025 to August 2026 for the target properties in each market (MetroEngines Research & Consulting; N = 12-month median of the number of properties in the calculation). The residential near-new condo price is the median per-m² price from MLIT’s “Real Estate Transaction Price Information” for units sold in 2024–2025, completed in 2019 or later, with 20–200 m² of saleable area. Construction costs are from MLIT’s “Statistics on Building Construction Starts” (2024 results); land prices from the 2026 Official Land Price Publication and the 2026 Prefectural Land Price Survey; median FAR is the median designated floor-area ratio of commercial survey points in each ward; supply is compiled from MLIT’s “Building Dynamics Statistics Survey” and listings confirmed on major booking sites.
■ Modeling assumptions
The maximum land price is an estimate using the residual method. For hotels: “rooms × ADR × assumed OCC × 365 → GOP margin minus deductions such as FF&E reserve → NOI → maximum total project cost at the target NOI yield → deduct construction cost × (1 + design/supervision and pre-opening cost rate)”. For condominiums: “saleable-area ratio × sale price → deduct selling expense rate and developer profit margin → deduct construction cost × (1 + design/supervision cost rate)”. Both are aligned per 1 m² of GFA for comparison. Assumptions are set as conservative, standard and optimistic scenarios rather than single values, with construction costs at ±15% of 2024 construction-start results for the conservative/optimistic range. The standard scenario for hotels is an effective FAR of 85%, assumed OCC of 84% (full-year average), 30 m² of GFA per room, GOP margin of 40%, deduction rate of 6%, target NOI yield of 5.5% and design/supervision of 15%; for condominiums, a saleable-area ratio of 76%, selling expense rate of 7%, developer profit margin of 12% and design/supervision of 8%. Consumption tax and interest are ignored, and everything is aligned on a tax-exclusive basis.
■ Limitations
The maximum land prices in this article are simplified estimates; actual investment decisions require a detailed feasibility study. Interest, financing costs during construction, consumption tax, demolition costs, underground obstructions and rights relating to existing buildings are not considered. ADR is an estimate (median error of about 7% against property-level results disclosed by listed hotel REITs), and official land prices are the normal price of vacant land, which differs from actual transaction prices (in a test of 394 transactions across 10 markets, transaction prices were 0.86 times the official land price). Construction costs are nationwide construction-start results and differ from actual costs for individual projects. Condominium prices are transaction results for near-new resale units, not new-build sale prices themselves, and estimated OCC is based on inventory listed on major booking sites and differs from actual property-wide occupancy. Planned hotel counts are a lower bound based on building-permit applications, and new openings are prefecture-level totals, not market-level totals.
■ Market data
- MetroEngines Research & Consulting — estimated settled ADR (12 closed months, September 2025 to August 2026); property counts, room counts and estimated occupancy based on inventory listed on major booking sites; 2026 new openings (listing-confirmed basis)
■ Government statistics and public data
- MLIT Real Estate Information Library — 2026 Official Land Price Publication (as of January 1, 2026), 2026 Prefectural Land Price Survey (as of July 1, 2026; published September 2026), Real Estate Transaction Price Information (transactions in 2024–2025)
- MLIT “Statistics on Building Construction Starts” — building construction starts by use (e-Stat table ID 0003114490, accommodation buildings, 2024); housing construction starts by tenure, structure and building type (table ID 0003114524, for-sale / apartment building / reinforced concrete, 2024)
- MLIT “Building Dynamics Statistics Survey” — building-permit application data for planned hotels
■ Private-sector and industry research
- Real Estate Economic Institute Co., Ltd., “Greater Tokyo New Condominium Market Trends, H1 2026 (January–June)” (July 21, 2026) — Tokyo 23 wards ¥2,226,000/m²; six central wards ¥3,436,000/m²
- Real Estate Economic Institute Co., Ltd., “Kinki Region New Condominium Market Trends, H1 2026 (January–June)” (July 21, 2026) — city of Osaka ¥1,159,000/m²
- Real Estate Economic Institute Co., Ltd., “Nationwide New Condominium Market Trends 2025” (February 25, 2026) — average prices in major regional cities
- Invincible Investment Corporation (インヴィンシブル投資法人) portfolio disclosure — GOP margin of 38.9% across 91 operating properties (FY ended December 2024)