

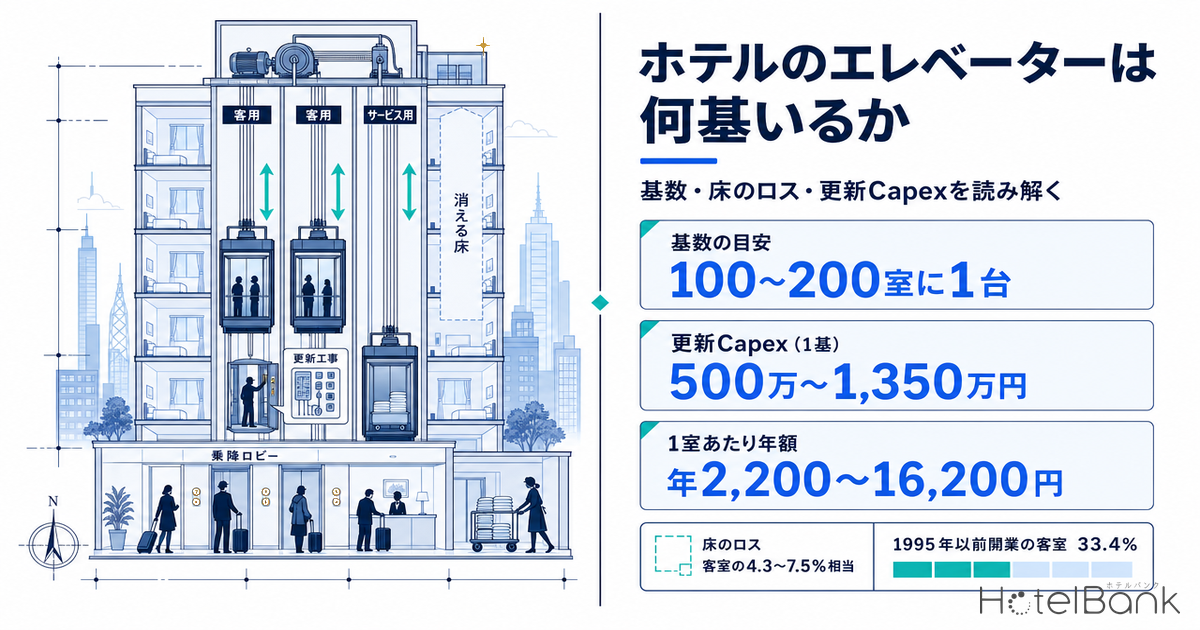
When a hotel is first drawn up, one number gets fixed almost as early as the room count: the number of elevators. Adding a car makes vertical transport easier, but it removes floor area on every level, and with it guest rooms. Once set, that count also becomes the multiplier applied to every replacement project over the next 20–30 years. This article looks only at elevators and covers two questions, using public benchmarks and our own property data: how many cars a hotel needs at opening, and when and at what cost they must be replaced during the holding period.
Scope of This Article
This article covers only the number of elevators and their replacement works. Statutory inspection costs (¥3,400–¥12,600 per room per year) pay for inspections and reports, not for replacement. Total capital expenditure (¥130k–¥620k per room per year) is an aggregate figure that does not break costs down by building system. Pre-1981 seismic-standard buildings and onsen bath facility upgrades involve different systems and different issues.
Metric Definitions Used in This Article
- ADR (Average Daily Rate): An estimated contracted rate (tax-excluded equivalent). We take the lowest-plan price level each property publishes on OTAs and similar channels (per room, 2 guests per room, tax included) and apply a correction factor by hotel type. Checked against property-level results disclosed by listed hotel REITs (91 properties, most recent 3 months), the median error is about 7%. These are estimates and differ from each property’s actual contracted prices and accounting figures. Area-level ADR is the median of the properties covered, i.e. the level of a typical property in the area.
- OCC (Occupancy Rate): This article uses room occupancy by property type from the Japan Tourism Agency’s Overnight Travel Statistics Survey, 2025 annual figures (final). These are not MetroEngines’ estimated OCC figures.
- Average interval: The average time between elevator departures from the main floor. Half of this value approximates the average waiting time. 5-minute handling capacity: The number of people all cars running at full capacity can carry in 5 minutes, as a percentage of the building population served.
- Data sources: MetroEngines Research & Consulting; Ministry of Land, Infrastructure, Transport and Tourism (MLIT) Building Construction Statistics; Japan Tourism Agency Overnight Travel Statistics Survey
- — One passenger car per 100–200 rooms; service cars about one-third of that. Including redundancy, 3–4 cars is the standard setup for a 100–300-room urban hotel.
- — Lost floor area equals 4.3–7.5% of the room count. In a 14-storey building, one extra car takes the floor area of about 4 guest rooms, or roughly ¥83M at construction cost.
- — Replacement costs ¥5.0M–¥13.5M per car (control-only, partial or full removal). Spread over a 25–30-year cycle, that is ¥2,200–¥16,200 per room per year.
- — 0.09–0.56% of room revenue. But capitalizing the mid scenario for 3 cars at a 5.0% cap rate gives a value gap of about ¥18.5M per building.
- — 565,666 rooms (33.4%) are in properties opened in 1995 or earlier. Adding those opened in 1996–2005, about 790,000 rooms are in, or about to enter, the replacement window.
The Bottom Line — Three Numbers
Whether you are designing, acquiring or taking over a hotel, the numbers that matter come down to three.
| Issue | Number | What it means |
|---|---|---|
| Number of cars | Passenger: 1 per 100–200 rooms; service: about 1/3 of passenger | Even at around 200 rooms, 2 passenger + 1 service car (3 in total) is the practical standard |
| Lost floor area | All elevators together: 4.3–7.5% of the room count (3–4 cars) | In a 14-storey building, one extra car removes the floor area of about 4 guest rooms |
| Replacement capex | ¥5.0M–¥13.5M per car / ¥2,200–¥16,200 per room per year | 0.09–0.56% of room revenue. The smaller the hotel, the heavier the per-room burden |
The third number is the core of this article. Elevator replacement costs tens of millions of yen in total, but spread per room per year it falls in the same range as statutory inspection costs (¥3,400–¥12,600 per year). In other words, there is a second cost item about as heavy as inspections, separate from them. It is often missed in capex build-ups at acquisition not because it is small, but because it occurs only once every 20–30 years and leaves no trace in recent income statements.
How Many Cars? — What “One per 100–200 Rooms” Really Means
In building design practice, the usual starting point for hotels is one passenger elevator per 100–200 rooms, with service elevators at about one-third of that number. The traffic logic behind it: city hotels have a high share of twin rooms, so each car serves (100–200 rooms) × 2 guests = 200–400 people, which overlaps with the office-building benchmark of 250–350 people per car. It also matters that the rule assumes guest traffic is kept separate from back-of-house traffic for linen, housekeeping and food and beverage.
But “one per 100–200 rooms” is a range with a factor of two. Service-level benchmarks decide which end to use. For hotels, the guideline is an average interval of 40 seconds or less and a 5-minute handling capacity of 8–10% (the upper end for large hotels, the lower end for small and mid-sized ones). A 40-second interval corresponds to an average wait of 20 seconds. Hotels where downward demand bunches up during the 9–11 a.m. check-out peak size their car count around that window.
The assumptions change for limited-service hotels, resorts and ryokan. Limited-service hotels have small rooms and many rooms per floor, so the same room count needs fewer floors. Shorter vertical travel keeps intervals tight. On the other hand, if there is no linen room on each floor, service-car use jumps. Resorts and ryokan are often low-rise or split across several buildings, and do not connect the whole property with one elevator system in the first place. The models below assume an urban hotel (from limited-service to full-service city hotel).
Floors Rise With Room Count — Data From 62 Planned Projects
Room count alone does not set the number of cars. More stops mean a longer round trip, so the same room count needs more cars. Looking at planned hotels (projects whose use is hotel only) from MLIT’s Building Construction Statistics, the number of planned floors clearly rises with the number of rooms.
Source: Compiled by MetroEngines Research & Consulting from MLIT Building Construction Statistics (N=62 planned hotel-only projects with both room count and floor count known)
| Room-count band | Projects | Median rooms | Median floors | Floor range |
|---|---|---|---|---|
| Under 100 rooms | 20 | 39 rooms | 7 floors | 3–10 floors |
| 100–199 rooms | 19 | 134 rooms | 11 floors | 3–36 floors |
| 200–299 rooms | 14 | 235 rooms | 13.5 floors | 9–28 floors |
| 300 rooms or more | 9 | 389 rooms | 14 floors | 3–26 floors |
Source: Compiled by MetroEngines Research & Consulting from MLIT Building Construction Statistics (N=62)
Note that 37 of the 62 projects (59.7%) have 10 or more floors. With typical hotel floor heights of 3.2–3.5 m, a building above 10 floors reaches about 31 m. Article 34(2) of the Building Standards Act requires buildings taller than 31 m to have an emergency elevator, so more than half of new urban hotel plans sit around this threshold.
An Emergency Elevator Does Not Necessarily Mean One More Car
Emergency elevators are often misunderstood, so it is worth going through the rules in order. First, Article 34(2) of the Building Standards Act requires them in buildings taller than 31 m. However, Article 129-13-2 of the Enforcement Order sets exemptions: for example, no emergency elevator is required if the total floor area of the floors above 31 m is 500 m² or less. The same applies when only a penthouse, stairwell or machine room rises above 31 m.
The number required is based on the largest floor above 31 m. If that floor is 1,500 m² or less, one car is required; above that, one more car is added for every additional 3,000 m². Emergency elevators also need a boarding lobby of at least 10 m² per car. The car must be equivalent to 17 persons or more (rated load of at least 1,150 kg).
The key practical point is that an emergency elevator can serve as a passenger or service car in normal operation. So crossing 31 m does not simply add one car. What changes is the specification and shaft cross-section of one car, plus the statutory 10 m² lobby. The cost difference at the design stage shows up in specification and floor area, not in the number of cars.
Car Counts in Four Models
| Model | Rooms | Floors | Passenger cars by rule of thumb | Passenger cars with redundancy | Service cars | Cars adopted here |
|---|---|---|---|---|---|---|
| Small | 100 rooms | 7 floors | 1 | 2 | 1 | 3 cars |
| Mid-size | 150 rooms | 11 floors | 1–2 | 2 | 1 | 3 cars |
| Standard | 200 rooms | 13 floors | 1–2 | 2 | 1 | 3 cars |
| Large | 300 rooms | 14 floors | 2–3 | 3 | 1 | 4 cars |
Floors are the median by room-count band of the 62 planned projects above. Car counts follow published building services planning benchmarks (1 passenger car per 100–200 rooms; service cars about 1/3 of passenger cars) / Compiled by MetroEngines Research & Consulting
Following the rule of thumb alone gives one passenger car for 100 rooms, but almost no real project adopts that. The reason is the replacement work covered later in this article. A building with only one passenger car will have periods with no passenger elevator at all during replacement. Redundancy is kept not only for everyday service levels but, to a large extent, to make construction staging possible 20–30 years later.
Lost Floor Area — How Many Rooms Is One Car?
Elevators pass through every floor, so floor area is lost in proportion to cars × floors. The footprint has two parts: the hoistway (shaft) and the boarding lobby.
The hoistway cross-section is the car’s internal dimensions plus room for the structure, guide rails and counterweight. Standard internal car sizes for passenger elevators are 1,400 × 1,350 mm for an 11-person (750 kg) car and 1,600 × 1,500 mm for a 15-person (1,000 kg) car, and the hoistway is a size larger. A practical design allowance is roughly 4–5 m² per car. The lobby on each floor comes on top of that. Because lobbies are shared across a bank (a group of cars), the share per car is smaller, but once evacuation routes, fixtures and signage are included, about 4–7 m² per car is typically needed. This article assumes 8–12 m² per car per floor in total.
Relationship to floor area ratio: Under the Building Standards Act amendment that took effect in July 2014 (Article 52(6)), hoistway floor area is no longer counted in the total floor area used for floor area ratio (FAR). However, this relief applies only to the hoistway itself, not to boarding lobbies or elevator halls. Hoistways also still count toward building coverage ratio. On sites with no spare FAR, the hoistway exemption gives more design freedom, but it does not mean the floor space is not lost. The physical floor area is still gone, and the area available for guest rooms shrinks accordingly.
Source: MetroEngines Research & Consulting estimates (assumptions: hoistway + allocated lobby of 8–12 m² per car per floor; gross floor area per room = 35.0 m²)
| Model | Cars × floors | Area taken | Room equivalent (35.0 m²/room) | Share of room count |
|---|---|---|---|---|
| 100 rooms, 7 floors | 3 cars × 7 floors | 168–252 m² | 4.8–7.2 rooms | 4.8–7.2% |
| 150 rooms, 11 floors | 3 cars × 11 floors | 264–396 m² | 7.5–11.3 rooms | 5.0–7.5% |
| 200 rooms, 13 floors | 3 cars × 13 floors | 312–468 m² | 8.9–13.4 rooms | 4.5–6.7% |
| 300 rooms, 14 floors | 4 cars × 14 floors | 448–672 m² | 12.8–19.2 rooms | 4.3–6.4% |
Source: MetroEngines Research & Consulting estimates
Across the four models, the floor area taken by elevators stays at roughly 4–7% of the room count. The share barely falls as hotels get bigger because floor counts rise along with room counts. More floors mean more shaft area per car, so economies of scale are weak.
For design decisions, it is most useful to work backwards. At 10 m² per car per floor (the midpoint), adding one car in a 14-storey building takes the floor area of about 4 guest rooms. The trade-off is therefore: add one passenger car to cut average waiting time, or keep 4 rooms. Using our earlier estimate of ¥20.67M construction cost per room, 4 rooms equal about ¥83M of construction investment. Even compared with the cost of installing one commercial passenger elevator in a new build (published market rates of roughly ¥23M–¥38M including installation), the opportunity cost of the lost rooms is larger.
Note that the median gross floor area per room across 60 planned projects was 47.7 m². This figure is on a building-plan basis that includes parking and shared facilities on lower floors, so it comes out higher than the 35.0 m² per-room unit. The table above uses 35.0 m² for consistency with our earlier analysis, but dividing by 47.7 m² would make the room equivalents about 30% smaller. We want to be clear that the size of the conclusion depends on this assumption.
Replacement Capex — When and How Much
This is where the holding period comes in. Elevator replacement is not “fix it because it broke” but “replace it because parts will no longer be available”. The statutory useful life for depreciation is 17 years, but that is only an accounting classification. In practice, decisions rest on two factors.
The first is the parts supply period. Supply of major parts is said to end roughly 20–25 years after installation, and once supply stops, failures can no longer be repaired. The second is the planned service life: the LCC evaluation guidelines of the Building and Equipment Long-life Cycle Association (BELCA) use 30 years. By component, benchmarks are around 20 years for the control panel and 20–30 years for the traction machine (drive unit), and full replacement is generally expected at 25–30 years.
Three Methods, a Threefold Cost Gap
| Method | Scope of replacement | Cost (per car) | Construction period | Downtime (per car) | Typical cycle |
|---|---|---|---|---|---|
| Control modernization | Partial upgrade, e.g. control panel and traction machine | ¥4M–¥7M | 1–2 weeks | 3 days–1 week | 20–25 years |
| Partial-removal modernization | Reuses some parts such as rails and door frames; replaces main equipment | ¥7M–¥10M | 15–25 days | 2 weeks–1 month | 25–30 years |
| Full-removal replacement | Replaces all equipment in the hoistway | ¥12M–¥15M | 1–2 months | 2 weeks–1 month | 25–30 years |
Source: Compiled by MetroEngines Research & Consulting from published market rates for elevator modernization (public information from several contractors). Costs and periods vary with building conditions
“Replacement” can cost anywhere from ¥4M to ¥15M, a range of more than three times. The range depends on how much of the existing hoistway dimensions, rails and entrance frames can be reused. Older buildings whose hoistways do not match current standard car sizes lean toward full removal, while relatively new buildings can extend life with control modernization alone. What a pre-acquisition engineering report should confirm is not “how old is it” but “which method is feasible”.
Spreading the Cost per Room per Year
Cars × unit cost ÷ rooms ÷ cycle years gives the annual cost per room. We set three scenarios.
| Scenario | Method and unit cost | Cycle | Annual cost per car |
|---|---|---|---|
| Low | Control modernization, ¥5.0M | 30 years | ¥167k |
| Mid | Partial-removal modernization, ¥8.5M | 27.5 years | ¥309k |
| High | Full-removal replacement, ¥13.5M | 25 years | ¥540k |
Source: MetroEngines Research & Consulting estimates (assumptions as in the table above; car counts from the models above)
| Model | Cars | Low | Mid | High | Mid-scenario total (one cycle) |
|---|---|---|---|---|---|
| 100 rooms | 3 | ¥5,000 | ¥9,300 | ¥16,200 | ¥25.5M |
| 150 rooms | 3 | ¥3,300 | ¥6,200 | ¥10,800 | ¥25.5M |
| 200 rooms | 3 | ¥2,500 | ¥4,600 | ¥8,100 | ¥25.5M |
| 300 rooms | 4 | ¥2,200 | ¥4,100 | ¥7,200 | ¥34.0M |
Annual cost per room (¥ per room per year). Source: MetroEngines Research & Consulting estimates
The range is ¥2,200–¥16,200 per room per year. Scale is what drives it. Since 100-room and 200-room hotels both have 3 cars, the total replacement cost is about the same. Only the denominator, the room count, doubles, so the per-room burden is exactly halved. Elevator cost rises in steps, so a building that packs in as many rooms as the same 3 cars can serve is the most efficient on a per-room basis.
Impact on Room Revenue and NOI
Next, we look at this annual cost as a share of revenue. Using MetroEngines Research’s estimated contracted ADR, the average for the latest 12 months (September 2025–August 2026) across six major prefectures (Tokyo, Osaka, Aichi, Fukuoka, Hokkaido and Kyoto) gives a median of about ¥10,500 for business hotels and about ¥16,300 for city hotels. We multiply this by room occupancy from the Japan Tourism Agency’s Overnight Travel Statistics Survey, 2025 annual figures (final) — 75.3% for business hotels and 74.1% for city hotels — and annualize over 365 days.
| Hotel type | Estimated contracted ADR | Room occupancy | Room revenue per room per year | Replacement capex share (mid) |
|---|---|---|---|---|
| Business hotel, 100 rooms | ¥10,500 | 75.3% | approx. ¥2.89M | 0.32% |
| Business hotel, 200 rooms | ¥10,500 | 75.3% | approx. ¥2.89M | 0.16% |
| City hotel, 300 rooms | ¥16,300 | 74.1% | approx. ¥4.41M | 0.09% |
ADR is the median estimated contracted ADR across six major prefectures (September 2025–August 2026; business hotels N=314–924 properties/month, city hotels N=30–109 properties/month) / Sources: MetroEngines Research & Consulting; Japan Tourism Agency, Overnight Travel Statistics Survey, 2025 annual figures (final)
That is 0.09–0.32% of room revenue (0.56% for the 100-room model in the high scenario). On its own, it looks small. Seen through NOI, however, the picture changes. Capitalizing an outflow of ¥9,300 per room per year (100 rooms, mid scenario) at a 5.0% cap rate gives about ¥185k per room, or about ¥18.5M for the whole building (3 cars × ¥309k/yr = ¥927k/yr ÷ 5.0%). The 200-room model also has 3 cars, so the building total is the same, about ¥18.5M (about ¥93k per room, half as much). For a property bought at ¥15M per room, this annual cost lowers the NOI yield by 0.03–0.06 pt.
How much 0.06 pt matters will depend on where you sit. What is important is that it can be made visible as room to negotiate deal terms. For a property whose engineering report says “28 years old, control panel parts no longer supplied”, an outflow of 3 cars × ¥8.5M = ¥25.5M within 3 years of acquisition is almost certain. Whether this is priced in, or the seller replaces the cars before handover, the starting point of negotiations depends on whether the number is in the report.
Value Impact Sensitivity — Replacement Scenario × Cap Rate
We extend the capitalization above along two axes: replacement scenario (low, mid, high) and cap rate (4.0–6.0%). The values are the building’s total annual replacement cost capitalized, so for the same number of cars they are the same regardless of room count.
| Scenario | 3 cars, 4.0% | 3 cars, 5.0% | 3 cars, 6.0% | 4 cars, 4.0% | 4 cars, 5.0% | 4 cars, 6.0% |
|---|---|---|---|---|---|---|
| Low (control ¥5.0M, 30 yrs) | ¥12.5M | ¥10.0M | ¥8.3M | ¥16.7M | ¥13.3M | ¥11.1M |
| Mid (partial removal ¥8.5M, 27.5 yrs) | ¥23.2M | ¥18.5M | ¥15.5M | ¥30.9M | ¥24.7M | ¥20.6M |
| High (full removal ¥13.5M, 25 yrs) | ¥40.5M | ¥32.4M | ¥27.0M | ¥54.0M | ¥43.2M | ¥36.0M |
Building’s total annual replacement cost (cars × annual cost per car) ÷ cap rate, rounded to the nearest ¥0.1M. 3 cars = 100–200-room models (¥500k / ¥927k / ¥1.62M per year); 4 cars = 300-room model (¥667k / ¥1.236M / ¥2.16M per year) / Source: MetroEngines Research & Consulting estimates
Even with the same 3 cars, a property where full removal is required and the cap rate has tightened to 4.0% shows a value impact of about ¥40.5M — roughly 5 times the low × 6.0% case (about ¥8.3M). This range is why it matters to check which method is feasible before acquisition.
Replacing While Operating — Calculating Remaining Capacity
What makes hotel replacement work fundamentally different from housing or offices is that closing the property is practically not an option. As shown above, downtime is 3 days to 1 week for control modernization and 2 weeks to 1 month for partial or full removal. Replacing 3 cars one at a time means that, with full removal, the building runs “one car short” for a total of 1.5–3 months.
The remaining capacity during that period can be estimated with simple division. Taking 1 of n cars out of service leaves (n−1)/n of handling capacity, and the average interval lengthens by the inverse of that ratio.
| Total cars | Remaining capacity with 1 car out | Average interval (40 sec normally) | Average waiting time | Assessment |
|---|---|---|---|---|
| 2 cars | 50% | 80 sec | 40 sec | Queues likely during the morning down-peak |
| 3 cars | 67% | 60 sec | 30 sec | Manageable by adjusting operations at peak times |
| 4 cars | 75% | 53 sec | 27 sec | Can be absorbed within normal operations |
| 5 cars | 80% | 50 sec | 25 sec | Limited impact |
Source: MetroEngines Research & Consulting estimates (simple conversion based on the common design benchmark of a 40-second average interval for hotels, with average waiting time at half the interval)
With 3 cars, remaining capacity is 67% and the average wait is 30 seconds. That is above the desirable level (an interval of 40 seconds or less), but it is a realistic temporary state during works. This is exactly where the value of securing 3 cars (2 passenger + 1 service) at the design stage pays off.
To keep operating through replacement, hotels in practice use options such as the following. Schedule the works in the off-season (January–February for urban hotels; before the end of the rainy season for resorts, for example). During works, temporarily open the service car to guests and move linen transport to late-night hours. Apply floor-by-floor stop control only during the morning check-out peak, giving priority to down-traffic from upper floors. Another option is to notify guests at the front desk in advance and deliberately sell fewer rooms on upper floors. All of these are adjustments to get through without stopping revenue; there is no need to plan on the assumption that replacement works will hold back occupancy.
How Many Rooms Are Entering the Replacement Window — 566k
How large is this replacement demand across the whole market? From our property data, we extracted properties with 30 or more rooms in hotel/ryokan categories whose opening year is known: N=14,151 properties with 1,693,976 rooms in total. The table below groups them by opening period.
Source: MetroEngines Research & Consulting (N=14,151 properties, 1,693,976 rooms; properties with 30+ rooms in hotel/ryokan categories with a known opening year)
| Opening period | Properties | Rooms | Share | Cumulative | Elevator status |
|---|---|---|---|---|---|
| Up to 1975 | 1,676 | 159,501 | 9.4% | 9.4% | Assumed to have been replaced more than once |
| 1976–1985 | 1,205 | 140,179 | 8.3% | 17.7% | Second replacement cycle |
| 1986–1995 | 2,658 | 265,986 | 15.7% | 33.4% | Past the full-replacement benchmark (25–30 years) |
| 1996–2005 | 1,802 | 223,728 | 13.2% | 46.6% | Entering the replacement window within 10 years |
| 2006–2015 | 2,570 | 325,588 | 19.2% | 65.8% | Time to consider control modernization |
| 2016 onward | 4,240 | 578,994 | 34.2% | 100.0% | Maintenance only for now |
Source: MetroEngines Research & Consulting (N=14,151 properties, 1,693,976 rooms)
Rooms in properties opened in 1995 or earlier total 565,666, or 33.4% of the total. These properties have been open for more than 30 years, so these rooms are in buildings past the full-replacement benchmark. Another 223,728 rooms (13.2%) opened in 1996–2005 will enter the replacement window within the next 10 years. Together, 46.6% of the total, about 790,000 rooms, are “already in the replacement window or about to enter it”.
Multiplying this population by the annual cost per room above (¥4,600 in the mid scenario, 200-room model) puts market-wide annual replacement investment on the order of several billion yen. That is not small as demand for building works, but what matters to each owner is not market size — it is where their own building sits in this distribution.
Note on reading the data: The periods in the table above are based on each property’s opening year. This does not always match the year the building was completed or the elevators were installed. The data include conversions from other uses, rebrand openings without rebuilding and openings in renovated existing buildings, so there are cases where the opening year is recent but the elevators are old, and vice versa. Properties with an unknown opening year and those with fewer than 30 rooms are excluded. Actual replacement plans must be based on each property’s installation year, maintenance records and parts supply status.
Assumptions Behind the Estimates
All figures in this article are built from the assumptions below. Change one assumption and the conclusion changes too.
| Item | Value used | Basis and sensitivity |
|---|---|---|
| Passenger elevators | 1 per 100–200 rooms + 1 for redundancy | Published building services planning benchmarks. Without the redundant car, the 100–150-room models have 2 cars and the annual cost per room falls by about 33% |
| Service elevators | About 1/3 of passenger cars (1 in each model here) | Same as above. Properties with F&B and banquet facilities may have 2 or more |
| Floors | 7 / 11 / 13 / 14 floors | Median by room-count band of 62 planned hotels (MLIT Building Construction Statistics) |
| Area per car per floor | 8–12 m² (hoistway 4–5 m² + lobby share 4–7 m²) | Design allowance based on internal car sizes (11-person 1,400 × 1,350 mm; 15-person 1,600 × 1,500 mm). Varies with bank layout |
| Gross floor area per room | 35.0 m² | Consistent with the per-room unit in our earlier analysis. Using the plan-basis median of 47.7 m² (N=60) cuts room equivalents by about 30% |
| Replacement unit cost | ¥5.0M / ¥8.5M / ¥13.5M (low / mid / high) | Matches published rates for control, partial-removal and full-removal methods. Determined by whether existing hoistway dimensions can be reused |
| Replacement cycle | 30 / 27.5 / 25 years | Set from a parts supply period of 20–25 years and a planned service life of 30 years (BELCA LCC evaluation guidelines) |
| ADR | Business ¥10,500 / City ¥16,300 | Median estimated contracted ADR across six major prefectures (September 2025–August 2026). Estimates; differ from actual contracted prices |
| Room occupancy | Business 75.3% / City 74.1% | Japan Tourism Agency, Overnight Travel Statistics Survey, 2025 annual figures (final) |
| Cap rate | 5.0% | Set as a capitalization benchmark. At 4.0% the value impact rises 25%; at 6.0% it falls 17% |
Conclusion — One Car in the Design Becomes a 30-Year Multiplier
On the pre-opening drawings, the elevator count looks like a choice between “lose 4 rooms or cut waiting time”. But that one car stays on as the multiplier for replacement costs over the next 30 years. A 3-car building carries about ¥25.5M every 30 years, and a 4-car building about ¥34.0M, whatever its size.
For planners and designers, the practical takeaway is to check, when setting the car count, whether the layout allows replacement one car at a time 20–30 years later. A building with a single passenger car keeps upfront costs down, but it will have periods with no passenger car during replacement, and the burden of temporary operations jumps. For buyers, confirming in the engineering report not just the building age but which method is feasible is what separates ¥25.5M from a few million yen. For owners taking over a property, the starting point is to ask the maintenance company when parts supply will end and to put the replacement cost explicitly into the long-term repair plan.
¥2,200–¥16,200 per room per year. Against total capital expenditure of ¥130k–¥620k per room per year, that is only a few percent. Even so, if a property is acquired without a line for it in the cost build-up, it will show up as an unexpected cash outflow around year 30. What defines this cost item is not its size, but whether you can see it coming.
Related Articles
References and Sources
■ Data Sources
Estimated contracted ADR is MetroEngines Research & Consulting’s estimated contracted rate (monthly values for six major prefectures from September 2025 to August 2026 averaged over 12 months for each prefecture, then the median taken; business hotels N=314–924 properties/month, city hotels N=30–109 properties/month). Room occupancy is from the Japan Tourism Agency’s Overnight Travel Statistics Survey, 2025 annual figures (final). Floors and gross floor area are from planned hotels in MLIT’s Building Construction Statistics (hotel-only use; N=62, gross floor area N=60). Opening periods are from our property data (30+ rooms, known opening year; N=14,151 properties, 1,693,976 rooms). Car counts, service levels and replacement costs are based on building services planning materials and published market rates for elevator modernization.
■ Estimation Assumptions
Passenger cars at 1 per 100–200 rooms + 1 for redundancy, plus 1 service car (3 passenger cars for the 300-room model only). Area of 8–12 m² per car per floor; gross floor area of 35.0 m² per room. Replacement unit costs of ¥5.0M / ¥8.5M / ¥13.5M with cycles of 30 / 27.5 / 25 years (low / mid / high). Annual cost per room = cars × unit cost ÷ cycle years ÷ rooms. Value impact = building’s total annual cost ÷ cap rate (base 5.0%, sensitivity 4.0–6.0%). Handling capacity is a simple conversion with a normal average interval of 40 seconds.
■ Limitations
Replacement costs and periods vary widely with existing hoistway dimensions, equipment model and building conditions, and are no substitute for individual quotations. Opening years do not match building completion or elevator installation years (conversions and rebrand openings are included). Estimated contracted ADR is an estimate and differs from actual contracted prices. Room occupancy is a national average by property type, not an individual property’s result. Maintenance contract fees and statutory inspection costs are not included in the annual figures in this article.
■ Market Data
- MetroEngines Research & Consulting — Estimated contracted ADR (six major prefectures, September 2025–August 2026); opening-year distribution from the property master (N=14,151 properties, 1,693,976 rooms)
■ Government Statistics and Public Data
- MLIT, Building Construction Statistics (room count, floors and gross floor area of N=62 planned hotels)
- Japan Tourism Agency, Overnight Travel Statistics Survey, 2025 annual figures (final, published July 6, 2026) (Japanese)
- MLIT Housing Bureau Director-General Notice Kokujushi No. 1071 (exclusion of hoistway floor area from FAR, July 1, 2014) (Japanese)
- Building Standards Act Article 34(2) and Article 52(6); Building Standards Act Enforcement Order Articles 129-13-2 and 129-13-3
■ Building Services Planning and Elevator Technical Materials
- Guidelines for elevator counts in building services planning (hotel passenger and service cars; persons per car in office buildings) (Japanese)
- Elevator manufacturer design document “Elevator General” (service levels by building use: hotels 5-minute handling capacity 8–10% and average interval 40 sec or less; apartments with 2+ cars 60 sec or less) (Japanese)
- Principles of elevator traffic calculation (definitions of average interval and 5-minute handling capacity) (Japanese)
- Internal car dimensions of passenger elevators (9–15 persons) (Japanese)
- Installation standards for emergency elevators (scope, number of cars, 10 m² boarding lobby) (Japanese)
- Scope of hoistway floor area excluded from FAR (boarding lobbies not included) (Japanese)
■ Replacement Costs, Periods and Service Life
- Market rates for elevator modernization (costs by method: control, partial removal, full removal) (Japanese)
- Types, costs and periods of modernization works (Japanese)
- Typical construction periods and downtime for elevator replacement (Japanese)
- Elevator service life and replacement timing (statutory useful life 17 years, parts supply period, BELCA planned service life 30 years) (Japanese)
- Living Amenity Association, Elevator Renewal Guide (Japanese)