

A hotel development schedule is usually drawn as a straight line: land acquisition → design → building permit application → groundbreaking → opening. In practice, though, the schedule often stalls at the very first node of that line: the work of officially establishing where the site actually ends. An adjoining owner will not attend the boundary survey, inheritance registrations have piled up across three generations, a Meiji-era cadastral sketch map bears no resemblance to the ground today. None of this shows up in the land price, but all of it reliably consumes time. And time, as quantified in our previous analysis, generates cost at 5.9% a year.
This article takes the only nationwide dataset that shows “where the site ends” as an area-wide measure — the Ministry of Land, Infrastructure, Transport and Tourism (MLIT) cadastral survey progress data — and matches it at the municipal level against our own hotel opening records and construction plan data. The conclusion up front: hotel development is concentrated precisely where cadastral mapping is least complete.
First, the scope relative to our earlier work. Our analysis of hotel land carry costs (5.9% a year) calculated cost on the premise of a given holding period; this article identifies the causes that lengthen that period and converts them into yen. The real-estate ownership record certificate system, which consolidates ownership records, is about “who owns the land“; this article is about “where the site ends.” Buried cultural properties and soil contamination are procedures dealing with conditions below ground, under different authorities and different statutes. This article deals with the lines drawn on the surface.
Metric Definitions Used in This Article
- Cadastral survey progress rate: the area surveyed under the cadastral surveys conducted by municipalities and others under the National Land Survey Act, divided by the area subject to cadastral survey (total national land area excluding national forests, public waters, etc.). MLIT published figures are cited as-is.
- DID (Densely Inhabited District): areas defined in the national census with a population density of 40 or more persons per hectare and a population of 5,000 or more — in effect, built-up urban areas. The classification referenced here is based on the 2015 Census.
- Parcel boundary (hikkai): the line fixed as delimiting a parcel when the land was registered. It cannot be changed by agreement between owners. The everyday term “boundary” may refer to the extent of ownership rights, which does not always coincide with the parcel boundary.
- Carry (land holding cost): the annual total of holding taxes, financing costs and land management costs incurred while holding vacant or under-preparation development land. Based on our earlier estimate, this article uses 5.9% a year — ¥2.42 million per room over the three years before opening (four-market average, range ¥1.35M–¥3.17M) — as its conversion factor.
- Data sources: MLIT Cadastral Survey website, “National Cadastral Survey Implementation Status” (as of end of FY2025, surveyed June 2026); MLIT “Building Starts and Completions Statistics”; MetroEngines Research & Consulting
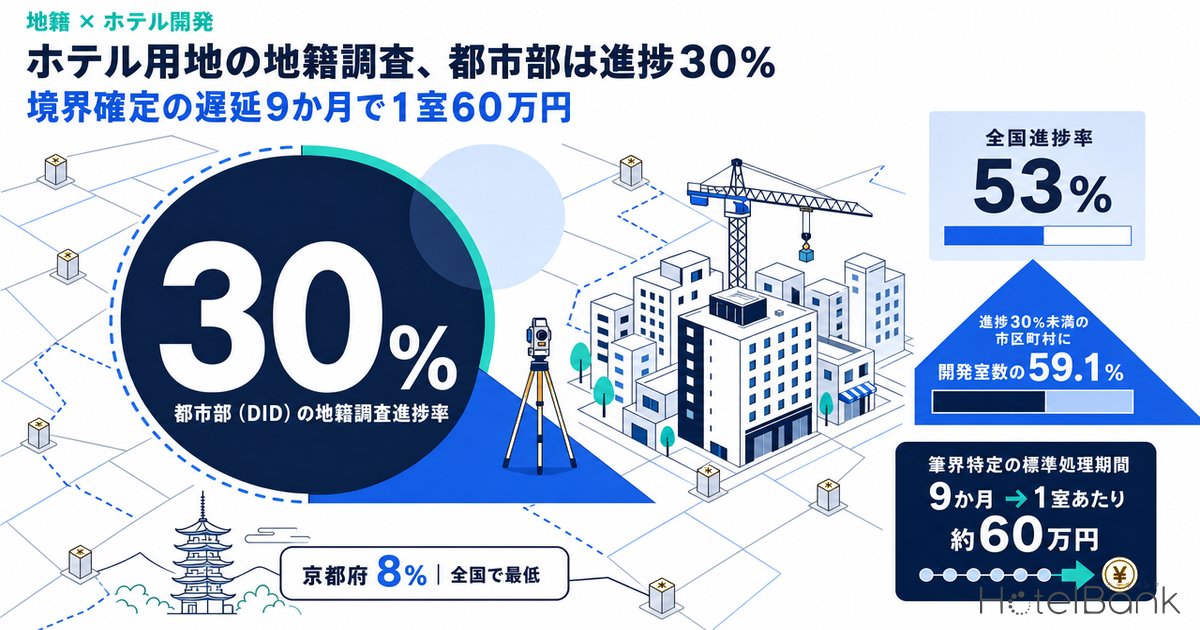
- — 53% nationally, 30% in urban areas — Japan’s cadastral survey is 53% complete nationwide, but only 27% in DIDs (Densely Inhabited Districts), and just 30% even including the Legal Affairs Bureau mapping program (as of end of FY2025).
- — 59.1% of development rooms are located in municipalities where cadastral survey progress is below 30% (openings since 2023 plus construction plans, N=163,773 rooms across 448 municipalities).
- — Kyoto City 1%, Sapporo 3%, Nagoya 7%, Osaka City 12% — the designated cities where development concentrates have the thinnest area-wide parcel boundary coverage; conditions are not uniform nationwide but polarized by location.
- — About ¥600,000 per room for a 9-month delay — taking the standard processing period of the Parcel Boundary Determination System as the delay, a 150-room model carries roughly ¥91 million with no change whatsoever to the building.
- — About 200 years to close the gap — against roughly 8,801 km² of unsurveyed DID land, only about 44 km² is completed each year. Waiting for the government to finish is not a viable option.
Why the 53% National Figure Is Meaningless for Hotel Development
According to the latest tally MLIT published in June 2026 (as of end of FY2025), the national cadastral survey progress rate stands at 53%. Cumulative surveyed area totals 152,838 km² against a target area of 287,966 km², with 594 km² surveyed in FY2025 alone. Restricted to “priority implementation areas” — excluding areas where land transactions are a low priority — progress reaches 81%. On the numbers alone, it reads as though the majority of the work is done, 70 years after the program began.
Break the 53% down by land zone, however, and a structure emerges in which only the places where hotels get built are being left behind. Agricultural land is 71% complete, non-DID residential land 52%, forest land 47%. By contrast, DIDs (Densely Inhabited Districts) stand at just 27%. Even adding the results of the registry-office map preparation work carried out by the Legal Affairs Bureaus, the figure is 30%. Seventy percent of urban land still has no area-wide determination of parcel boundaries.
More important still is the speed at which this is being resolved. In FY2025, cadastral surveys in DIDs covered just 21 km² — only 3.5% of the 594 km² nationwide. Budgets and personnel are flowing to forest land (445 km²), where boundary attendance is easy and area efficiency is high. That is rational from an efficiency standpoint, but from a developer’s perspective, it means the work is not reaching precisely the places where they are looking for sites.
The status of survey commencement is also worth checking. Of Japan’s 1,741 municipalities, 614 (35%) have completed their cadastral survey and 821 (47%) are in progress. On the other hand, 212 (12%) have suspended it and 94 (5%) have not started — together, in roughly one in five municipalities the survey itself is currently not moving. If the municipality where you are evaluating a site falls into that 20%, waiting for the government survey to finish is effectively not an option.
Kyoto 8%, Osaka 10% — The Deeper the Lodging Demand, the Thinner the Cadastre
Line up the published figures by prefecture and the distribution does not cluster around the national average — it splits to the extremes. The highest are Saga (99%), Okinawa (98%) and Aomori (93%). The lowest are Kyoto Prefecture (8%), Osaka Prefecture (10%), Mie (10%) and Shiga (13%), followed by Aichi, Fukui and Nara at 14%, and Kanagawa and Ishikawa at 15%. Tokyo is at 25%.
This ranking is nearly the inverse of the map of lodging demand. Kyoto and Osaka — major inbound destinations and the most active hotel development markets — occupy the bottom two places among the 47 prefectures. Prefectures in Kinki, Chubu, Hokuriku and Kanto sink to the bottom across the board, while Hokkaido, Tohoku and Kyushu line up at the top.
Prefecture-level totals, however, are too coarse for practical decisions. Okinawa is at 98%, but Naha City alone is at 83%. Go down to the published municipal data (N=1,741) and the designated cities stand out even more: Kyoto City 1%, Sapporo 3%, Nagoya 7%, Chiba City 9%, Osaka City 12%. Kobe and Hiroshima follow at 14%, Fukuoka City 22%, Sendai 30%, Yokohama 38% and Kumamoto City 47%. Tokyo’s 23 wards are similar: Shibuya, Arakawa and Adachi at 4%, Koto and Toshima at 5%, Bunkyo and Kita at 7%, Minato at 8% — and even the highest, Sumida, only reaches 50%.
A site located in the central wards of a designated city is a strength in terms of asset value, but on the single criterion of how easily parcel boundaries can be determined, it is the most unfavorable condition there is. The higher the land price, the smaller each parcel, the more rights holders there are, and the more past subdivisions and consolidations have accumulated. The Ministry of Justice itself states plainly, in its description of the Legal Affairs Bureau mapping program, that “for reasons such as high land prices, map preparation in the core districts of major cities and in regional hub cities has not progressed.”
59.1% of Development Rooms Sit in Municipalities Below 30% Progress
We now turn to matching against our own data. We combined properties with 30 or more rooms opened since 2023 with construction plans still due for completion under MLIT’s “Building Starts and Completions Statistics,” and took as the population the 163,773 rooms across 448 municipalities whose municipality could be identified from the address. We then stratified these by each municipality’s cadastral survey progress rate.
The result is clear. Municipalities with progress below 30% account for only 632 (36.3%) of the 1,741 nationwide, yet 59.1% of development rooms are concentrated there. Narrowing to below 20%, the share is still 50.8% — exactly half of the rooms under development or newly opened are located in municipalities where not even one-fifth of the area-wide parcel boundary work is done. Conversely, municipalities at 90% or higher are the largest block by count (32.3%), yet account for only 11.0% of rooms.
The room-weighted average cadastral survey progress rate is 33.8% on an opening basis and 34.5% on a construction-plan basis — far below not only the 53% national average but also the 52% municipal median. The center of gravity of hotel development sits in places with a cadastre nearly 20 points thinner than the national average.
Narrowing to the top 20 municipalities by development volume, the trend is even stronger. The room-weighted progress rate across the top 20’s combined 72,762 rooms is 23.5%. Thirteen of the 20 are below 30%, and those 13 account for 77.2% of the top-20 room total.
| # | Municipality | Rooms opened 2023– | Planned rooms | Total | Cadastral survey progress |
|---|---|---|---|---|---|
| 1 | Osaka City, Osaka | 14,898 | 5,783 | 20,681 | 12% |
| 2 | Sapporo, Hokkaido | 4,011 | 2,978 | 6,989 | 3% |
| 3 | Hiroshima City, Hiroshima | 1,626 | 3,860 | 5,486 | 14% |
| 4 | Yokohama, Kanagawa | 2,952 | 546 | 3,498 | 38% |
| 5 | Taito Ward, Tokyo | 3,216 | 154 | 3,370 | 20% |
| 6 | Chuo Ward, Tokyo | 2,504 | 836 | 3,340 | 16% |
| 7 | Fukuoka City, Fukuoka | 1,835 | 1,130 | 2,965 | 22% |
| 8 | Miyakojima, Okinawa | 903 | 1,902 | 2,805 | 100% |
| 9 | Minato Ward, Tokyo | 1,811 | 982 | 2,793 | 8% |
| 10 | Naha, Okinawa | 2,244 | 429 | 2,673 | 83% |
| 11 | Urayasu, Chiba | 2,291 | 0 | 2,291 | 55% |
| 12 | Nagoya, Aichi | 1,719 | 526 | 2,245 | 7% |
| 13 | Sendai, Miyagi | 1,369 | 863 | 2,232 | 30% |
| 14 | Kobe, Hyogo | 606 | 1,551 | 2,157 | 14% |
| 15 | Chiyoda Ward, Tokyo | 760 | 943 | 1,703 | 13% |
| 16 | Chiba City, Chiba | 617 | 1,000 | 1,617 | 9% |
| 17 | Kutchan, Hokkaido | 558 | 1,036 | 1,594 | 80% |
| 18 | Kumamoto City, Kumamoto | 946 | 555 | 1,501 | 47% |
| 19 | Ota Ward, Tokyo | 870 | 543 | 1,413 | 12% |
| 20 | Hakodate, Hokkaido | 931 | 478 | 1,409 | 19% |
What stands out in this table is that the largest market, Osaka City (20,681 rooms), is at 12%, and the second-largest, Sapporo (6,989 rooms), is at 3%. Both rank near the top nationally for both supply over the past three years and the pipeline ahead, yet area-wide parcel boundary mapping has barely progressed in either. On the other hand, there certainly are areas where development is active and the cadastre is well established — Miyakojima at 100%, Naha 83%, Kutchan 80%, Urayasu 55%. The problem is not uniform nationwide; conditions are polarized by location.
Note that at the prefecture level, the rank correlation between cadastral progress and development rooms is a weak −0.17 (MetroEngines Research & Consulting; rank correlation across 47 prefectures). This is driven by prefectures such as Okinawa, where progress is 98% and development is also brisk. The relationship shows up not at the prefecture level but at the municipal level — more precisely, at the level of built-up urban areas (DIDs). This is why looking at prefecture-level statistics when evaluating a site tells you nothing.
The Price of Time — A 9-Month Delay Costs About ¥600,000 per Room
So far we have covered “where the cadastre is thin.” Next, we convert how much that thinness adds to a business plan.
When developing land that has not been through a cadastral survey, the developer must carry out a boundary confirmation survey at its own expense and obtain attendance and confirmation from every adjoining landowner and from the road administrator. If this goes smoothly it takes roughly two to four months, but a single complication — some rights holders refusing to cooperate, a large number of heirs, owners whose whereabouts are unknown — puts the process beyond the developer’s own control.
The public procedure available beyond that point is the Legal Affairs Bureau’s Parcel Boundary Determination System (hikkai tokutei seido). An application is filed, typically by a land and house investigator acting as agent, and a parcel boundary determination registrar fixes the location of the boundary based on the opinion of a boundary survey commissioner. The system is faster and cheaper than litigation, but the bureaus publish standard processing periods of nine months at the Tokyo and Nagoya Legal Affairs Bureaus and six months at the Hiroshima Legal Affairs Bureau. They also state explicitly that cases involving many parties or complex facts may exceed the standard period. In addition, survey costs are borne by the applicant; the Tokyo Legal Affairs Bureau says they are “in many cases roughly between ¥500,000 and ¥800,000.” If the matter is still not settled, it proceeds to a boundary determination lawsuit, and the timeline extends further.
| Procedure | Authority | Published duration | Cost burden | Practical role |
|---|---|---|---|---|
| Boundary confirmation survey | Land and house investigator (private) | Typically 2–4 months | Developer | Already built into schedules; assumes neighbors cooperate |
| Parcel Boundary Determination System | Legal Affairs Bureaus and District Legal Affairs Bureaus | Standard processing period 6–9 months (varies by bureau) | Applicant Survey cost roughly ¥500k–¥800k | Public remedy when boundary attendance cannot be obtained |
| Boundary determination lawsuit | Courts | Can be prolonged depending on the case | Parties | Last resort, e.g. when a party contests the determination |
| Cadastral survey | Municipalities, etc. | Depends on the municipality’s program | Public funds | Developers cannot choose when it starts |
Converting the land carry factor from our earlier estimate — 5.9% a year, ¥2.42 million per room over the three years before opening — into a monthly figure gives ¥67,000 per room per month. Across the four-market range it is ¥38,000–¥88,000 a month. Multiplying this directly by the number of months of delay gives the amount that boundary problems add to a business plan.
| Months of delay | Per room (low) | Per room (4-market avg.) | Per room (high) | 150-room model (avg.) |
|---|---|---|---|---|
| +3 months (attendance difficulties) | ¥112,000 | ¥202,000 | ¥264,000 | approx. ¥30M |
| +6 months (boundary determination, short) | ¥225,000 | ¥403,000 | ¥528,000 | approx. ¥60M |
| +9 months (boundary determination, standard) | ¥338,000 | ¥605,000 | ¥792,000 | approx. ¥91M |
| +12 months | ¥450,000 | ¥807,000 | ¥1,057,000 | approx. ¥120M |
| +24 months (prolonged, incl. litigation) | ¥900,000 | ¥1,613,000 | ¥2,113,000 | approx. ¥240M |
Applying the nine-month standard processing period of the Parcel Boundary Determination System gives about ¥600,000 per room. For a 150-room hotel, roughly ¥91 million lands on the plan without any change whatsoever to the building. Under the high-market assumption, a 150-room hotel reaches about ¥120 million. This is not a design change or construction cost inflation; it is an amount incurred purely because the line with the neighboring land cannot be settled.
Crucially, this amount is not reflected in price negotiations at acquisition. The acquisition price is set by area and unit price; how many months it will take to fix that area is not included in the price. Time alone stays with the developer without ever being passed through into the cost basis.
About 8,800 km² of DID Land Remains — 200 Years at the Current Pace
So is waiting for government mapping to catch up a viable option? Let us check the numbers.
The DID area subject to cadastral survey is 12,673 km². Progress to date is 3,456 km² from cadastral surveys, or 3,872 km² including the Legal Affairs Bureau mapping program. That leaves about 8,801 km². Against this, the annual pace is 21 km² from DID cadastral surveys (FY2025 actual), plus the Ministry of Justice’s new mapping plan starting in FY2025 — 200 km² over ten years for the disaster-prevention and urban-development track and 30 km² over ten years for the major-city track, or 23 km² a year combined. Even adding the two together gives 44 km² a year.
Simple division gives about 200 years — or about 440 years counting cadastral surveys alone. This is not a figure meant to fault the system; it is a figure confirming that, as a premise for a developer’s decisions, “waiting” is not an option. As long as you source land in built-up urban areas, determining parcel boundaries has to be treated as an item handled at your own expense, by your own effort, and on your own schedule.
Three Practical Measures That Work
That said, things are also moving in the right direction. On June 28, 2024, a ministerial ordinance amending the Cadastral Survey Work Rules Standards was promulgated and took effect, creating a deemed boundary confirmation system. If landowners do not respond after multiple notices of field surveys and the like, a draft parcel boundary can be sent by registered mail or similar means, and if no objection is raised within 20 days of delivery, confirmation is deemed to have been given and the survey can proceed (MLIT press release, “Introducing a Deemed Land Boundary Confirmation System,” June 27, 2024). At the same time, the area where aerial survey methods using remote sensing data can be applied was expanded to the surroundings of agricultural land (accuracy class Otsu-1 areas).
The system applies only to the “non-response” category; it does not cover parties who actively refuse to attend, or cases where delivery of the notice itself cannot be confirmed. It is also used by the municipalities and other bodies conducting cadastral surveys, not directly in private boundary confirmation surveys. Even so, it will rescue some of the cases in which, previously, the registration information would have been updated as “boundary undetermined” (hikkai mitei), dragging in surrounding land, blocking subdivision and making the land effectively untradeable.
1. Check First Whether the Land Is “Boundary Undetermined”
Land where boundary attendance could not be obtained in a past cadastral survey may be registered as “boundary undetermined.” In that state subdivision is impossible, and assembling it as a development site stalls entirely. Even in areas where the cadastral survey is complete, this is no guarantee — you need to check the content of the survey results.
2. Bring Progress Rates Into Location Decisions
MLIT publishes municipal progress rates as a list, which can be used for initial site screening. In areas below 30% progress, build a generous allowance for boundary determination into the schedule, and present the investment committee with a sensitivity analysis that factors in carry of ¥67,000 per room per month.
3. Write the Seller’s Boundary Obligation Into the Contract
Whether boundary determination is a condition of the seller’s delivery, or is done at the buyer’s expense with price adjustment or termination rights if it overruns, decides who bears the time risk. For urban sites, this clause carries economic value equivalent to several percent of the land unit price.
Conclusion — Manage Boundaries as a Schedule Item, Not a Cost Item
The 53% national cadastral survey progress rate does not apply on the ground in hotel development. In built-up urban areas (DIDs) it is 27%, or 30% including the Legal Affairs Bureau program, with levels such as Kyoto City 1%, Sapporo 3%, Nagoya 7% and Osaka City 12%. And matched against our data, 59.1% of the 163,773 rooms from the past three years’ openings and the pipeline ahead are located in municipalities with cadastral survey progress below 30%. Hotel development is advancing in exactly the places where the cadastre is thinnest.
Setting boundaries alongside other procedures that consume the same “land time” clarifies their position. In our earlier analyses, buried cultural properties led to excavation orders for 8.2% of notifications, and soil contamination to 661 area designations a year — both are risks of the type “heavy if it applies, but whether it applies depends on the project.” Boundary determination differs in nature: as a process involving attendance and confirmation with neighbors, it is something you go through every single time you acquire land. With 70% of urban land lacking area-wide parcel boundary determination, it fits reality better to set months and yen for it in advance as a standard schedule item, rather than treating it as a low-probability contingent risk.
This condition cannot be changed. Working back from the government’s mapping pace, clearing the DID backlog will take about 200 years, and waiting is effectively not an option. On the other hand, the amount that boundary uncertainty adds to a business plan can be calculated. Treating the nine-month standard processing period of the Parcel Boundary Determination System as the delay gives about ¥600,000 per room, or about ¥91 million for 150 rooms. It does not show up in the land price, but it is a cost that will certainly be incurred.
Put “ease of parcel boundary determination” on the land-sourcing evaluation axis alongside price, floor area ratio (FAR) and zoning. The FAR side has a pitfall of the same nature — as we verified in an earlier analysis, the width of the frontage road can effectively cut a 600% designated FAR to 240% on a 4m road. Use municipal progress rates for initial screening, give the schedule spare months in areas with thin progress, multiply those spare months by the carry factor, and put the result into the investment committee’s sensitivity analysis. It matches reality better to manage boundaries as a construction-schedule problem rather than as an acquisition-cost problem.
References and Sources
■ Data sources
We used progress rates by land zone, prefecture and municipality (N=1,741) from the MLIT Cadastral Survey website, “National Cadastral Survey Implementation Status” (as of end of FY2025, surveyed June 2026); MLIT “Building Starts and Completions Statistics” (construction plans with scheduled completion dates after the survey date); published materials of the Ministry of Justice and the Tokyo, Nagoya and Hiroshima Legal Affairs Bureaus; and MetroEngines Research & Consulting opening data (based on confirmed OTA listings, openings from January 2023 onward, 30+ rooms). Properties and plans whose municipality could be identified from the address were joined by municipality code (N=163,773 rooms, 448 municipalities).
■ Estimation assumptions
Land carry prorates on a monthly basis our earlier estimate “Hotel land carry cost of 5.9% a year,” covering four markets and 243 commercial-land benchmark points (¥2.42M per room over three years before opening; low ¥1.35M, high ¥3.17M), giving ¥67,000 per room per month (low ¥38,000, high ¥88,000), multiplied linearly by the months of delay. Months of delay use the standard processing periods for parcel boundary determination published by each Legal Affairs Bureau (6–9 months) as a guide, with sensitivity taken at five levels: 3, 6, 9, 12 and 24 months. The 150-room model is a simple product of the four-market average times 150 and does not reflect changes in construction costs or interest rates.
■ Limitations and caveats
Cadastral survey progress rates are area-based ratios and do not indicate whether parcel boundaries have been determined for any individual site. The join with development rooms is limited to properties whose municipality could be identified from the address; properties and plans that could not be identified are excluded from the population. Construction plans are based on permit applications, so planned room counts will rise as further applications are filed. The carry factor is a four-market average; actual amounts rise or fall with each project’s land price, financing cost and holding period. The prefecture-level rank correlation (−0.17) indicates only the strength of correlation and does not imply causation.
■ Market data
- MetroEngines Research & Consulting — municipal tally of lodging facilities opened since 2023 (based on confirmed OTA listings, 30+ rooms) and construction plans (N=163,773 rooms, 448 municipalities); land carry estimate (four markets, 243 commercial-land benchmark points)
■ Government statistics and public data
- MLIT Cadastral Survey website, “National Cadastral Survey Implementation Status” (as of end of FY2025, surveyed June 2026) — progress rates by land zone, by prefecture, municipal progress list, commencement status (Japanese)
- MLIT Cadastral Survey website, “Current Status of Registry Office Maps” (Japanese)
- MLIT Cadastral Survey website, “Creation of the Deemed Land Boundary Confirmation System (Handling Non-Responding Landowners)” (Japanese)
- MLIT press release, “Introducing a Deemed Land Boundary Confirmation System” (June 27, 2024) (Japanese)
- MLIT “Building Starts and Completions Statistics” — construction plans including lodging facilities (with scheduled completion dates after the survey date)
■ Ministry of Justice and Legal Affairs Bureaus
- Ministry of Justice, “Parcel Boundary Determination System” (Japanese)
- Ministry of Justice, “Promoting the Legal Affairs Bureau Mapping Program” (updated April 2026) — disaster-prevention and urban-development track 200 km² over 10 years; major-city track 30 km² over 10 years (Japanese)
- Tokyo Legal Affairs Bureau, “FAQ on the Parcel Boundary Determination System” — standard processing period 9 months; survey cost guideline (Japanese)
- Nagoya Legal Affairs Bureau, “Parcel Boundary Determination System” — standard processing period 9 months (Japanese)
- Hiroshima Legal Affairs Bureau, “About the Parcel Boundary Determination System” — standard processing period 6 months (Japanese)
HotelBank Editorial Team / MetroEngines Research. This article is an English translation of a Japanese article originally published on hotelbank.jp.