

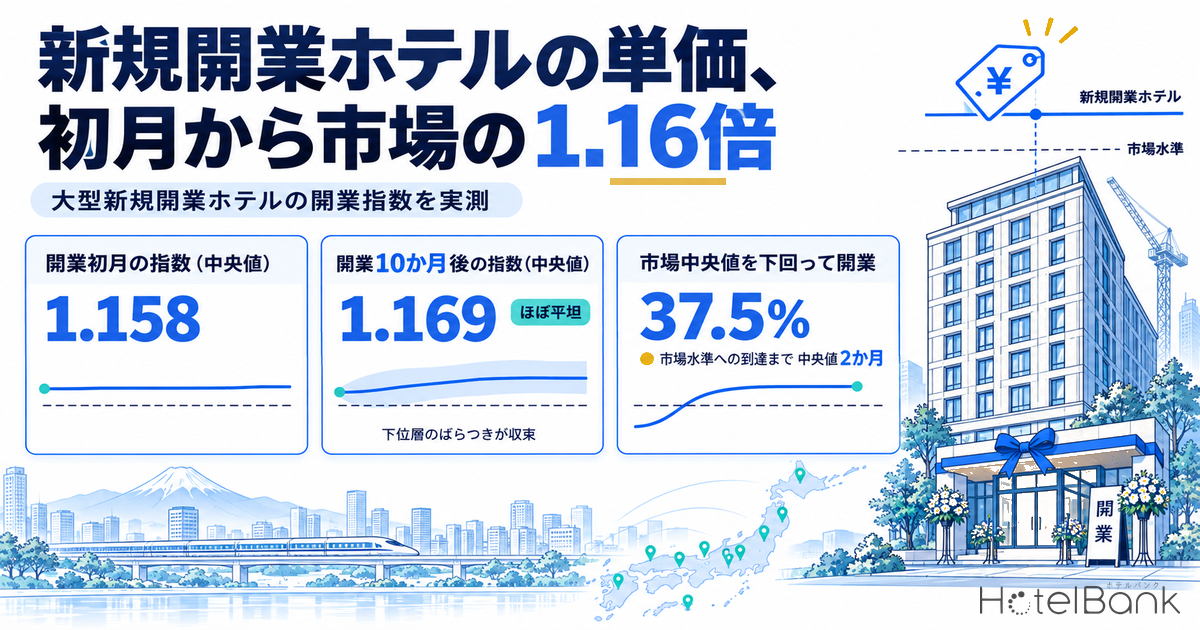
A newly opened hotel sells cheap for a while to build awareness, then raises its rates up to the market level — in both hotel development and hotel investment, this “ramp-up period” has long been treated as a given. Yet few people have ever seen that assumption measured. In this article we tracked up to 17 months of estimated settled ADR, from the opening month onward, for 137 hotels with 100+ rooms that opened in Japan in 2025, and quantified the ramp-up as an “Opening Index”: each hotel’s ADR divided by the market median for the same prefecture and the same hotel type. The short answer: the median index is already 1.16x in the opening month, and it barely moves over the following 12 months. What changed during the ramp-up was not the level but the spread between hotels.
- Of the 137 hotels with 100+ rooms that opened in 2025 (25,524 rooms), we calculated the “Opening Index” for the 127 whose estimated settled ADR could be tracked. The median index was 1.158 in the opening month and still 1.169 ten months later — essentially flat across 12 months.
- Comparing months 0–2 with months 9–12 within the same hotel, the median change in the index was 0.98x (N=105 hotels). Relative price position did not rise over time.
- What moved was the lower quartile. The first quartile was 0.886 in the opening month and rose to 0.988 ten months later. The upper quartile barely moved (1.47→1.51), so the spread converged from the bottom up.
- 42 of 112 hotels (37.5%) started below the market median in their opening month. Of those, 24 reached 1.0 within the observation period, taking a median of 2 months to get there.
- Among business hotels, the index in Japan’s three major metropolitan areas eased slightly from 1.15 to 1.10, while regional markets held at 1.21→1.22. On a same-hotel basis the gap persisted: 0.95 in the major metros vs. 1.01 in regional markets (N=33 / 50).
- Because the index divides by the same month’s market median, calendar seasonality is removed. Indeed, over the 11 months from October 2025 to August 2026, when the panel is complete, the median index stayed within a 1.104–1.189 range.
Metric Definitions Used in This Article
- ADR (Average Daily Rate): An estimated settled rate (tax-exclusive equivalent), calculated by applying a hotel-type-specific adjustment factor to the lowest-plan price each hotel publishes on OTAs and elsewhere (2 guests per room, per-room rate, tax included). Checked against property-level results disclosed by listed hotel REITs (91 hotels, most recent 3 months), the median error is about 7%. These are estimates and differ from each hotel’s actual transaction prices and accounting figures. Area-level ADR is the median of the hotels covered (the level of a typical hotel in the area).
- Opening Index: A hotel’s ADR in a given month divided by the market median ADR for the same month, same prefecture and same hotel type. 1.00 = on par with a typical hotel of that type in that prefecture; 1.20 = positioned 20% above the market median.
- Months since opening: The number of months counted from the opening month, which is month 0. Opening Index values are aligned and compared by months since opening, not by calendar month.
- Data source: MetroEngines Research
Study Design — Measuring the Ramp-Up as “Distance from the Market”
Looking at the ramp-up simply as “ADR trend since opening” almost always goes wrong. Japanese lodging demand is strongly seasonal, so a hotel that opens in April and one that opens in October face completely different demand three months in. If a hotel that opened in July sees its ADR fall after three months, that may not be a failed ramp-up at all — it may simply reflect the October lull.
So in this article we converted each hotel’s monthly ADR into an index by dividing it by the market median ADR for the same month, same prefecture and same hotel type. Because numerator and denominator look at the same month, calendar seasonality cancels out in the division. What remains is only “where the hotel stands in its market” and how that position moves with months since opening.
The population is the 137 hotels with 100+ rooms (25,524 rooms in total) among the 2025 openings tracked by MetroEngines Research & Consulting. Across all of 2025 there were 1,761 openings averaging 24 rooms, most of them small properties such as vacation rentals and guesthouses, so we drew the line at 100 rooms as a size that holds up against market-level comparison. Of these, the index is calculated for the 127 hotels (23,893 rooms) that belong to hotel types validated for estimated settled ADR (business, city, resort, ryokan, capsule) and whose market-side denominator had enough hotels.
| Hotel type | Hotels opened | Rooms | Covered by index | Rooms covered |
|---|---|---|---|---|
| Business hotel | 96 | 17,300 | 96 | 17,300 |
| City hotel | 19 | 4,723 | 19 | 4,723 |
| Resort hotel | 8 | 1,378 | 8 | 1,378 |
| Deluxe hotel | 6 | 917 | — | — |
| Ryokan | 3 | 342 | 3 | 342 |
| Capsule / other | 5 | 864 | 1 | 150 |
| Total | 137 | 25,524 | 127 | 23,893 |
Source: MetroEngines Research & Consulting (based on confirmed OTA listings, N=137 hotels)
The Ramp-Up Curve Was Surprisingly Flat
First, the big picture. The chart below plots the median and quartiles of the index by months since opening, limited to the 97 hotels with data for at least 11 of months 0–12.
Source: MetroEngines Research; compiled by HotelBank Editorial Team (N=97 hotels; 94–97 valid per month)
The median line starts at 1.158 in the opening month and is still 1.169 ten months later. Even at its lowest point, month 7, it is 1.122 — a swing of only about 5 points. A separate HotelBank analysis that tracked 2026 rates for 385 hotels from the 2025 opening cohort likewise found the opening premium building from right after opening, consistent with the flat curve here. The “start low, then raise” picture of the ramp-up was not observed in price position — at least for new openings with 100+ rooms.
We checked the same thing at the hotel level. Comparing the average index for months 0–2 with the average for months 9–12 within the same hotel, the median ratio was 0.98x (N=105 hotels). The index rose at 48.6% of hotels and fell at 51.4% — roughly half and half. In other words, there is no overall force pushing relative position upward.
The quartiles, however, behave differently from the median. The first quartile rose about 10 points, from 0.886 in the opening month to 0.988 at month 10. The third quartile was roughly flat at 1.467→1.507. The top of the band stays put while only the bottom closes in. The reading most faithful to the data is that a new hotel’s ramp-up is not a rise in level but a process in which the spread among the lower tier converges.
| Months since opening | 1st quartile | Median | 3rd quartile | IQR | N |
|---|---|---|---|---|---|
| 0 (opening month) | 0.886 | 1.158 | 1.467 | 0.581 | 94 |
| 3 | 0.956 | 1.174 | 1.559 | 0.603 | 97 |
| 6 | 0.951 | 1.139 | 1.442 | 0.491 | 97 |
| 10 | 0.988 | 1.169 | 1.507 | 0.519 | 97 |
| 12 (reference) | 1.009 | 1.217 | 1.507 | 0.498 | 76 |
Source: MetroEngines Research; compiled by HotelBank Editorial Team. Note: at month 12 only hotels that opened in the first half of 2025 remain, so N shrinks to 76 and the composition changes.
By Hotel Type — Business Around 1.15, City at 1.34–1.52
Split by hotel type, the levels themselves differ sharply. The index for business hotels (N=75) moves within a 1.12–1.18 range through month 10 — a nearly straight line for the median. City hotels (N=16) start at 1.34 and fluctuate between 1.43 and 1.52, always staying above business hotels.
Source: MetroEngines Research; compiled by HotelBank Editorial Team (business N=75, city N=16)
Note that a high index for city hotels does not mean “city hotels ramp up faster.” The denominator is the median of all city hotels in the same prefecture, which includes existing stock that opened 20 or 30 years ago. A newly built or newly branded hotel beating the median of older inventory should be read less as a ramp-up and more as a straightforward difference in product grade. City hotels are a segment with large grade differences between properties to begin with, so their index tends to come out higher.
Resort hotels (8 covered by the index, 5 in the 12-month panel) and ryokan (3) have too few samples to draw a median curve. We draw no firm conclusions for these two types and treat their figures as reference values only.
Major Metros vs. Regional Markets — What Diverged Was the Slope, Not the Level
Next, we split business hotels — the type with the largest sample — into the three major metropolitan areas (Tokyo, Kanagawa, Chiba, Saitama, Aichi, Osaka, Kyoto, Hyogo, Nara) and regional markets. Of the 96 openings, 40 were in the major metros and 56 in regional markets.
Source: MetroEngines Research; compiled by HotelBank Editorial Team (major metros N=28–31, regional N=44)
The opening-month index was 1.153 in the major metros and 1.211 in regional markets, so regional openings start from a higher position. By month 10 it was 1.099 in the major metros and 1.220 regionally — the gap actually widened. On a same-hotel basis the direction also splits: a median 0.95x in the major metros (N=33) versus 1.01x regionally (N=50).
The difference can probably be explained by the denominator. In the major metros, new openings keep piling up, pushing the market median itself upward. A newly opened hotel is chased by the next opening from day one, and holding its relative position requires continual rate increases. In regional markets, by contrast, competing new supply rarely enters the same prefecture, so the relative position established at opening tends to hold. Put differently, regional openings operate in a market environment where they can enjoy their initial position for longer.
How Much of Opening-Month Seasonality Does the Index Remove?
New openings are unevenly spread across the calendar. Among these 137 hotels, July and October had 21 each, April 18 and December 14 — those four months alone account for 54.0% of the total. If the ramp-up looked different depending on whether a hotel opened at a demand peak or trough, comparing the index would not hold up at all.
So for the period where the panel is complete, we lined up the median index by calendar month instead of months since opening. Over the 11 months from October 2025 to August 2026, the sample is essentially fixed at the same 97 hotels.
Source: MetroEngines Research; compiled by HotelBank Editorial Team (N=94–97 hotels, same panel)
The low was 1.104 in January 2026 and the high 1.189 in July 2026. Even spanning the January off-season and the July–August peak, the index stays within an 8.5-point band. Market ADR swung widely over the same period, but new hotels’ ADR moved in almost the same proportion, so the index barely moves. In other words, new hotels price by copying market seasonality as-is, rather than moving independently to smooth it out. Conversely, this confirms that the index comparison by months since opening used here is not contaminated by calendar seasonality.
Cohort differences by opening month do remain, however. Taking each hotel’s average index for months 0–5 and lining up the medians by opening month gives the following.
Source: MetroEngines Research; compiled by HotelBank Editorial Team. Note: hover over each bar to see the number of hotels for that month.
December openings (N=14) are highest at 1.359 and January openings (N=6) lowest at 0.808. But January, February, May and June are all thin at N=4–6, so the differences more likely reflect composition — which grade of hotel happened to open in which month — than seasonal factors. Since the index already strips out seasonality by dividing by the same month’s market, reading the remaining differences as “advantages or disadvantages of the opening month” would be going too far. Discussing opening-month tendencies would require stacking several years of cohorts.
What Happened to the 37.5% That Started Below the Market?
A flat median does not mean every hotel starts above the market. Of the 112 hotels with an opening-month index, 42 (37.5%) started below 1.00. Tracking whether those 42 reached 1.00 within the observation period gives the following distribution.
| Months to reach 1.00 | Hotels | Share |
|---|---|---|
| 1 month | 9 | 21.4% |
| 2 months | 4 | 9.5% |
| 3 months | 4 | 9.5% |
| 4–6 months | 4 | 9.5% |
| 7–12 months | 3 | 7.1% |
| Not reached within observation period | 18 | 42.9% |
| Total | 42 | 100% |
Source: MetroEngines Research; compiled by HotelBank Editorial Team (42 hotels that opened below 1.00, out of 112 with an opening-month index)
For the 24 hotels that got there, the median time to reach 1.00 was 2 months. Catching up from a slow start ends in less than a quarter, not in years. The same 2-month median recovery was also observed in a separate HotelBank study that tracked rate recovery across 182 new hotels. The remaining 18 hotels were still below 1.00 at the end of the observation period, but that does not mean they “never get there.” These 18 include hotels that opened in the second half of 2025 with only a few months of data, and for a product deliberately designed to sit below the market median — a model that earns through occupancy and turnover rather than room rate — an index of 1.00 is not the goal in the first place. The index describes a position; it is not a target to hit, and it should not be misread as one.
Hotels Whose Index Rose the Most
Now to individual hotels. For the 105 hotels with both windows available, the ratio of the average index in months 9–12 to that in months 0–2 has a median of 0.98x, a bottom decile of 0.74x, a top decile of 1.32x and a maximum of 1.68x. 14 hotels (13.3%) rose by 1.25x or more and 13 (12.4%) eased to 0.80x or less, so roughly one in ten hotels moves sharply in each direction. The table below is a selection of six from the side that rose most — it is not a ranking (some hotels with higher ratios are not listed). All have 100+ rooms, opened in 2025, and have been observed through month 9 or later.
| Hotel | Rooms | Location | Opened | Months 0–2 | Months 9–12 | Ratio |
|---|---|---|---|---|---|---|
| THE GATE HOTEL Fukuoka by HULIC (ザ・ゲートホテル福岡 by HULIC) | 171 | Fukuoka | Apr 24, 2025 | 1.51 | 2.54 | 1.68x |
| KOKO HOTEL Osaka Namba Sennichimae (KOKO HOTEL 大阪なんば 千日前) | 320 | Osaka | May 29, 2025 | 1.30 | 1.98 | 1.52x |
| Hotel Enoe Toyama (ホテルエノエ富山) | 227 | Toyama | Aug 29, 2025 | 1.00 | 1.43 | 1.43x |
| Quintessa Hotel Akita (クインテッサホテル秋田) | 113 | Akita | Oct 1, 2025 | 1.01 | 1.42 | 1.40x |
| Quintessa Hotel Hiroshima Kanayamacho (クインテッサホテル広島銀山町) | 156 | Hiroshima | Aug 16, 2025 | 1.13 | 1.53 | 1.35x |
| Hotel Route-Inn Grand Misawa -EAST COURT- (ホテルルートインGrand三沢 -EAST COURT-) | 259 | Aomori | Aug 20, 2025 | 1.07 | 1.35 | 1.26x |
Source: MetroEngines Research; compiled by HotelBank Editorial Team. Note: “Months 0–2” and “Months 9–12” are the average index over the months available in each window; the ratio is between the two. For hotels observed beyond month 12, the comparison window is still fixed at months 9–12. Opening dates are based on each company’s announcements.
What these six have in common is that their index right after opening started “near the market median,” at 1.0–1.5. Rather than targeting a standout price band from day one, they launched close to the market and raised their relative position once occupancy and reviews had built up. THE GATE HOTEL Fukuoka by HULIC opened with 171 rooms inside HULIC SQUARE FUKUOKA TENJIN, a complex directly connected to Tenjin Station, with its lobby and all-day dining on the top (19th) floor — a property strong on both location and product. KOKO HOTEL Osaka Namba Sennichimae spreads its 320 rooms across a main tower and a residence tower, with a room mix that includes 28.8㎡ and 49.5㎡ residence-type rooms. A wider range of room types gives more options for which type to push on high-demand days, making it easier to move the rate.
Note that Hotel Enoe Toyama (Aug 29, 2025) and Quintessa Hotel Akita (Oct 1, 2025) are both rebrands of existing properties. The population in this article is “hotels recorded as opening in 2025,” which includes rebrands and conversions as well as new builds. A rebrand that inherits an existing building and existing guest reviews tends to start closer to the market in its first month than a from-scratch new build — one of the reasons the index starts at around 1.0 or higher from the opening month.
Large Openings That Started From a High Price Position
Conversely, some hotels launched well above the market median from their very first month. Below are large openings with a high average index over months 0–11.
| Hotel | Rooms | Location | Opened | Opening-month index | Average index |
|---|---|---|---|---|---|
| Hotel Granvia Hiroshima South Gate (ホテルグランヴィア広島サウスゲート) | 380 | Hiroshima | Mar 24, 2025 | 4.03 | 3.28 |
| Maihama View Hotel by HULIC (舞浜ビューホテル by HULIC) | 428 | Chiba | Oct 1, 2025 | 3.91 | 3.17 |
| Holiday Inn & Suites Sapporo Odori Park (ホリデイ・イン&スイーツ札幌大通公園) | 195 | Hokkaido | Oct 2025 | 2.44 | 2.66 |
| Sapporo Hotel by Granbell (札幌ホテル by グランベル) | 605 | Hokkaido | Mar 1, 2025 | 2.07 | 2.16 |
| Hotel Hankyu Gran Respire Osaka (ホテル阪急グランレスパイア大阪) | 482 | Osaka | Mar 21, 2025 | 2.60 | 1.98 |
Source: MetroEngines Research; compiled by HotelBank Editorial Team. Note: average index is the mean over months 0–11. Opening dates are based on each company’s announcements.
This table should not be read as a ranking of ramp-up performance. A high index is the distance from the median for the hotel’s prefecture and type, and it directly includes differences in product grade. Hotel Granvia Hiroshima South Gate opened directly above the Hiroshima Station building with 380 rooms averaging 26㎡, operating as a two-building complex of 787 rooms together with the existing Hotel Granvia Hiroshima — yet its denominator is the Hiroshima Prefecture median for lodging-focused hotels. Maihama View Hotel by HULIC is a Tokyo Disney Resort Official Hotel, rebranded on October 1, 2025 from the former Tokyo Bay Maihama Hotel, with 428 rooms mostly of 32㎡ and 35㎡. That such hotels run at around 3x the prefectural median reflects not performance but the fact that they are products in a different price band to begin with.
The fact that the index reflects grade differences is even clearer in an extreme case. Waldorf Astoria Osaka (252 rooms), which opened in April 2025 as the brand’s first property in Japan, runs at around 8x the Osaka Prefecture city-hotel median. That number says nothing about ramp-up speed; it shows that products an order of magnitude apart in price coexist within the same “city hotel” category. Hotel type is a coarse proxy for product grade, and this limitation should always be stated alongside the index. For the entry positions of upcoming projects, a separate HotelBank analysis of 17 hotels opening between October 2026 and January 2027 found entry ADRs spanning 0.6x to 4.3x the area median.
Does the Conclusion Depend on How the Data Are Cut?
The figures so far rest on two discretionary cut-offs. One is the panel condition — how many of months 0–12 a hotel needs data for to enter the median curve. The other is the denominator guard — where to drop months in which the sample used to compute the market median is thin. We varied both to check that the conclusion “already above the market from month one, and flat from there” is not an artifact of the aggregation settings.
| Panel condition | Hotels | No denominator guard | This article’s standard (10+ hotels and ≥60% of median) |
Stricter (20+ hotels and ≥60%) |
|---|---|---|---|---|
| 9+ of months 0–12 | 115 | 1.158 → 1.173 | 1.158 → 1.173 | 1.158 → 1.181 |
| 10+ months | 102 | 1.152 → 1.169 | 1.152 → 1.169 | 1.152 → 1.176 |
| 11+ months (this article’s standard) | 97 | 1.158 → 1.169 | 1.158 → 1.169 | 1.158 → 1.176 |
| 12+ months | 83 | 1.158 → 1.164 | 1.158 → 1.164 | 1.158 → 1.169 |
| All 13 months | 71 | 1.187 → 1.176 | 1.187 → 1.176 | 1.187 → 1.185 |
Source: MetroEngines Research; compiled by HotelBank Editorial Team. Note: all combinations were re-aggregated using the same procedure. The bold column is the condition adopted in this article.
Across every combination tested, the opening-month median falls within 1.152–1.187 and the month-10 median within 1.164–1.185. The difference between the opening month and month 10 is within 0.03 under every condition, and even its sign is not stable. The conclusion that “the index is already around 1.15x in the opening month and barely moves for 12 months” depends neither on how the panel is drawn nor on how the denominator is cut.
What stands out instead is that the denominator guard has almost no effect. The column with no guard at all and the column using this article’s standard match to three decimal places in every panel row. Few prefecture × type combinations are affected by dropping months with fewer than 10 hotels, so there is not enough volume to move the median index. Tightening the guard to 20+ hotels raises the month-10 value by only about 0.01; this happens because thin markets (prefectures with small denominators) drop out, which relatively reduces the high regional indices — and it does not change the direction of the conclusion. Put the other way, the only choice that really matters in this analysis is the panel condition, and even that only moves the opening month to 1.187 once the sample is narrowed to the 71 hotels with all 13 months. Those 71 skew toward first-half-2025 openings, so bear in mind that the stricter the condition, the more the sample itself changes.
What This Index Can and Cannot Tell Us
Before applying these results in practice, here are four limitations of the index.
First, it measures price position, not revenue. This article tracks only the relative position of ADR, not occupancy. It is quite possible that occupancy is what really moves during the ramp-up; indeed, the actual operating pattern is probably “set price above the market from month one and build occupancy over time.” A ramp-up curve may well appear if one looks at RevPAR.
Second, the opening month may be a partial month. For a mid-month opening, the opening-month data mixes in the pre-opening listing period. Because months since opening are defined in calendar-month units, the opening-month value carries more error than other months. Arguments based on the opening month alone should be avoided.
Third, hotel type does not fully absorb grade differences. As shown above, hotels with price bands several times apart coexist within the same category. Looking at how a single hotel changes over time is less prone to misreading than comparing absolute index levels between hotels.
Fourth, the population is limited to hotels with confirmed OTA listings. The analysis covers the roughly 27,000 hotels tracked by MetroEngines Research that are confirmed to be operating; hotels not listed on OTAs are excluded. Opening records also include rebrands and conversions, so this is not a new-build-only tally.
Practical Implications
Based on the above, there are three points that can serve as assumptions for opening plans and investment decisions.
1. Put the business plan’s “ramp-up discount” on occupancy, not rate. For new openings with 100+ rooms, we did not observe ADR’s relative position climbing over the first 12 months. A plan that builds a first-year discount into the rate may be out of line with the data. If a discount is applied, putting it on the occupancy side is closer to the observed behavior.
2. For openings in the major metros, budget for the cost of holding relative position. In the business-hotel data, new openings in the three major metros eased slightly to an index of 0.95x after one year on a same-hotel basis. This does not mean their rates fell; it means that keeping pace with a rising market median requires following it up. Pricing plans for year two onward could build in the assumption that the next wave of openings is coming.
3. Even if the opening month comes in below 1.0, the catch-up phase ends within a quarter. Of the 42 hotels that started below 1.0, the 24 that got there reached 1.0 in a median of 2 months. The data show that even if the opening-month level comes in lower than planned, there is room to move relative position within a few months. Conversely, if the position has not moved after more than a quarter, that is a signal to consider whether the issue lies in the product or distribution channels rather than pricing.
Frequently Asked Questions
Is the “Opening Index” a standard industry metric?
No. It is a ratio defined for this analysis: a hotel’s ADR divided by the market median ADR for the same month, prefecture and hotel type, where 1.00 means on par with a typical hotel in that market. The idea is similar to STR’s RGI (Revenue Generating Index), but it differs in using the prefecture × hotel-type median as the denominator instead of a competitive set.
Why limit the analysis to hotels with 100+ rooms?
There were 1,761 openings in 2025 averaging 24 rooms, and small properties such as vacation rentals, cottages and guesthouses make up the majority. Their pricing differs in nature from the prefectural market median, making them a poor fit for the index denominator, so we drew the line at 100 rooms as a size that can be compared on the same footing as the market.
Why look at only 12 months after opening?
Because the population opened in 2025: as of August 2026, even the longest-running hotel is at 17 months, and most are at 10–12 months. At month 12 only hotels that opened in the first half of 2025 remain, so N shrinks to 76 and the composition changes. This article uses up to month 10 as the main comparison window and treats month 12 as a reference value.
Does the conclusion change if the aggregation settings change?
No. Re-aggregating across combinations of the panel condition (from 9+ of months 0–12 up to all 13 months) and the denominator guard (none / 10+ hotels and ≥60% of median / 20+ hotels and ≥60%), the opening-month median index falls within 1.152–1.187 and the month-10 median within 1.164–1.185. The difference between the opening month and month 10 is within 0.03 under every condition, and the “above the market from month one, then flat” shape holds.
How big is the gap between fast and slow ramp-ups?
Taking the ratio for the 105 hotels with both months 0–2 and months 9–12, the median is 0.98x, the bottom decile 0.74x, the top decile 1.32x and the maximum 1.68x. 14 hotels (13.3%) rose by 1.25x or more and 13 (12.4%) eased to 0.80x or less, so about one in ten moves sharply in each direction. The median stays flat because the moves up and down cancel out.
Is there a ramp-up in occupancy (OCC)?
This article does not cover it. Because of limits on how long our data has been accumulated, our estimated OCC does not adequately cover the opening months of the first half of 2025, so the ramp-up right after opening cannot be tracked with the same accuracy. We plan to examine the occupancy ramp-up separately once the observation period is longer.
Methodology and Sources
The population is the 137 hotels (25,524 rooms) with 100+ rooms among 2025 openings (based on confirmed OTA listings) tracked by MetroEngines Research & Consulting. Each hotel’s monthly estimated settled ADR was collected from its opening month through August 2026 and divided by the market median ADR for the same month, same prefecture and same hotel type (business / city / resort / ryokan / capsule) to obtain the Opening Index. On the market side, months are excluded when the number of hotels falls below 60% of that series’ median or below 10 hotels (under this rule, thinly observed months such as November 2025 in Hyogo drop out of the denominator). Only where a type-specific denominator was available for fewer than 6 months was the prefecture’s all-type median used instead (2 hotels).
The median curve by months since opening is calculated on a panel of 97 hotels with data for at least 11 of months 0–12. Within-hotel change is the ratio of the average index for months 9–12 to that for months 0–2, covering the 105 hotels with both windows. Opening dates were checked against each company’s public information, and the tables show the announced dates (for the analysis, months since opening are counted from the opening month).
References and Sources
■ Data Sources
The population is the 137 lodging facilities (25,524 rooms) with 100+ rooms confirmed to have opened in 2025 (based on confirmed OTA listings). Monthly estimated settled ADR was collected for each from January 2025 to August 2026, and the 127 hotels (23,893 rooms) with a valid estimated settled ADR were used to calculate the index. The denominator is the market median ADR for the same month, prefecture and hotel type, using monthly series for 36 prefectures × 5 hotel types. Opening dates and room counts were checked against each company’s published materials.
■ Calculation Assumptions
Opening Index = the hotel’s monthly estimated settled ADR ÷ the market median ADR for the same month, prefecture and hotel type. Months since opening are in calendar-month units with the opening month as month 0. The median curve uses a panel of 97 hotels with at least 11 of months 0–12; within-hotel change is the ratio of average indices for months 0–2 (hotels with 2+ months available) and months 9–12, covering 105 hotels. On the market side, months where the sample falls below 60% of the series median or below 10 hotels are excluded, and only where a type-specific denominator was available for fewer than 6 months was the prefecture’s all-type median used (2 hotels). The re-aggregations varying these cut-offs are shown in the sensitivity table in the body.
■ Limitations and Caveats
Estimated settled ADR is an estimate obtained by applying a hotel-type-specific adjustment factor to published listing prices, and it differs from each hotel’s actual transaction prices and accounting figures. This article tracks only price position and excludes occupancy, so the ramp-up in RevPAR cannot be assessed. For mid-month openings the opening-month value mixes in the pre-opening listing period, so arguments based on the opening month alone are avoided. Hotel type is a coarse proxy for product grade, and hotels with price bands several times apart coexist in the same category. The population is limited to hotels with confirmed OTA listings, and opening records include rebrands and conversions. Resort hotels (8 covered by the index) and ryokan (3) have small samples and are treated as reference values.
■ Market Data
- MetroEngines Research — estimated settled ADR by hotel and area (January 2025–August 2026, N=137 hotels / 127 covered by the index)
- MetroEngines Research & Consulting — 2025 hotel opening data (based on confirmed OTA listings, 1,761 properties)
■ Property Information and Press Releases
- Hulic Hotel Management: “THE GATE HOTEL Fukuoka by HULIC” grand opening on April 24, 2025 (Japanese)
- JR West Japan Hotel Development: Opening of Hotel Granvia Hiroshima South Gate (March 24, 2025) (Japanese)
- Belluna: Sapporo Hotel by Granbell to open March 1, 2025 (Japanese)
- Hankyu Hanshin Hotels: Hotel Hankyu Gran Respire Osaka opens March 21, 2025 (Japanese)
- KOKO HOTEL Osaka Namba Sennichimae: new opening on May 29, 2025 (Japanese)
- Hospitality Operations: Hotel Enoe Toyama rebrand opening on August 29, 2025 (Japanese)
- Core Global Management: Quintessa Hotel Akita rebrand opening on October 1, 2025 (Japanese)
- Core Global Management: Quintessa Hotel Hiroshima Kanayamacho opens August 16, 2025 (156 rooms) (Japanese)
- Route Inn Japan: Hotel Route-Inn Grand Misawa -EAST COURT- opens August 20, 2025 (259 rooms) (Japanese)
- Tokyo Bay Maihama Hotel to rebrand as “Maihama View Hotel by HULIC” (TRAICY, September 7, 2025) (Japanese)
- Hilton, “Company Overview” (updated August 25, 2026) — room count and opening year of Waldorf Astoria Osaka