

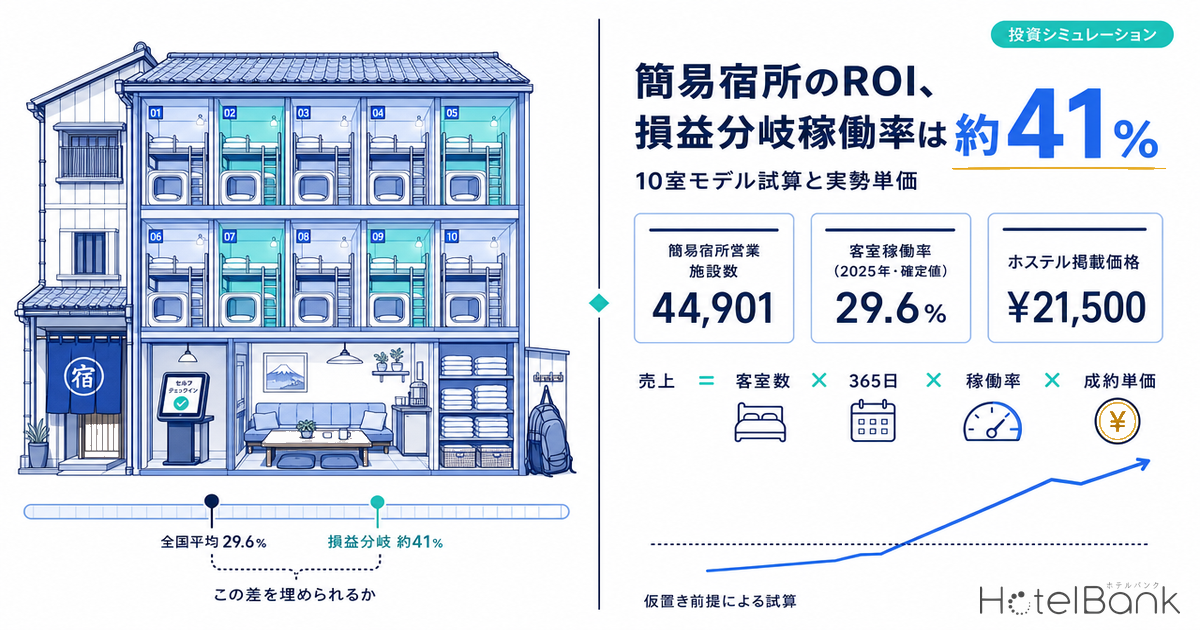
Simple lodging (kan-i shukusho — the “simple accommodation” business category under Japan’s Hotel Business Act, sometimes called budget inns) keeps growing in number as a vehicle for converting vacant houses and buildings and for small-scale openings. According to the Ministry of Health, Labour and Welfare (MHLW) “Report on Public Health Administration and Services,” there were 44,901 simple-lodging licenses at the end of FY2024 (as of March 31, 2025), up 7.1% year on year. Meanwhile, the Japan Tourism Agency (JTA) “Overnight Travel Statistics Survey” puts simple lodgings’ room occupancy for 2025 (final figures) at 29.6% — the lowest of any facility type. This article unpacks the earnings structure that sits between those two numbers by breaking it into revenue, costs and payback. We also present September 2026 listed prices compiled by MetroEngines Research & Consulting (hostels, guesthouses, dormitories and capsule hotels; N=4,528 properties in total) as the prevailing market level, and, with every assumption stated, estimate the break-even occupancy and simple payback period for a 10-room model.
Metric Definitions Used in This Article
- Listed price (all-plan average, tax-inclusive): the average selling price each property publishes on major booking sites. It is the per-room rate for one room occupied by two guests (tax-inclusive) and covers every plan from room-only to meal-inclusive. It differs from the actual transacted price. Area- and category-level figures are averages of property prices weighted by number of properties.
- Estimated transacted rate: a provisional transaction level (tax-exclusive equivalent) used in this article’s model. It is derived by applying a conversion factor to the listed price; the basis for that factor is explained in the section “Breaking Down the Revenue Model.” It is an estimate and differs from any property’s actual transacted prices or accounting figures.
- Room occupancy (OCC): the occupancy used in this article is the room occupancy rate from the JTA “Overnight Travel Statistics Survey” (by facility type, annual value). It is an observed figure from official statistics, not a MetroEngines estimate.
- ROI and payback period: the payback period here is the simple payback period, calculated as “initial investment ÷ annual operating profit.” It excludes the effects of corporate tax, interest, principal repayment, restoration costs and depreciation.
- Data sources: listed prices and property counts from MetroEngines Research & Consulting; occupancy from the JTA; license counts from the MHLW.
- — Break-even occupancy is about 41%. This is modeled on provisional assumptions of 10 rooms, a 72.0% contribution margin and ¥13.8 million in annual fixed costs; the sensitivity range for conversion factors of 0.55–0.65 is 37–44%.
- — National average occupancy is 29.6% (JTA, 2025 final). That is more than 11 points below break-even — at average occupancy, this fixed-cost structure does not work.
- — Hostels’ listed price is ¥21,500 (Sep 2026, nationwide, N=1,985), above business hotels’ ¥15,625. Rate is not the weak point of shared-type lodging.
- — Raising occupancy from 45% to 55% lifts operating profit from ¥1.46M to ¥4.85M (3.3x). ROI is decided not by rate but by fixed-cost design and securing occupancy.
- — Osaka’s weighted listed price of ¥14,134 is the lowest of the 31 prefectures with 30+ listings. Its supply ranks 5th nationally — deep supply does not mean strong demand.
1. What Is a Simple-Lodging License? How the Three Regimes Differ
The starting point for any investment review is choosing which regulatory regime to operate under. There are three main regimes for the lodging business: Ryokan/Hotel Business under the Hotel Business Act; Simple Lodging Business, also under the Hotel Business Act; and Private Lodging Business (minpaku) under the Private Lodging Business Act.
Article 2(3) of the Hotel Business Act defines simple lodging as “a business that provides facilities whose structure and equipment are mainly designed for lodging spaces shared by many people, and accommodates guests for a lodging fee.” Dormitory-centered hostels and guesthouses, capsule hotels, mountain huts and many of the increasingly common whole-house rentals operate under this license. The key point is that because simple lodging sits within the Hotel Business Act, there is no cap on annual operating days. The 180-day annual cap on private lodging is a poor fit for business plans that assume year-round operation, so simple lodging tends to be chosen when an operator wants to scale.
On structure and equipment, a 2016 amendment to the Enforcement Order relaxed the guest-room floor-area requirement: where capacity is under 10 guests, “3.3㎡ × number of guests” or more is sufficient (33㎡ or more for 10 guests or more). The amended Hotel Business Act that took effect in June 2018 further removed the blanket requirement for a front desk (genkan chōba), allowing ICT equipment to substitute provided identity verification and emergency-response requirements are met. Because local ordinances and guidelines vary, the standard practice is to consult the local public health center before securing a property. In practice, small-scale licensing has spread widely since 2018 — licenses can now be granted for a single guest room.
| Item | Ryokan/Hotel Business | Simple Lodging Business | Private Lodging Business |
|---|---|---|---|
| Governing law | Hotel Business Act | Hotel Business Act | Private Lodging Business Act |
| Procedure | License (prefectural governor, etc.) | License (prefectural governor, etc.) | Notification (prefectural governor, etc.) |
| Annual operating days | No limit | No limit | Capped at 180 days per year |
| Guest-room area standard | 7㎡+ per room (9㎡+ with beds) | Total guest-room floor area 33㎡+; under 10 guests: 3.3㎡ × guests or more | 3.3㎡+ per person |
| Front desk | Requirements clarified in the 2018 amendment; ICT substitution allowed | Same as left. Some municipalities waive it for under 10 guests meeting certain conditions | Not required (whether a registered manager must be engaged depends on type) |
| Use under the Building Standards Act | Hotel/ryokan | Hotel/ryokan (subject to zoning restrictions) | Residence (can operate in exclusively residential zones, subject to local ordinances) |
| Typical use | Full-scale lodging business; investment at scale | Small-to-mid-sized year-round lodging; conversions and vacant-house reuse | Supplementary income from idle residential space |
For investment decisions, zoning matters especially. Businesses under the Hotel Business Act (Ryokan/Hotel and Simple Lodging) are treated as “hotel/ryokan” under the Building Standards Act and cannot be built in Category 1 and 2 low-rise exclusively residential zones, Category 1 and 2 mid/high-rise exclusively residential zones, rural residential zones, industrial zones or exclusively industrial zones. Even in Category 1 residential zones they are limited to 3,000㎡ or less of floor area. Whereas private lodging can operate as a “residence” even in exclusively residential zones, simple lodging has correspondingly fewer location options. Finding a good building in a cheap residential area does not help if it cannot qualify for a license in the first place. This issue comes before any estimate of initial investment — it is a precondition to confirm before running an earnings simulation.
2. 1.8x More Properties in 12 Years — Supply Depth vs. a Mismatched Population
The number of simple-lodging licenses has risen steadily on the back of inbound tourism growth and deregulation. Tracking the annual MHLW “Report on Public Health Administration and Services” data, the count rose from 25,071 at the end of FY2012 to 38,593 at the end of FY2021, reaching 44,901 at the end of FY2024 (March 31, 2025) — roughly 1.8x in 12 years. Ryokan/Hotel Business, by contrast, fell from 54,540 at the end of FY2012 to 49,024 at the end of FY2017 before rebounding to 52,946 at the end of FY2024. The gap between the two has narrowed from 29,469 in FY2012 to 8,045.
However, it is not accurate to read the 44,901 figure as “the number of competitors.” The population of licenses does not match the population of properties actually selling on booking sites. The four shared/simple categories whose active operation MetroEngines Research & Consulting could confirm in September 2026 (hostels, guesthouses, dormitories and capsule hotels) total 4,528 properties — only about one-tenth of the license count.
License counts and listing counts simply measure different scopes. The simple-lodging license is used widely regardless of format: many holiday villas, cottages, machiya townhouses, farm stays and campground bungalows sit under the same license, and in our category classification these fall into separate categories. License counts also include seasonal-only properties, properties that sell only through their own website, and properties that keep their license but are not currently selling. Treat the license base as the upper bound of supply potential and the listing base as the actual current competitive environment, and use each according to purpose. Across the lodging industry as a whole, fewer than a third of licensed facilities appear on major booking sites, so the same caution applies beyond simple lodging.
New openings can also be tracked on an OTA-listing basis. In 2026, 1,580 new properties across all categories were confirmed as operating, of which 118 were hostels and 87 guesthouses — 205 in total. In 2025, hostels (101) and guesthouses (129) totaled 230 out of 1,758 overall. Note that because properties list on booking sites at varying times around opening, the 2026 count may rise as more listings appear.
3. Breaking Down the Revenue Model — Don’t Plug Listed Prices Straight into Revenue
Like other lodging formats, the earnings structure of simple lodging breaks down into the following equations.
Annual revenue = available rooms × 365 days × room occupancy × transacted rate
Operating profit = annual revenue × contribution margin − annual fixed costs
Simple payback period = initial investment ÷ annual operating profit
Of these inputs, the one investors most often get wrong is the transacted rate. Multiplying the price shown on booking sites straight into annual revenue overstates reality significantly. Published prices are “all-plan averages, tax-inclusive, per room for two guests,” and they run structurally higher than transacted rates: unsold high-priced plans stay on display, consumption tax is included, and actual bookings skew toward cheaper plans.
The size of this gap can be measured in categories where reconciliation with actual bookings is further along. For business hotels, for which MetroEngines calculates an estimated transacted rate, comparing listed prices with estimated transacted rates for the fully observed months of June–August 2026 gives 59.5–60.8% in Tokyo (N=913–915 properties), 57.5–60.4% in Osaka (N=495–503) and 56.3–61.0% in Kyoto (N=324–325) — in every case roughly 60% of the listed price. The range across the three prefectures and three months is 56.3–61.0%.
This article’s model applies that ratio directly to simple lodging. We state clearly, however, that this borrows a ratio validated for business hotels; it has not been validated for hostels or guesthouses. Shared-type lodging sells private rooms and dormitory beds as different units, and how a two-guests-per-room listed price diverges from reality depends heavily on format-specific factors. We therefore model the base case of 0.60 as well as both ends at 0.55 and 0.65 to show sensitivity.
4. Prevailing Listed Prices — Hostels at ¥21,500, Little Spread Between Categories
Looking at nationwide listed prices for properties confirmed as operating in September 2026 by category, hostels are highest at ¥21,500 (N=1,985), followed by guesthouses at ¥20,900 (N=2,305), dormitories at ¥19,500 (N=131) and capsule hotels at ¥19,100 (N=107). The spread across the four categories is only about ¥2,400, so price differences within shared-type lodging are small. For reference, business hotels in the same month were ¥15,600 (N=7,900) — shared-type lodging is actually listed above business hotels.
| Category | Listed price | Properties (N) | Characteristics |
|---|---|---|---|
| Hostel | ¥21,500 | 1,985 | Core shared-type format with both private rooms and dorms |
| Guesthouse | ¥20,883 | 2,305 | Many small, family-run properties; median 4 rooms |
| Dormitory | ¥19,491 | 131 | Mainly shared rooms; few listings, reference value |
| Capsule hotel | ¥19,050 | 107 | Large-format, concentrated in city-center and station-front locations |
| Minshuku (family-run inn) | ¥21,232 | 1,409 | Small inns in fishing villages and tourist areas; reference metric |
| Business hotel | ¥15,625 | 7,900 | Reference level on the Ryokan/Hotel Business side of the Act |
This level may seem counterintuitive, since “simple lodging = cheap lodging” is the common perception. In fact, a dormitory bed rate and a listed price compiled on a two-guests-per-room basis are different metrics. Many shared-type properties also have private rooms, and more and more are designed with a higher share of private rooms to capture group and family demand. The higher listed prices likely reflect these private rooms being included in the aggregation. From an investment standpoint, “how many rooms per building you can keep occupied” determines revenue scale more than the rate itself.
The room-count distribution makes that constraint clear. Hostels in the MetroEngines master have a median of 9.7 rooms, a third quartile of 21 and a 90th percentile of 36 (N=3,859). Guesthouses are smaller still: median 4 rooms, third quartile 9, 90th percentile 16 (N=6,342). In other words, most businesses in this category are small, around 10 rooms, so even with high rates the absolute revenue is limited. The next section’s model case uses 10 rooms to match the median of this distribution.
5. Model Case — 10 Rooms, Break-even Occupancy of About 41%
⚠ All estimates in this section are simulations based on provisional assumptions. Occupancy, initial investment and cost ratios are not the actual results of any specific property; they are figures set to illustrate the “template” of a model used when reviewing an investment. They do not guarantee or assert any yield or payback period, and actual business plans vary greatly with property conditions, location and operating structure. Corporate tax, interest and principal repayment, restoration costs, depreciation and changes in post-opening working capital are not included.
First, the assumptions. The property has 10 rooms (matching the hostel median of 9.7 rooms). The listed price is the nationwide hostel figure of ¥21,500; applying the 0.60 factor from the previous section gives an estimated transacted rate of ¥12,900 (tax-exclusive equivalent). At 100% occupancy, annual potential revenue is 10 rooms × 365 days × ¥12,900 = ¥47,085,000.
Costs are split into variable and fixed. Variable costs, as a share of revenue, are 10.0% sales commissions, 8.0% outsourced linen and cleaning, 7.0% utilities and 3.0% consumables and amenities — 28.0% in total, for a contribution margin of 72.0%. Fixed costs assume a leased whole building: rent of ¥4.8M (¥400,000/month), personnel of ¥7.2M (one full-time employee plus part-timers), ¥0.9M for insurance, communications, reservation-management system and advertising, and ¥0.9M for repair reserves and other items — ¥13.8M per year in total.
| Line item | Amount (¥ thousand) | % of revenue | Assumption detail |
|---|---|---|---|
| Revenue (at 45% OCC) | 21,188 | 100.0% | 10 rooms × 365 days × estimated transacted rate ¥12,900 × 45% |
| Sales commissions, etc. | 2,119 | 10.0% | Commissions on bookings via external sales channels |
| Outsourced linen & cleaning | 1,695 | 8.0% | Room cleaning and linen changes |
| Utilities | 1,483 | 7.0% | Including common areas |
| Consumables & amenities | 636 | 3.0% | Amenities, consumables |
| Total variable costs | 5,933 | 28.0% | Contribution margin 72.0% |
| Contribution margin | 15,256 | 72.0% | Revenue − variable costs |
| Rent (annual, fixed) | 4,800 | — | ¥400,000/month; leased whole building |
| Personnel (annual, fixed) | 7,200 | — | One full-time employee plus part-timers |
| Insurance, communications, systems, advertising | 900 | — | Reservation-management system fees, etc. |
| Repair reserve & other | 900 | — | Routine repairs, miscellaneous |
| Total fixed costs | 13,800 | — | Incurred regardless of occupancy |
| Operating profit (at 45% OCC) | 1,456 | 6.9% | Contribution margin − fixed costs |
From this structure, break-even occupancy is fixed costs of ¥13.8M ÷ (annual potential revenue of ¥47.085M × 72.0% contribution margin) = 40.7%. Lowering the factor to 0.55 gives 44.4%; raising it to 0.65 gives 37.6%. Including sensitivity, the range is roughly 37–44%. (Break-even occupancy is simply fixed costs divided by contribution margin at full occupancy, so it can be back-solved for any property once these three inputs are set.)
This is where comparison with official JTA statistics becomes meaningful. The 2025 final figure for simple-lodging room occupancy is 29.6% nationwide — more than 11 points below this model’s break-even of about 41%. In other words, at national-average occupancy, this model’s fixed-cost structure does not work. Conversely, whether you can generate above-average occupancy is the deciding factor for the investment.
The 29.6% average includes seasonal-only mountain huts and properties that do not actively sell year-round. Restricting to urban properties selling year-round on booking sites, a considerable number likely operate well above that level. But official statistics do not publish that breakdown, so an investment plan should start from the fact that “the national average is 29.6%” and be able to explain how much its own location and sales setup can add on top.
6. Payback Matrix — How Initial Investment Plays Through
Once operating profit is set, the simple payback period is just initial investment divided by it. Initial investment swings widely with how the property is acquired. A small-scale conversion of a leased property can work from a few million yen, whereas interior renovation of around ¥2 million per room for 10 rooms comes to about ¥20 million — roughly ¥25 million once fixtures, furniture and working capital are added. Acquiring the property pushes it higher still. Here we line up three levels: ¥10M, ¥25M and ¥40M.
| Room occupancy | Annual operating profit | Operating margin | Investment ¥10M | Investment ¥25M | Investment ¥40M |
|---|---|---|---|---|---|
| 45% | ¥1.46M | 6.9% | 6.9 yrs | 17.2 yrs | 27.5 yrs |
| 50% | ¥3.15M | 13.4% | 3.2 yrs | 7.9 yrs | 12.7 yrs |
| 55% | ¥4.85M | 18.7% | 2.1 yrs | 5.2 yrs | 8.3 yrs |
| 60% | ¥6.54M | 23.2% | 1.5 yrs | 3.8 yrs | 6.1 yrs |
| 65% | ¥8.24M | 26.9% | 1.2 yrs | 3.0 yrs | 4.9 yrs |
Structure 1 A few points of occupancy matter
Just above break-even, operating profit is thin, so a 10-point move in occupancy from 45% to 55% lifts operating profit 3.3x, from ¥1.46M to ¥4.85M. This is a format in which additional occupancy has strong leverage on earnings.
Structure 2 The weight of initial investment sets payback
Even at 55% occupancy, payback is 2.1 years on a ¥10M investment but 8.3 years on ¥40M. With identical rate and occupancy, choices about renovation scope and acquisition method change the payback period fourfold. Investment design itself is a key variable of viability.
Structure 3 How fixed costs are set moves break-even
Personnel accounts for ¥7.2M of this model’s ¥13.8M in fixed costs. Moving fixed costs alone, break-even is 36.6% at ¥12.42M (−10%), 44.8% at ¥15.18M (+10%), and falls to 30.1% at ¥10.2M with personnel cut to ¥3.6M. Designs that shift fixed costs to variable — such as self check-in or outsourced cleaning — directly lower break-even occupancy, and this swing is comparable to the sensitivity range for factors of 0.55–0.65 (37–44%). All are model values based on this article’s provisional assumptions.
7. Rate Differences by Area — Cities Are Not Always Higher
Finally, we look at how rates vary by location. Aggregating by prefecture the properties in the four shared-type categories confirmed as operating in September 2026 gives N=4,267 across all 47 prefectures. Plotting the 31 prefectures with 30 or more listings (N=3,986 in total) by number of properties against property-weighted listed price shows that the picture is not simply “cities expensive, regions cheap.”
Tokyo has the most listings at 579, with a weighted listed price of ¥21,800, followed by Okinawa with 470 (¥17,900), Kyoto with 421 (¥21,300) and Hokkaido with 314 (¥22,300). What stands out is Osaka. Despite having the 5th-largest supply nationally at 250 listings, its weighted listed price is ¥14,100 — the lowest of the 31 prefectures with 30 or more listings. The gap with Tokyo is ¥7,700, or 35%.
On the other hand, thinner-supply areas are not necessarily cheaper. Hokkaido, with 314 listings, is at ¥22,300 — above Tokyo — while Nagano (146 listings) is at ¥23,100 and Shizuoka (97) at ¥25,000. In resort locations, even shared-type lodging includes formats close to whole-house rentals and high-rate properties catering to ski and outdoor demand, which pushes averages up.
| Prefecture | Listings | Weighted listed price | Hostel | Guesthouse |
|---|---|---|---|---|
| Tokyo | 579 | ¥21,818 | ¥22,725 N=374 | ¥21,485 N=141 |
| Kyoto | 421 | ¥21,262 | ¥21,237 N=251 | ¥20,979 N=164 |
| Osaka | 250 | ¥14,134 | ¥13,756 N=142 | ¥14,593 N=89 |
| Hokkaido | 314 | ¥22,282 | ¥25,782 N=150 | ¥18,950 N=151 |
| Okinawa | 470 | ¥17,852 | ¥16,923 N=304 | ¥20,305 N=151 |
| Fukuoka | 241 | ¥20,476 | ¥20,408 N=191 | ¥22,598 N=36 |
| Nagano | 146 | ¥23,056 | ¥25,724 N=39 | ¥20,818 N=102 |
| Hiroshima | 122 | ¥21,019 | ¥21,689 N=67 | ¥19,128 N=49 |
| Kagoshima | 115 | ¥15,848 | ¥12,504 N=27 | ¥17,055 N=84 |
Osaka’s level likely reflects high supply density feeding through into prices. Shared-type lodging in Osaka is concentrated in a small central area, which invites like-for-like comparison between similar products. Tokyo, by contrast, has multiple areas with different demand profiles even within the 23 wards, and Kyoto mixes in differentiated products such as renovated machiya. A large supply does not necessarily mean strong demand, and can even push rates down — a practical takeaway for site selection.
(1) Does zoning permit a lodging business (can it qualify for a license)? → (2) Prior consultation with the local public health center (structure and equipment, front-desk operation) → (3) Number of listings and price range of the same category in the trade area (competitive environment) → (4) Finalize initial investment including acquisition and renovation → (5) Calculate break-even occupancy and design sales to exceed it. Working through assumptions in this order, rather than starting from a rate assumption, makes the plan more accurate.
Summary — ROI Is Set by Fixed Costs and Occupancy, Not Rate
Simple lodging has no cap on annual operating days, so it can be designed as a year-round lodging business, and it forms a deep market of 44,901 licensed properties (end of FY2024). Listed prices — ¥21,500 for hostels (N=1,985) — exceed business hotels’ ¥15,600 (N=7,900), so on rate alone the format holds up well.
What the 10-room model showed, however, is that profitability in this format is determined more by fixed-cost design and securing occupancy than by rate. Under provisional assumptions of a 72.0% contribution margin and ¥13.8M in annual fixed costs, break-even occupancy is about 41% (sensitivity range 37–44%). That requires exceeding the JTA’s national average occupancy for simple lodging of 29.6% (2025 final) by more than 11 points. At 45% occupancy the operating margin is a thin 6.9%; lifting occupancy to 55% improves it to 18.7%. That 10-point difference moves the payback period from 17.2 years to 5.2 years in the ¥25M investment case.
And listed prices by area showed that the simple view of “cities are more expensive” does not hold. Osaka has the 5th-largest supply nationally yet a weighted listed price of ¥14,100, the lowest of the 31 prefectures with 30 or more listings. Supply depth is not proof of demand strength and can even push rates down. When reviewing an investment, the practical order is not to set a rate assumption first, but to confirm the regulatory ground — zoning and public health center requirements — and then back-solve break-even occupancy from the trade area’s supply density and your own fixed-cost structure.
⚠ Note on the estimates in this article: The model case in this article is a simulation based on provisional assumptions set to illustrate how to think about modeling an investment; it is not the actual result of any specific property. The 0.60 factor from listed price to estimated transacted rate borrows a ratio validated for business hotels and has not been validated for shared-type lodging. Listed prices are averages of selling prices published at the time of the survey and will change. Actual business planning requires detailed research based on the specific property’s conditions and prior consultation with the local public health center and building authorities.
Related Reading
- Simple Lodging × Vacant Home Reuse 2026: Kyoto, Osaka & Naha Whole-House IRR
- Lodging Supply Denominator: 44,901 Simple Lodgings Move Kyoto 21st→5th
- Japan’s 96 New Hostels in 2026: Where Budget Shared Stock Falls Short
References & Sources
■ Data Sources
Listed prices and listing counts aggregate properties that MetroEngines Research & Consulting confirmed as operating on major booking sites as of September 2026 (four shared-type categories, N=4,528 in total; prefectural aggregation N=4,267 across 47 prefectures). Per room for two guests, tax-inclusive, all-plan average; area- and category-level figures are weighted by number of properties. The room-count distribution is based on MetroEngines master records (hostels N=3,859, guesthouses N=6,342, dormitories N=456). Room occupancy is from the JTA “Overnight Travel Statistics Survey,” 2025 annual values (final); license counts are from the MHLW “Report on Public Health Administration and Services” as of the end of FY2024.
■ Model Assumptions
The model case assumes 10 rooms (corresponding to the hostel median of 9.7 rooms), an estimated transacted rate of ¥12,900 (a provisional, tax-exclusive-equivalent value from applying a 0.60 factor to the nationwide hostel listed price of ¥21,500), a variable cost ratio of 28.0% (sales commissions 10.0%, linen and cleaning 8.0%, utilities 7.0%, consumables 3.0%), a contribution margin of 72.0%, and annual fixed costs of ¥13.8M (rent ¥4.8M, personnel ¥7.2M, insurance/communications/systems/advertising ¥0.9M, repair reserve and other ¥0.9M). Initial investment is tested at three levels: ¥10M, ¥25M and ¥40M. Sensitivity was taken at factors of 0.55, 0.60 and 0.65. Simple payback period = initial investment ÷ annual operating profit.
■ Limitations
The 0.60 factor borrows the 56.3–61.0% ratio of estimated transacted rate to listed price observed for business hotels (Tokyo, Osaka, Kyoto; June–August 2026; N=324–915 properties) and has not been validated for shared-type lodging. Cost ratios, fixed costs and initial investment are all provisional assumptions, not the actual results of any specific property, and do not guarantee any yield or payback period. Payback periods exclude corporate tax, interest, principal repayment, restoration costs, depreciation and changes in working capital. Listed prices differ from transacted prices; they are averages of selling prices published at the time of the survey and will change. The license population (44,901) and the booking-site listing population (4,528) cover different scopes and cannot be compared directly. Categories with fewer than 3 listings are excluded from aggregation.
■ Market Data
- MetroEngines Research & Consulting — listed prices and counts of properties confirmed as operating, by category and prefecture (as of September 2026); room-count distribution (master records); ratio of listed price to estimated transacted rate (June–August 2026, business hotels)
■ Government Statistics & Public Data
- Japan Tourism Agency, “Overnight Travel Statistics Survey (April 2026 2nd preliminary, May 2026 1st preliminary, and 2025 annual values (final)),” July 6, 2026 (Japanese)
- Japan Tourism Agency, “Overnight Travel Statistics Survey” (Japanese)
- MHLW, “Overview of the FY2024 Report on Public Health Administration and Services” (Japanese)
- e-Stat, “Report on Public Health Administration and Services, Appendix: Number of Lodging Businesses by Year, FY1997 onward” (table ID: 0004048085) (Japanese)
- Hotel Business Act Enforcement Order (Cabinet Order No. 152 of 1957) (Japanese)
- MHLW, “Overview of the Hotel Business” (Japanese)
- MHLW Health and Public Hygiene Bureau, “Regulation of Front Desks, etc. for Simple Lodging Business under the Hotel Business Act” (submitted to the Regulatory Reform Promotion Council) (Japanese)
- Tokyo Metropolitan Government, “Guide to the Hotel Business (Ryokan/Hotel Business, Simple Lodging Business)” (Japanese)
■ Construction & Renovation Cost Reference