

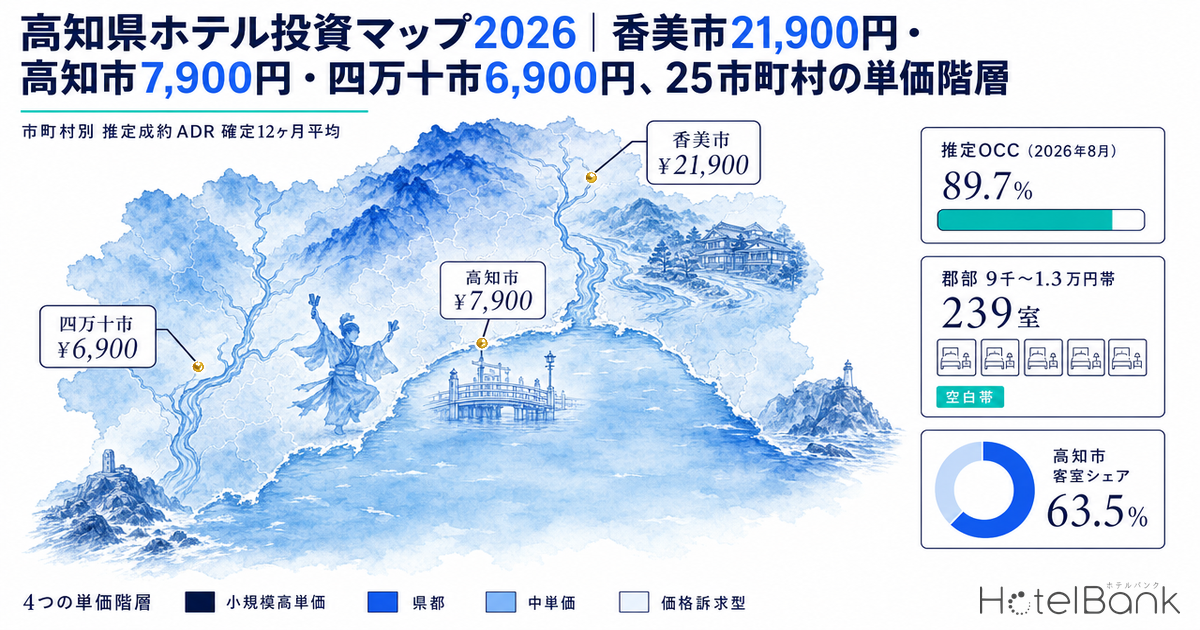
Kochi Prefecture’s lodging stock is concentrated in the prefectural capital: Kochi City holds just over 60% of the prefecture’s rooms. Meanwhile, along the Monobe and Niyodo river basins and on the eastern and western coasts, small properties with few rooms and high rates are scattered across the map. In this article we average the estimated settled ADR compiled by MetroEngines Research & Consulting by municipality over the 12 confirmed months (September 2025 to August 2026), then overlay the rate tiers of 25 municipalities with segment mix, supply, demand-supply balance and site conditions to identify which price bands and areas in the prefecture leave a gap for investment.
This article is the Kochi edition of our prefecture-by-prefecture investment map series (which also covers Oita, Ishikawa, Nagasaki, Nara and others). Unlike a Shikoku comparison that lines up the four prefectural capitals side by side, the subject here is the tier structure of municipalities within Kochi Prefecture. Brand conversions such as the ANA Crowne Plaza Kochi rebranding are outside its scope. Tsunami risk from a Nankai Trough earthquake is treated only as one column in the site assessment table, not as a main theme.
Metric Definitions Used in This Article
- ADR (Average Daily Rate): estimated settled rate (tax-exclusive equivalent), calculated by applying a segment-specific correction factor to each property’s lowest published plan rate on OTAs and similar channels (per room, 2 guests, tax-inclusive). Checked against property-level results disclosed by listed hotel REITs (91 properties, most recent 3 months), the median error is about 7%. These are estimates and differ from each property’s actual settled prices and accounting figures. Area-level ADR is the median of the properties covered (the level of a typical property in the area), and the “12-month average” in this article is a simple average of the monthly values. Segments covered by the estimate are business, city, resort, ryokan and capsule; vacation rentals, minshuku, guesthouses and similar are not included.
- OCC (Occupancy): rooms sold as a share of total rooms in the area (an estimate based on OTA sales inventory). It is an estimate based on how inventory sold on OTAs and similar channels is taken up, and differs from each property’s actual occupancy.
- LT (Lead Time): days before the stay date. The booking curves in this article are drawn from LT45 to LT1.
- Early sell-out test: judged by the lead time at which remaining inventory (in rooms) first reached zero. Only properties whose OTA allocation is 30% or more of total rooms are included.
- Data source: MetroEngines Research & Consulting (as of September 15, 2026)
- — Estimated settled ADR ¥7,900, +4.7% YoY: Kochi Prefecture’s average over the 12 confirmed months (September 2025 to August 2026). The prior-year period was ¥7,600, and the monthly range of ¥7,000–9,400 is moderate.
- — 25 municipalities fall into 4 tiers: small-scale, high-rate properties in the river basins and on the coast (Kami City ¥21,900 and others); mid-rate (Muroto City ¥8,600, Tosashimizu City ¥8,100); the prefectural capital (Kochi City ¥7,900); and value-oriented (Shimanto City ¥6,900, Aki City ¥4,700).
- — 63.5% of rooms are in Kochi City: 5,732 of 9,028 rooms at 274 properties in the prefecture. 4,376 business-hotel rooms form the core, and the band at ¥13,000 and above is thin at 759 rooms (13.7%).
- — The ¥9–13k band in the outlying areas has 8 properties and 239 rooms: during Yosakoi, 94% of dates sold out 30 or more days before the stay date, and 53% reached sell-out during Golden Week too.
- — Estimated OCC of 89.7% (August 2026, N=89 properties) is the highest of Shikoku’s four prefectures. The data fit an acquire-and-renovate approach in Kochi City and small new builds of 10–30 rooms in the outlying areas.
Prefecture-wide estimated settled ADR is ¥7,900, +4.7% YoY
Start with the prefecture-wide level. Average estimated settled ADR over the 12 confirmed months (September 2025 to August 2026) is ¥7,900, up 4.7% from ¥7,600 in the preceding 12 months (September 2024 to August 2025). The number of properties covered each month ranged from 116 to 124, and there was no month in the series in which the population changed substantially.
By month, the peak is August, at ¥9,400 in August 2026 (+3.1% YoY), followed by November. November 2025 came in at ¥8,800, 8.7% above the prior year (¥8,100). June, on the other hand, is the usual trough, and June 2026 stayed at ¥7,000 (−1.0% YoY). In other words, rates in Kochi have a seasonal pattern of “rising in the summer and autumn travel seasons and settling in the rainy season”, but the monthly swing is around ¥7,000–9,400, which is moderate when averaged across the prefecture.
Rate tiers across 25 municipalities — from ¥21,900 in Kami City to ¥4,700 in Aki City
Now break it down by municipality. Ranking the 25 municipalities for which estimated settled ADR could be calculated by their 12-month average, rates in the prefecture split into four broad tiers. Note, however, that many outlying municipalities have only 1–2 properties in the estimate, so the composition of a single property swings the value substantially. The table below therefore marks municipalities with 2 or fewer properties in the estimate, or without all 12 months, as “reference values”.
| Municipality | Tier | Estimated settled ADR 12-month average | Monthly min–max | Properties in estimate | Listed properties | Notes |
|---|---|---|---|---|---|---|
| Tosa City | Small-scale, high-rate | ¥24,164 | ¥20,923–¥30,932 | 2 | 5 | Reference value (few properties) |
| Niyodogawa Town | Small-scale, high-rate | ¥23,564 | ¥12,694–¥32,296 | 2 | 3 | Reference value (few properties) |
| Nakatosa Town | Small-scale, high-rate | ¥23,131 | ¥15,869–¥30,714 | 1 | 3 | Reference value (few properties) · 8 months only |
| Kami City | Small-scale, high-rate | ¥21,876 | ¥19,442–¥23,760 | 4 | 8 | |
| Tsuno Town | Small-scale, high-rate | ¥19,133 | ¥12,776–¥26,442 | 1 | 3 | Reference value (few properties) |
| Umaji Village | Small-scale, high-rate | ¥14,109 | ¥12,381–¥18,118 | 1 | 1 | Reference value (few properties) |
| Shimanto Town | Small-scale, high-rate | ¥12,227 | ¥8,306–¥20,250 | 1 | 5 | Reference value (few properties) |
| Konan City | Mid-rate | ¥10,846 | ¥8,514–¥14,300 | 2 | 7 | Reference value (few properties) |
| Ino Town | Mid-rate | ¥10,385 | ¥8,088–¥14,819 | 2 | 7 | Reference value (few properties) |
| Nahari Town | Mid-rate | ¥10,337 | ¥7,098–¥19,268 | 1 | 3 | Reference value (few properties) |
| Geisei Village | Mid-rate | ¥10,315 | ¥7,629–¥14,115 | 2 | 5 | Reference value (few properties) |
| Yusuhara Town | Mid-rate | ¥9,629 | ¥7,528–¥11,606 | 1 | 4 | Reference value (few properties) |
| Kitagawa Village | Mid-rate | ¥9,587 | ¥8,129–¥12,322 | 1 | 1 | Reference value (few properties) |
| Muroto City | Mid-rate | ¥8,635 | ¥6,757–¥10,969 | 3 | 11 | |
| Tosashimizu City | Mid-rate | ¥8,114 | ¥6,722–¥10,105 | 9 | 14 | |
| Nankoku City | Mid-rate | ¥8,047 | ¥6,133–¥11,699 | 3 | 4 | |
| Kochi City | Prefectural capital | ¥7,878 | ¥6,938–¥9,575 | 60 | 87 | |
| Kuroshio Town | Value-oriented | ¥7,663 | ¥5,295–¥10,545 | 2 | 7 | Reference value (few properties) |
| Tosa Town | Value-oriented | ¥7,097 | ¥7,097–¥7,097 | 1 | 2 | Reference value (few properties) · 1 month only |
| Shimanto City | Value-oriented | ¥6,942 | ¥5,850–¥9,194 | 10 | 29 | |
| Susaki City | Value-oriented | ¥6,067 | ¥5,708–¥6,869 | 4 | 6 | |
| Toyo Town | Value-oriented | ¥5,450 | ¥4,051–¥6,647 | 2 | 9 | Reference value (few properties) |
| Sukumo City | Value-oriented | ¥4,852 | ¥4,320–¥5,387 | 6 | 15 | |
| Aki City | Value-oriented | ¥4,661 | ¥3,972–¥6,362 | 3 | 9 | |
| Otsuki Town | Value-oriented | ¥4,417 | ¥3,015–¥11,724 | 1 | 4 | Reference value (few properties) · 7 months only |
Tier 1 is led by Kami City at ¥21,900 (4 properties in the estimate, 8 listed), the highest among municipalities with a meaningful number of properties. It is centred on onsen ryokan and small resort-style properties in the Monobe River basin, and its monthly min–max of ¥19,400–23,800 keeps the swing within 1.22×. Tosa City ¥24,200 (2 properties in the estimate), Niyodogawa Town ¥23,600 (2), Nakatosa Town ¥23,100 (1) and Tsuno Town ¥19,100 (1) also sit in this tier, but note that in each case the rates of one or two properties become the municipal value as they are. In other words, the “small-scale, high-rate properties of the river basins and coast” are not an area-wide market rate but scattered pockets of high rates created by individual properties.
Tier 2 is the coastal and suburban band at ¥8,000–11,000+; among municipalities with a meaningful number of properties, it includes Muroto City ¥8,600 (3 properties in the estimate), Tosashimizu City ¥8,100 (9) and Nankoku City ¥8,000 (3). Tier 3 is the prefectural capital, Kochi City, at ¥7,900 (60), whose depth of properties in the estimate stands out in the prefecture. Tier 4 consists of the hub cities of the west and east: Shimanto City ¥6,900 (10), Susaki City ¥6,100 (4), Sukumo City ¥4,900 (6) and Aki City ¥4,700 (3). In these cities the properties in the estimate are mainly business hotels, and they serve value-oriented business and touring demand.
The strength of seasonality also differs by tier. Kochi City ranges from ¥6,900 to ¥9,600 by month (max ÷ min = 1.38×); business demand supports the floor, so the swing is small. By contrast, Muroto City ranges ¥6,800–11,000 (1.62×), Shimanto City ¥5,900–9,200 (1.57×) and Tosashimizu City ¥6,700–10,100 (1.50×): the more a coastal city relies on tourism, the larger the gap between peak and off-peak. Sukumo City (1.25×) and Susaki City (1.20×) have modest rate levels but are notable for how stable they are throughout the year.
Breaking it down by segment — Kochi City has 4,376 business-hotel rooms; the outlying areas are dispersed among small ryokan and whole-house rentals
Behind the rate tiers lie differences in segment mix. Aggregating by segment the 274 properties and 9,028 rooms in the prefecture whose prices were confirmed on OTAs and similar channels over the last 12 months, business hotels account for 69 properties and 5,771 rooms, or 63.9% of rooms. Of these, 46 properties and 4,376 rooms are concentrated in Kochi City. The reason Kochi City’s rate sits almost exactly at the prefectural average is that this thick business-hotel stock forms the median.
The outlying areas (everything outside Kochi City) have 185 properties and 3,296 rooms, and a completely different mix. There are 35 ryokan with 561 rooms and 7 resort hotels with 386 rooms, while vacation rentals and cottages number 46 properties but only 84 rooms (1.8 rooms per property on average). By property count, the outlying areas lean heavily towards whole-house rentals and minshuku; by room count, ryokan and a handful of resorts carry the high-rate tier.
Next, we organised the 130 properties and 8,019 rooms for which estimated settled ADR can be calculated by price band × segment. Price bands here are based on each property’s 12-month average estimated settled ADR.
| Price band | Kochi City properties / rooms | Main segments in Kochi City | Outlying areas properties / rooms | Main segments in outlying areas |
|---|---|---|---|---|
| Under ¥6k | 9 / 499 rooms | Business: 9 properties, 499 rooms | 14 / 556 rooms | Business: 6 properties, 456 rooms; ryokan: 7 properties, 72 rooms |
| ¥6–9k | 31 / 2,577 rooms | Business: 24 properties, 2,320 rooms; ryokan: 5 properties, 182 rooms | 27 / 1,066 rooms | Business: 12 properties, 751 rooms; ryokan: 11 properties, 153 rooms |
| ¥9–13k | 14 / 1,716 rooms | Business: 10 properties, 1,308 rooms; city: 3 properties, 368 rooms | 8 / 239 rooms | Business: 4 properties, 171 rooms; ryokan: 3 properties, 53 rooms; resort: 1 property, 15 rooms |
| ¥13–20k | 5 / 635 rooms | Business: 2 properties, 248 rooms; ryokan: 2 properties, 196 rooms; resort: 1 property, 191 rooms | 10 / 493 rooms | Ryokan: 8 properties, 204 rooms; resort: 2 properties, 289 rooms |
| ¥20k+ | 4 / 124 rooms | Ryokan: 3 properties, 123 rooms | 8 / 114 rooms | Ryokan: 6 properties, 79 rooms; resort: 1 property, 18 rooms |
| Total | 63 / 5,551 rooms | 67 / 2,468 rooms |
What this table shows is that the price distribution in the outlying areas splits in two, between “¥6–9k” and “¥13k and above”, and that the ¥9–13k band in between is extremely thin at 8 properties and 239 rooms. High rates in the outlying areas are carried by ryokan and resorts, and the low-to-mid bands by business hotels, so mid-priced limited-service hotels and casual ryokan have not formed a tier of their own. Kochi City is the reverse: its upper band is thin, with 9 properties and 759 rooms at ¥13,000 and above (13.7% of rooms in the estimate).
The nature of supply — rooms within 5km of central Kochi +7.6% in 9 years; 2026 openings are one large hotel and 10 small ones
Movement on the supply side is gradual. Rooms within a 5km radius of Harimayabashi grew from 5,350 rooms at 68 properties in 2017 to 5,757 rooms at 82 properties in 2026, +7.6% in 9 years. After rising to 5,689 rooms in 2020, the count fell to 5,541 in 2024 and turned upward again in 2026.
The 2026 increase was driven by a 209-room business hotel that opened in Kochi City in February, adding 4.1% to the prefecture’s existing 64 business hotels with 5,116 rooms. There are 11 openings with 223 rooms in the prefecture in 2026 (including one scheduled for October), but apart from the 209-room property, the other 10 are small properties of 1–3 rooms, totalling just 14 rooms.
| 2026 openings in the prefecture (segment) | Openings | Rooms | Per opening |
|---|---|---|---|
| Business hotel | 1 | 209 rooms | 209 rooms |
| Vacation rental | 7 | 8 rooms | 1–2 rooms |
| Ryokan | 1 | 3 rooms | 3 rooms |
| Glamping | 1 | 2 rooms | 2 rooms |
| Campground | 1 | 1 room | 1 room |
| Total | 11 | 223 rooms |
In other words, new supply in 2026 is polarised between “one large business hotel in the capital” and “an accumulation of whole-house rentals and small inns in the outlying areas”; no new inns of 10–30 rooms have been observed in the outlying areas. 2025 was similar: apart from a 158-room business hotel that opened in Susaki City in September, openings were mainly guesthouses and vacation rentals of 1–6 rooms. The construction-plan data we reference (MLIT Building Construction Statistics) showed no large lodging projects in Kochi Prefecture as of the survey date. Note, however, that this data is based on building-confirmation applications and skews towards projects above a certain size, so small projects and plans not yet at the application stage are not included.
Let us check the effect of added supply on prices. Kochi City’s estimated settled ADR grew strongly from September 2025 to January 2026, at +7.4% to +15.6% YoY, but from February 2026, when the 209 rooms were added, growth slowed to −0.3% to +6.7%. Note, however, that spring and summer 2025, the comparison base, was a period when tourism in the prefecture was lifted by the broadcast of the NHK morning drama Anpan, so the high base is also likely contributing to the slower growth. Out-of-prefecture visitors to Kochi numbered 4.57 million in 2025 (+3% YoY), the second-highest level under the current estimation method.
Demand and supply — estimated OCC of 89.7% in August 2026, the highest of Shikoku’s four prefectures
Compare how tight demand and supply are using estimated OCC. In August 2026 Kochi Prefecture came in at 89.7% (89 properties / 4,959 rooms, listed on major booking sites), above Tokushima at 87.4%, Ehime at 85.0% and Kagawa at 83.9%. In June and July too, Kochi was at the highest level of the four Shikoku prefectures. By segment, business hotels in August were at 88.3% (30 properties / 3,192 rooms) and ryokan also at 88.3% (22 properties / 656 rooms), so both segments are high.
| Prefecture | June 2026 | July 2026 | August 2026 | August coverage |
|---|---|---|---|---|
| Kochi | 79.7% | 84.5% | 89.7% | 89 properties / 4,959 rooms |
| Tokushima | 79.6% | 79.7% | 87.4% | 77 properties / 3,585 rooms |
| Ehime | 76.6% | 80.7% | 85.0% | 149 properties / 8,072 rooms |
| Kagawa | 73.4% | 77.5% | 83.9% | 133 properties / 5,694 rooms |
The gap between peak days and weekdays can be seen in the booking curves. On August 11 (Tue, public holiday), the second day of the main Yosakoi Festival, estimated OCC had already reached 95.2% at LT45 and stayed nearly full through to 99.6% at LT1. The weekday of August 26 (Wed), by contrast, started at 56.3% at LT45 and built up towards the stay date, reaching 73.8% at LT7 and 87.9% at LT1. Saturday, August 22 sat in between, rising from 70.2% at LT45 to 98.2% at LT1.
Peak days such as festivals and holiday weekends are almost full 45 days out, so the room to raise rates on those dates is decided by “which price band’s inventory you hold in depth ahead of time”. The next section tests this by overlaying how quickly each price band sold out with its room count.
Identifying the gap — the ¥9–13k band in the outlying areas has 239 rooms, and 94% sold out 30+ days ahead of Yosakoi
Here we use inventory movements over peak periods to look for price bands that sell out early yet have limited rooms. We cover two periods, the Yosakoi Festival (4 nights, August 9–12, 2026) and Golden Week (4 nights, May 2–5, 2026), both of which are past, so the results are final. Among properties with inventory data, those whose OTA allocation is 30% or more of total rooms (65 properties for Yosakoi; the top 100 of 105 properties for Golden Week) were grouped by price band of estimated settled ADR.
| Area × price band | Supply (in estimate) | Yosakoi period sold out 30+ days ahead | Of which sold out from 45+ days ahead | Golden Week reached sell-out |
|---|---|---|---|---|
| Outlying, under ¥6k | 14 properties, 556 rooms | 10 / 13 dates (77%) | 8 dates | 4 / 18 dates (22%) |
| Outlying, ¥6–9k | 27 properties, 1,066 rooms | 22 / 44 dates (50%) | 20 dates | 13 / 57 dates (23%) |
| Outlying, ¥9–13k | 8 properties, 239 rooms | 15 / 16 dates (94%) | 14 dates | 8 / 15 dates (53%) |
| Outlying, ¥13k+ | 18 properties, 607 rooms | 20 / 24 dates (83%) | 18 dates | 6 / 23 dates (26%) |
| Kochi City, ¥6–9k | 31 properties, 2,577 rooms | 9 / 16 dates (56%) | 4 dates | 35 / 73 dates (48%) |
| Kochi City, ¥9–13k | 14 properties, 1,716 rooms | Only 1 property | — | 20 / 33 dates (61%) |
| Kochi City, ¥13k+ | 9 properties, 759 rooms | None observed | — | 4 / 7 dates (57%) · 2 properties |
In the outlying areas’ ¥9–13k band, 15 of the 16 dates observed during Yosakoi (94%) sold out 30 or more days before the stay date, and 14 of those were already sold out 45 or more days ahead. During Golden Week too, the share of dates reaching sell-out was 53%, more than double the other price bands in the outlying areas (22–26%). Yet this band has only 239 rooms in the estimate, 9.7% of the outlying total. The sample is small at 4–5 properties, but the same tendency showing up across two finalised peaks can be read as a signal that the rooms available to absorb demand are limited.
In Kochi City, 61% of dates in the ¥9–13k band and 57% at ¥13,000 and above reached sell-out during Golden Week, outperforming the core ¥6–9k band (48%). Kochi City’s ¥13k+ band has 9 properties and 759 rooms (13.7% of rooms in the estimate), so the upper band is not deep. However, observations at ¥13,000 and above cover only 2 properties, so no conclusion as strong as for the outlying areas can be drawn; it is treated strictly as a candidate.
SaturatedWell-filled segment
Kochi City, ¥6–9k business hotels
24 properties, 2,320 rooms. The largest stock in the prefecture, with small monthly rate swings and business demand supporting the floor.
Gap 1Mid-price band in the outlying areas
¥9–13k × ryokan and small resorts
8 properties, 239 rooms. During Yosakoi, 94% of dates sold out 30+ days ahead. A tier where no new builds of 10–30 rooms have been observed.
Gap 2Upper band in Kochi City
¥13k+ × ryokan and upscale limited-service
9 properties, 759 rooms (13.7%). 57% of dates sold out in Golden Week. Room to lift the rate band by renovating business-hotel stock.
Site assessment — comparing 4 locations on residents, workers, land prices and tsunami inundation
To see in which locations the gap bands are most likely to work, we compare four points: the centre of the prefectural capital (Harimayabashi), Nakamura in Shimanto City and Tosashimizu in the west, and Muroto in the east. Resident population is counted within a 1,500m radius and working population within 1,000m; land prices are from the nearest commercial official land price point; and for tsunami and flooding we checked whether the representative point falls within an assumed inundation area in MLIT’s published data.
| Item | Central Kochi (Harimayabashi) | Shimanto City (Nakamura) | Tosashimizu City (around city hall) | Muroto City (around city hall) |
|---|---|---|---|---|
| Resident population (1,500m radius, 2025) | 34,828 | 10,810 | 3,800 | 3,185 |
| Population change to 2040 (vs 2020) | −19.7% | −22.3% | −39.0% | −48.9% |
| Elderly share (2025) | 34.3% | 35.2% | 48.1% | 52.1% |
| Employees (1,000m radius) | 25,911 | 4,848 | 1,874 | 1,227 |
| Establishments / office-type share | 2,881 / 21.1% | 808 / 11.1% | 348 / 4.9% | 241 / 5.8% |
| Official land price (2026, commercial) | ¥171,000/m² Honmachi 5-chome, +0.6% | ¥47,100/m² Nakamura Tenjinbashi, −0.4% | ¥32,000/m² Tenjin-cho, −1.2% | ¥34,200/m² Ukitsu, −1.4% |
| Tsunami inundation (representative point) | Outside area (a 0.3–under 1m zone about 60m away) | Outside area | 3m to under 5m | 1m to under 2m |
| Flood inundation (maximum assumed scale) | Within area (Kagami River) | Within area (Shimanto and Ushiro rivers) | Representative point not affected | Representative point not affected |
| Location type | Combined business and tourism hub | Business and touring hub for the west | Tourist destination (coast and cape) | Tourist destination (geopark and coast) |
The differences in the numbers are clear. Central Kochi concentrates 25,911 employees and 2,881 establishments within a 1,000m radius, and its office-type share of 21.1% is far above the other points in the prefecture. The way weekday business demand underpins business-hotel occupancy also shows up in the small monthly rate swings. Nakamura in Shimanto City has 4,848 employees, giving it depth as a business and touring hub for the west of the prefecture. Tosashimizu and Muroto, by contrast, have 1,200–1,900 employees and an office-type share of around 5%, so business demand is limited and lodging demand follows the seasonality of tourism.
Resident population in central Kochi is projected to fall from 34,828 in 2025 to 29,645 in 2040 (−19.7% vs 36,912 in 2020), but the two coastal points in the outlying areas face much steeper declines of −39.0% (Tosashimizu) and −48.9% (Muroto). When considering a small new build in the outlying areas, it is the operating side rather than the demand side, namely securing staff and the operating model (unstaffed operation, joint operation with nearby properties and so on), that sets the assumptions of the revenue plan.
Land prices show the difference in entry point for investment. Commercial land at Honmachi 5-chome in Kochi City rose modestly from ¥168,000/m² in 2021 to ¥171,000/m² in 2026 (+1.8% vs 2021), and the prefecture’s highest point, Honmachi 1-chome, is at ¥273,000/m² (+3.0% YoY). The three outlying points, on the other hand, declined gently by 2.5–6.4% over five years, with Tosashimizu and Muroto in the low ¥30,000s. In the outlying areas, where land accounts for a small share of cost, most of the total investment goes into the building and interiors, so construction cost estimates and room-rate design sit at the centre of the economics.
On the disaster side, the representative points of coastal Tosashimizu (3m to under 5m) and Muroto (1m to under 2m) fall within tsunami inundation assumption areas. The representative points of central Kochi and Nakamura in Shimanto City are outside the tsunami assumption areas, but both fall within flood inundation assumption areas at the maximum assumed scale. Because the type of hazard differs by location, the practical point is to vary what goes into building specifications and BCP by site, such as placing electrical equipment on upper floors and evacuation planning.
Investment implications — acquire and renovate in Kochi City, small new builds in the outlying areas
Now to connect the analysis so far to investment approaches. The thick business-hotel stock of Kochi City and the small-scale, high-rate properties of the outlying areas are completely different in character, and the approaches that suit them differ too.
| Item | Acquire and renovate (Kochi City) | Small new build (outlying river basins and coast) |
|---|---|---|
| Target stock | 46 business hotels, 4,376 rooms (75.8% of business-hotel rooms in the prefecture) | 185 properties, 3,296 rooms in the outlying areas; vacation rentals and cottages are 46 properties with 84 rooms |
| Target price band | Lift from the ¥6–9k band (2,577 rooms) to ¥13k and above | ¥9–13k band (currently 8 properties, 239 rooms) |
| Demand evidence | 25,911 employees (1km radius); 57–61% of dates in the ¥9k+ bands sold out in Golden Week | 94% of dates sold out 30+ days ahead during Yosakoi; 53% reached sell-out in Golden Week |
| Rate stability | Monthly ¥6,900–9,600 (1.38×) | Tosashimizu 1.50×, Muroto 1.62×, Shimanto City 1.57× |
| Land / entry price | Commercial land ¥171,000/m² (Honmachi 5-chome, +0.6%) | ¥32,000–47,100/m² (−0.4% to −1.4% YoY) |
| Site caveats | Flood inundation assumption area (Kagami River); tsunami zone nearby | Coastal representative points in 1–under 5m tsunami inundation zones; 2040 population −39% to −49% |
| Keys to success | Maintain existing business demand while adding upper-grade rooms to lift rates on weekends and event days | Secure peak-season inventory at 10–30 rooms, and hold rates in the off-season by pairing stays with food and experiences |
In Kochi City, the business demand that supports weekdays is already thick and monthly rate swings are small. Rather than piling up rooms through new construction, then, acquiring an existing business hotel and renovating some rooms to a higher grade to extend the rate band from ¥9–13k to ¥13k and above is the approach most consistent with demonstrated demand. Several dates a year, such as the Yosakoi Festival and Golden Week, are almost full 45 days out, and upper-grade rooms can take on the role of lifting rates on those dates.
In the outlying areas, the existing high-rate tier is limited to a small number of ryokan and resorts, and new openings in 2025–2026 have been skewed towards whole-house rentals of 1–3 rooms. The inns in between, at 10–30 rooms and ¥9–13k, have limited rooms relative to how quickly they sell out in peak periods, making this the tier where the numbers most clearly point to a small new-build investment opportunity. However, with a peak-to-off-peak gap of 1.5–1.6× and rapid population decline, the prerequisite is to design, as a set, peak-season inventory, off-season demand creation and an operation that can run with a small team.
Summary
Lodging rates in Kochi Prefecture fall into four tiers: small-scale, high-rate properties in the river basins and on the coast (Kami City ¥21,900 and others); mid-rate coastal and suburban areas (Muroto City ¥8,600, Tosashimizu City ¥8,100); the business-and-tourism core of the capital (Kochi City ¥7,900); and value-oriented hubs in the west and east (Shimanto City ¥6,900, Sukumo City ¥4,900, Aki City ¥4,700). Kochi City holds 63.5% of the prefecture’s rooms, centred on 4,376 business-hotel rooms.
By segment × price band, the ¥9–13k band in the outlying areas is thin at 8 properties and 239 rooms, and during Yosakoi 94% of its dates sold out 30 or more days before the stay date. In Kochi City, the upper band at ¥13,000 and above is thin at 759 rooms (13.7%). Estimated OCC in August 2026 was 89.7%, the highest of Shikoku’s four prefectures, so demand and supply are tight. As investment approaches, lifting the rate band by acquiring and renovating business-hotel stock in Kochi City, and small new builds of 10–30 rooms in the outlying areas, are each consistent with the data.
Note on the data: Estimated settled ADR in this article covers confirmed months (September 2025 to August 2026) and is based on data as of the survey date (September 15, 2026). Municipal values in the outlying areas may be based on only 1–2 properties, and the composition of a single property can change the value substantially. Estimated OCC, booking curves and sell-out tests are estimates based on inventory sold on OTAs and similar channels, and differ from each property’s actual occupancy. Sell-out tests are limited to properties whose OTA allocation is 30% or more of total rooms. New openings are based on confirmed OTA listings and do not include properties not yet listed.
Related Articles
References and Sources
■ Data sources
Aggregated data from MetroEngines Research & Consulting (estimated settled ADR: 25 municipalities in Kochi Prefecture, 12 confirmed months, September 2025 to August 2026; segment mix: N=274 properties / 9,028 rooms; estimated OCC: June–August 2026, four Shikoku prefectures; inventory movements in peak periods; new openings from confirmed OTA listings). Site assessment uses MLIT National Land Numerical Information and the Real Estate Information Library, and the MIC / METI Economic Census for Business Activity (2021). Survey date: September 15, 2026.
■ Calculation assumptions
Municipal estimated settled ADR is the simple average over the 12 confirmed months of the monthly median of properties covered. Price bands (under ¥6k / ¥6–9k / ¥9–13k / ¥13k+) are based on each property’s 12-month average. Sell-out is judged by the lead time at which remaining inventory first reached zero, limited to properties whose OTA allocation is 30% or more of total rooms. Resident population is counted within a 1,500m radius and employees within a 1,000m radius. This article does not calculate yields, IRR or other return estimates.
■ Limitations and caveats
Estimated settled ADR and estimated OCC are estimates based on inventory sold on OTAs and similar channels, and differ from each property’s actual settled prices and occupancy. Municipal values in the outlying areas may be based on only 1–2 properties and are treated as reference values. New openings do not include properties not yet listed. Tsunami and flood inundation assumptions are judged at representative points and are not assessments of individual sites.
■ Market data
- MetroEngines Research & Consulting — estimated settled ADR (25 municipalities in Kochi Prefecture, 12 confirmed months), segment mix (N=274 properties / 9,028 rooms), estimated occupancy (OCC), booking curves, inventory movements in peak periods, new openings (confirmed OTA listings)
■ Government statistics and public data
- MLIT Real Estate Information Library — official land prices (2021–2026), tsunami inundation assumptions, flood inundation assumption areas
- MLIT National Land Numerical Information — 250m-mesh future population projections
- MIC / METI Economic Census for Business Activity (2021)
- MLIT Building Construction Statistics
- Kochi Prefecture, Survey of Out-of-Prefecture Tourist Arrivals and Movements (in Japanese)
- Kochi City, Official Land Prices
■ News and event information
- Yosakoi Festival official site, “2026 73rd Yosakoi Festival schedule” (in Japanese)
- Nikkei, “Out-of-prefecture visitors to Kochi up 3% to 4.57 million in 2025, helped by morning drama and cruise ships” (in Japanese)
- Kochi Shimbun, “4.57 million enjoyed Kochi: out-of-prefecture visitors in 2025 were the second-highest ever” (in Japanese)