

Fiscal 2027 (Reiwa 9) is a base year for Japan’s fixed asset tax revaluation. Land assessed values will be reset to roughly 70% of official land prices as of January 1, 2026, and that level becomes the tax base for the three fiscal years 2027–2029. Between 2023 and 2026, commercial land prices in hotel locations rose +39.2% in Kutchan, +52.5% in central Kyoto and +134.3% in Hakuba Village. This article estimates, ahead of time, how much this land price surge will move holding taxes per room from fiscal 2027 onward, using the Ministry of Land, Infrastructure, Transport and Tourism (MLIT) official land price data and our own room rate data.
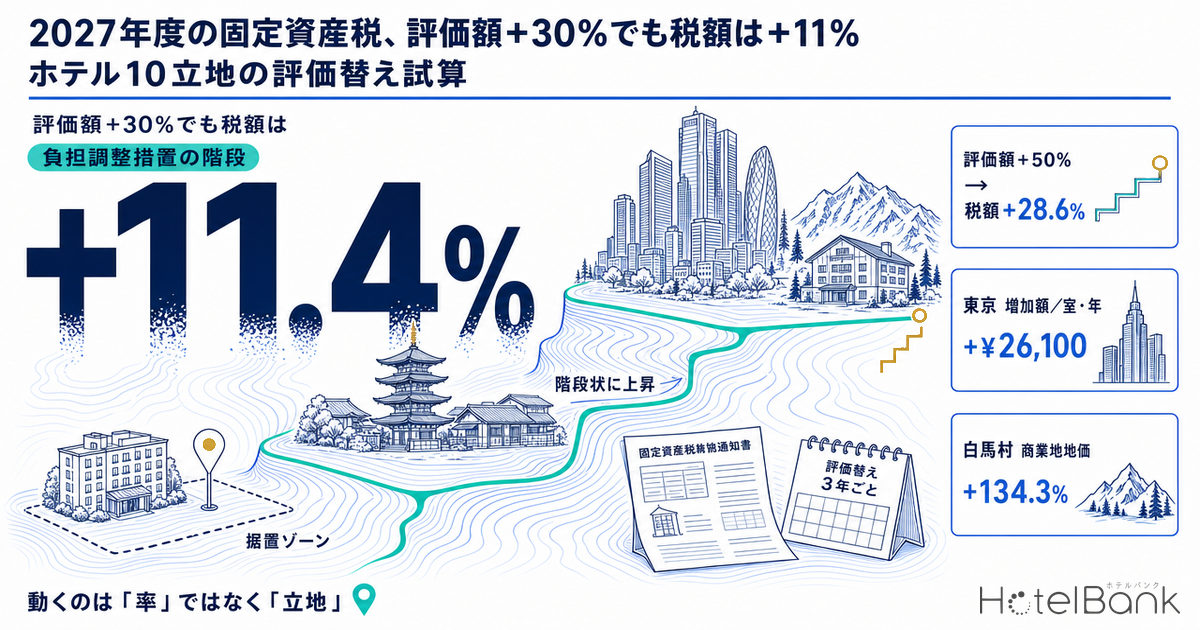
The conclusion first: when assessed values rise, taxes do not rise at the same rate. Because the burden adjustment measures for commercial land work like a staircase, a +10% rise in assessed value leaves the tax unchanged for all three years, +30% lifts it by only +11.4% in the third year, and +50% by +28.6%. At the same time, in central Tokyo and Hakata, where land prices are high to begin with, the increase reaches ¥20,000–26,000 per room per year (¥2.0–2.6 million a year for 100 rooms), equal to 1.8–2.3% of rooms GOP. What drives the impact is not the rate but the location.
Scope of This Article
Our earlier analyses covered the current level of hotel holding taxes (about ¥160,000–240,000 per room per year, trimming NOI yield by roughly 0.7pt) and the tax relief schemes available to hotels (such as 48% bonus depreciation and three-year fixed asset tax exemptions). This article covers neither. It deals only with the change caused by a single scheduled event: the fiscal 2027 revaluation. It is about the delta, not the level.
Metric Definitions Used in This Article
- ADR (Average Daily Rate): An estimated transacted rate (tax-exclusive equivalent), calculated by applying a property-type correction factor to the lowest published plan rate on major booking sites (per room, two guests, tax-inclusive). Validated against property-level results disclosed by listed hotel REITs (91 properties, most recent 3 months), the median error is about 7%. These are estimates and differ from each property’s actual transacted prices and accounting figures. Area-level ADR is the median of the covered properties (the level of a typical property in the area). To align seasonality, this article compares July 2023 with July 2026; both are finalized months.
- Official land price: The benchmark site price (¥/㎡) from MLIT’s Land Price Publication (Chika Koji). We extracted only commercial benchmark sites, including hotel locations, and matched the same benchmark sites in the 2023 and 2026 publications to compute three-year changes (sites that were replaced were excluded).
- Fixed asset tax assessed value (land): Set at roughly 70% of official land prices. The taxable base is the tax base after burden adjustment measures; for commercial land it is capped at 70% of assessed value.
- Holding taxes: Estimated at a combined 1.7% (standard rates): fixed asset tax 1.4% plus city planning tax 0.3%. The estimates in this article cover land only and exclude buildings and depreciable assets.
- Data sources: MLIT Real Estate Information Library (Land Price Publication); MetroEngines Research & Consulting
- — A +30% rise in assessed value raises tax by only +11.4%. Because the burden adjustment measures for commercial land work like a staircase, +10% means zero change for three years, and even +50% means only +28.6% by the third year.
- — The next base year is fiscal 2027. The tax base is land prices as of January 1, 2026, and once set it stays fixed for the three fiscal years 2027–2029.
- — Commercial land prices across 10 hotel locations rose +11.1% (Kanazawa) to +134.3% (Hakuba) over three years. Only Kanazawa is likely to stay in the freeze zone with no tax change.
- — The increase per room ranges from ¥0 to ¥26,100 a year. Hakuba has the highest rate (+50.2%) but Tokyo has the largest amount. The right yardstick is not the rate but the share of rooms GOP (Tokyo 2.25%, Kyoto 1.90%, Fukuoka 1.75%).
- — Building assessed values do not rise. Thanks to the age-depreciation adjustment and the rule freezing existing buildings at the prior-year value, it is safe to assume only land moves in fiscal 2027.
What Happens in Fiscal 2027 — Three Premises of the System
Start with the framework. If you misread it and treat the land price growth rate as the tax growth rate, your estimate will always come out too high.
First, revaluation happens every three years, and the next one is fiscal 2027. According to the Ministry of Internal Affairs and Communications (MIC), land is in principle revalued every base year (every three years), and values in the second and third years (the freeze years) are held at the base-year value. Fiscal 2024 (Reiwa 6) was the most recent base year, so the next is fiscal 2027 (Reiwa 9). The valuation is based on land prices as of January 1 of the year before the assessment date, that is, land prices as of January 1, 2026. In this sense, the official land prices published in March 2026 can be read as a leading indicator of fiscal 2027 assessed values.
Second, residential and commercial land is assessed at roughly 70% of official land prices. This practice was introduced with the fiscal 1994 revaluation and sets assessed values at about 70% of official land prices, real estate appraisal values and similar benchmarks. So if official land prices rise +50%, assessed values also rise by roughly +50%. Up to this point, the relationship is proportional.
Third, however, taxes are not proportional. Commercial land (land other than residential land) is subject to burden adjustment measures. Depending on the burden level (prior-year taxable base ÷ current-year assessed value), the taxable base is set in one of three ways.
| Burden level (prior-year taxable base ÷ current-year assessed value) | Current-year taxable base | Tax movement |
|---|---|---|
| Above 70% | Assessed value × 70% (cap) | Decrease |
| 60% to 70% (freeze zone) | Prior-year taxable base held | No change |
| Below 60% | Prior-year taxable base + assessed value × 5% (capped at 60%, floored at 20% of assessed value) | Gradual rise in 5% steps per year |
Source: Prepared by MetroEngines Research & Consulting based on MIC, “Overview of Fixed Asset Tax,” and Tokyo Metropolitan Government Bureau of Taxation, “Burden Adjustment Measures for Commercial Land”
The key is the freeze zone. According to MIC, after equalization efforts since fiscal 1997, the burden levels of commercial land had nearly all converged into the 60–70% range covered by the freeze provision as of fiscal 2020. In other words, it is reasonable to assume that most hotel sites are currently taxed at a burden level around 70%. What happens when the assessed value rises from here? Only the denominator, the assessed value, jumps, so the burden level mechanically falls. With a +10% rise in assessed value, 70% ÷ 1.10 = 63.6%, which stays within the freeze zone, so the tax does not move at all for three years. With a +30% rise, it falls to 53.8%, drops into the below-60% zone, and begins rising in 5% steps each year.
+10% Assessed Value Means ±0 Tax, +50% Means +28.6% by Year 3 — The Burden Adjustment Staircase
Starting from a site whose burden level had converged at 70% as of fiscal 2026, we simulated tax trends for fiscal 2027–2029 by assessed value growth rate. Because assessed values are held at the base-year level, the denominator stays fixed throughout the three years.
Source: Estimates by MetroEngines Research & Consulting based on the burden adjustment rules in MIC, “Overview of Fixed Asset Tax”
The different shapes of the three lines are the central finding of this article. The +10% case stays flat. It falls inside the freeze zone, so even if land prices rise 10%, holding taxes do not increase by a single yen. The +30% case rises +9.3% in the first year and +11.4% in the second year, then stops, because it hits the cap of 60% of assessed value. Only the +50% case keeps rising for all three years, climbing the staircase at +10.7% in the first year, +21.4% in the second and +28.6% in the third.
Two practical implications follow. One is that there is strong non-linearity between the growth rate of assessed value and the growth rate of tax. Between +10% and +30% lies a discontinuity where the tax jumps from zero to the high single digits. The other is that the increase does not arrive all at once in the first year. In the +50% case, the third-year increase is 2.7 times the first-year increase. If you look only at the fiscal 2027 tax bill and conclude “it did not rise as much as expected,” you will hit an unexpected level in fiscal 2029. NOI projections at acquisition and settlements with sellers need to factor in all three steps of the staircase.
Land Prices at 10 Hotel Locations Rose +11% to +134% in Three Years — Mapping the Epicenters of the Revaluation
Next, we look at which locations are likely to see how much change in assessed value. From MLIT’s official land prices, we extracted commercial benchmark sites that include major hotel locations and matched the same benchmark sites in 2023 and 2026 to compute the median three-year change. Sites that were replaced were excluded.
Circle size = 2026 official land price (commercial median); color = three-year change. Source: Prepared by MetroEngines Research & Consulting based on MLIT Real Estate Information Library (Land Price Publication)
Source: MLIT Real Estate Information Library (Land Price Publication); MetroEngines Research & Consulting
Of the 10 locations, only Kanazawa (+11.1%) is likely to stay within the freeze zone (meaning no tax change in fiscal 2027). Naha (+19.5%) sits on the boundary, dipping slightly into the below-60% zone, while the six locations from Sapporo (+28.4%) to Tokyo (+47.7%) clearly enter the rising zone. Central Kyoto (+52.5%) and Hakuba Village (+134.3%) form the group that keeps climbing for all three years.
Note that the gap between sites within the same city is large. Across 35 sites in Fukuoka, changes ranged from a minimum of +2.2% to a maximum of +54.4%; across 24 sites in Osaka, from +15.6% to +91.9%. Using the area median as a proxy for your own site can err in either direction. In practice, the reliable approach is to check the benchmark sites or prefectural survey sites closest to your own land individually. The prefectural land price survey (Kijun Chika), which measures prices as of July 1 each year and is published in September, shows the same trend for commercial land in tourist areas: Hakuba +29.3% and Takayama +28.1% in the 2026 survey.
Land Prices and ADR Are Not Moving Together — A Three-Year Comparison Across 10 Locations
Holding taxes track land prices; revenue tracks ADR. If both moved at the same rate, the revaluation would be effectively neutral. So we lined up estimated transacted ADR over the same three years (July 2023 → July 2026).
| Location (commercial benchmark sites) | Sites | Official land price 2026 (¥/㎡) |
Land price 3-yr change |
ADR Jul 2026 |
ADR 3-yr change |
Gap |
|---|---|---|---|---|---|---|
| Hakuba Village (Nagano) | 1 | 40,300 | +134.3% | ¥11,700 | +15.9% | -118.4pt |
| Kyoto (Shimogyo / Minami wards area) | 15 | 724,000 | +52.5% | ¥11,800 | +5.6% | -46.9pt |
| Tokyo (Shinjuku / Shibuya / Nakano area) | 35 | 2,200,000 | +47.7% | ¥13,300 | +13.3% | -34.4pt |
| Osaka (Minami / Naniwa ward area) | 24 | 1,032,000 | +38.9% | ¥9,800 | -3.0% | -41.9pt |
| Kutchan Town (Niseko) | 1 | 181,000 | +39.2% | ¥17,500 | +2.5% | -36.7pt |
| Karuizawa Town (Nagano) | 2 | 158,900 | +33.5% | ¥24,700 | -2.4% | -35.9pt |
| Fukuoka (Hakata / Chuo ward area) | 35 | 2,070,000 | +42.3% | ¥13,100 | +22.3% | -20.0pt |
| Sapporo (Chuo ward area) | 29 | 755,000 | +28.4% | ¥18,100 | +35.0% | +6.6pt |
| Naha (Okinawa) | 13 | 474,000 | +19.5% | ¥10,100 | +20.1% | +0.6pt |
| Kanazawa (Ishikawa) | 12 | 297,500 | +11.1% | ¥8,700 | +6.2% | -4.9pt |
Land price = median of the same commercial benchmark sites in MLIT Real Estate Information Library (Land Price Publication). ADR = estimated transacted ADR (July 2023 and July 2026, both finalized months; N = 21–194 properties). Source: MetroEngines Research & Consulting
Only two cities, Sapporo and Naha, saw ADR growth keep pace with land price growth. In Sapporo, ADR rose +35.0% against land prices of +28.4%, one of the few markets where revenue has led. In Naha the two are nearly even at +20.1% versus +19.5%. In these two cities, revenue growth can absorb the holding tax increase from the revaluation.
In Hakuba Village, central Kyoto, Osaka Minami, Kutchan and Karuizawa, on the other hand, land price growth outpaced ADR growth by 36 to 118 points. The important point is that this gap does not signal a “profitability problem.” Land price gains in these locations have been driven heavily by demand from uses other than hotels (vacation homes, housing, retail, investment property). The 2.3-fold rise in Hakuba Village’s commercial benchmark site over three years cannot be explained by lodging demand alone. In other words, the tax base for holding taxes can move for reasons unrelated to a hotel’s earning power. That is why the revaluation needs to be priced in ahead of time.
A 100-Room Model — Land Holding Tax Moves ¥0 to ¥26,000 per Room a Year
We now translate the system and the land prices above into holding taxes per room for a 100-room hotel. The assumptions are as follows.
| Item | Assumption | Basis |
|---|---|---|
| Rooms | 100 | Same model as our earlier holding tax analysis |
| Gross floor area | 3,850㎡ (38.5㎡ per room) | 25㎡ guest rooms plus common areas; guest room share 65% |
| Floor area ratio / site area | By location (approx. 270–740% / approx. 520–1,440㎡) | Median designated floor area ratio of the relevant commercial benchmark sites |
| Assessed value | Official land price × 70% × site area | Land assessed at roughly 70% of official land prices |
| Current burden level | 70% (converged at the cap) | Commercial land has converged into the freeze zone (MIC) |
| Tax rate | 1.7% (fixed asset 1.4% + city planning 0.3%) | Standard rates |
| Assessed value growth | Three-year land price change at each location | As of January 1, 2026 = basis for fiscal 2027 valuation |
Source: MetroEngines Research & Consulting (model assumptions)
Under these assumptions, we compare land holding tax per room today (fiscal 2026) with the third year after revaluation (fiscal 2029).
Source: Estimates by MetroEngines Research & Consulting based on MLIT Real Estate Information Library (Land Price Publication) (100-room model, land only)
| Location | Current tax/room/yr |
FY2029 tax/room/yr |
Increase /room/yr |
Increase rate | 100-room total increase/yr |
Share of rooms GOP |
|---|---|---|---|---|---|---|
| Tokyo (Shinjuku / Shibuya area) | ¥98,100 | ¥124,200 | ¥26,100 | +26.6% | ¥2,610,000 | 2.25% |
| Fukuoka (Hakata area) | ¥91,700 | ¥111,900 | ¥20,200 | +22.0% | ¥2,020,000 | 1.75% |
| Kyoto (Shimogyo / Minami wards area) | ¥64,200 | ¥84,000 | ¥19,700 | +30.7% | ¥1,970,000 | 1.90% |
| Osaka (Minami area) | ¥44,600 | ¥53,100 | ¥8,500 | +19.1% | ¥850,000 | 0.99% |
| Sapporo (Chuo ward area) | ¥45,900 | ¥50,500 | ¥4,600 | +10.1% | ¥460,000 | 0.29% |
| Karuizawa Town | ¥19,000 | ¥21,700 | ¥2,700 | +14.4% | ¥270,000 | 0.13% |
| Kutchan Town (Niseko) | ¥13,900 | ¥16,600 | ¥2,700 | +19.3% | ¥270,000 | 0.18% |
| Hakuba Village | ¥2,800 | ¥4,100 | ¥1,400 | +50.2% | ¥140,000 | 0.14% |
| Naha | ¥43,300 | ¥44,300 | ¥1,100 | +2.4% | ¥110,000 | 0.12% |
| Kanazawa | ¥21,400 | ¥21,400 | ¥0 | ±0% | ¥0 | 0.00% |
Rooms GOP = estimated transacted ADR (July 2026) × 75% occupancy × 365 days × 32% GOP margin. Land-only estimate; excludes buildings and depreciable assets. Source: MetroEngines Research & Consulting
The absolute amount is determined by each location’s land price level and does not follow the ranking of increase rates. Hakuba Village’s +50.2% is the highest rate of the 10 locations, yet its increase per room, ¥1,400 a year, is among the smallest. Conversely, Tokyo’s +26.6% is mid-range, but its increase of ¥26,100 a year is the largest. The right unit for measuring the impact of revaluation is not the rate, but yen per room and the share of rooms GOP.
Measured against rooms GOP, four markets reach around 1% or more: Tokyo 2.25%, Kyoto 1.90%, Fukuoka 1.75% and Osaka 0.99%. For 100 rooms, that is an additional ¥0.85–2.61 million a year. This is roughly the same order of magnitude as the low end of the ancillary income we previously estimated from leasing hotel rooftops and idle parking (¥3.34–9.74 million a year), meaning a single new ancillary income stream could offset it. Put differently, adding one more revenue source ahead of fiscal 2027 is enough to absorb the effect of the revaluation.
Sensitivity Table — How Many Points Does NOI Yield Move at +10% / +30% / +50% Assessed Value?
Even before the land price change for your own site is known, you can estimate a range. Using a standard model (100 rooms, 400% floor area ratio, 962㎡ site, official land price ¥500,000/㎡), we show the tax and NOI yield impact at three levels of assessed value growth. Total investment is land (official land price × site area) plus building (¥2.405 million per tsubo × gross floor area), or about ¥32.8 million per room.
| Assessed value growth | Burden level (right after revaluation) |
FY2027 tax/room |
FY2029 tax/room |
Increase after 3 years |
Impact on NOI yield |
|---|---|---|---|---|---|
| Current (FY2026) | 70.0% | ¥40,100 | — | — | — |
| +10% (freeze zone) | 63.6% | ¥40,100 | ¥40,100 | ¥0 | ±0.00pt |
| +30% | 53.8% | ¥43,800 | ¥44,700 | ¥4,600 | -0.014pt |
| +50% | 46.7% | ¥44,400 | ¥51,500 | ¥11,400 | -0.035pt |
Standard model: 100 rooms / 400% floor area ratio / 962㎡ site / official land price ¥500,000/㎡ / total investment about ¥32.8 million per room. Building cost per tsubo uses the 2025 steel-frame figure of ¥2.405 million/tsubo based on MLIT’s Statistics on Building Construction Starts. Source: Estimates by MetroEngines Research & Consulting
The impact on NOI yield is at most 0.035pt, or 3.5 hundredths of a point. Compared with the drag from holding taxes as a whole that we estimated previously (0.7pt), the change caused by the revaluation is small relative to total investment. This is because the burden adjustment measures are working as intended. Since the system is designed to cushion sharp increases in burden, the revaluation is unlikely to reverse an investment decision on its own.
There are two caveats, however. First, while small relative to total investment, it is large relative to GOP. The ¥11,400 per room increase in the +50% case above equals 1.3% of rooms GOP (about ¥876,000 a year) for a hotel with a ¥10,000 ADR and 75% occupancy. That cannot be ignored at the operating P&L level. Second, this estimate assumes the current burden level has converged at 70%. If your site’s burden level is already below 60%, it is already rising in 5% steps each year before the revaluation, and the revaluation will extend that staircase further. Calculate the burden level from the taxable base and assessed value shown on your tax bill, and first confirm which zone your site is in.
The other axis is which burden level your site is currently at. The estimates so far started from 70%, the level commercial land has converged to. But a site whose burden level is below 60% is already rising in 5% annual steps before the revaluation, and it lands in a different place even at the same assessed value growth. The table below crosses the two axes.
| Current (FY2026) burden level | Assessed value +10% | Assessed value +20% | Assessed value +30% | Assessed value +40% | Assessed value +50% |
|---|---|---|---|---|---|
| 70% (top of freeze zone) | +0.0% | +2.9% | +11.4% | +20.0% | +28.6% |
| 65% | +1.5% | +10.8% | +20.0% | +29.2% | +34.6% |
| 60% (bottom of freeze zone) | +10.0% | +20.0% | +30.0% | +35.0% | +37.5% |
| 55% | +20.0% | +30.9% | +35.5% | +38.2% | +40.9% |
| 50% | +32.0% | +36.0% | +39.0% | +42.0% | +45.0% |
Each cell is the increase in FY2029 land holding tax versus today. Calculated by applying the burden adjustment measures (above 70% = reduced to 70% of assessed value / 60–70% = prior year held / below 60% = add 5% of assessed value each year, capped at 60%) for three consecutive years. Source: Estimates by MetroEngines Research & Consulting based on the burden adjustment rules in MIC, “Overview of Fixed Asset Tax”
Reading the table across shows that the cushion this article has described so far, “taxes do not rise at the same rate as assessed values,” works strongly only for sites at a 70% burden level. In the 70% row, +10% assessed value means ±0 tax, and even +30% means only +11.4%. In the 50% row, however, even +10% assessed value produces +32.0% three years later. The cushion is the freeze zone itself, and for sites already below the zone, there is no cushion.
Reading it down reveals another implication. When assessed value growth is large, at +50%, the outcomes range only 16.4 points, from +28.6% in the 70% row to +45.0% in the 50% row. The larger the rise in assessed value, the faster every row reaches the common ceiling of 60% of assessed value. In other words, checking your burden level matters most in locations where land prices have not risen much. Even in a location like Kanazawa with land prices up only +11.1%, a burden level in the 50% range could raise the tax by about 30%. Which cell of this table your site falls into can be settled with a single calculation from your tax bill: taxable base ÷ assessed value.
Buildings Move the Other Way — Age Depreciation and the “Prior-Year Freeze” Rule
Everything so far concerns land. Buildings are valued in an entirely different way and tend to move in the opposite direction.
Buildings are assessed using the replacement cost method: assessed value = replacement cost points × replacement cost adjustment rate × age-depreciation adjustment rate. The replacement cost adjustment rate is a coefficient that reflects changes in construction prices; for fiscal 2024 (Reiwa 6) it was set at 1.11 for wooden and 1.07 for non-wooden buildings. Given that construction costs keep rising, the fiscal 2027 rate is also likely to be set above 1.
Building taxes nonetheless tend not to rise because of the age-depreciation adjustment rate and the freeze rule. The age-depreciation adjustment lowers assessed value to reflect wear according to years since construction. And for existing buildings, even if the value calculated in a revaluation exceeds the prior-year assessed value, it is not raised but held at the prior-year value. In other words, a building’s assessed value either falls or stays the same; it never rises.
The practical conclusion is clear. If hotel holding taxes move in the fiscal 2027 revaluation, the source will be almost entirely land. Buildings can be budgeted as flat or slightly lower. Of the ¥160,000–240,000 per room per year holding tax level we have estimated previously, only the portion attributable to land carries variability risk.
Putting It into Practice — Three Checks Ahead of Fiscal 2027
Revaluation is a scheduled event that comes once every three years, and its content can largely be read from material already published: land prices as of January 1, 2026. Rather than being surprised after the fact, here are the checks to price it in beforehand.
| Check | What to look at | Decision point |
|---|---|---|
| 1. Your burden level | Taxable base ÷ assessed value on your tax bill | Around 70%: this article’s estimates apply. Below 60%: already on a rising path |
| 2. Three-year change at the nearest benchmark site | 2023 and 2026 official land prices (same benchmark site) | In the +10% range: tax likely unchanged. Above +30%: price in the three-year staircase |
| 3. Timing of acquisition or sale | Does the deal straddle the January 1, 2027 assessment date? | If so, reflect three years of tax on the new assessed value in NOI projections and price negotiations |
Source: MetroEngines Research & Consulting
Check 3 matters most in practice. For properties under consideration for acquisition in 2026, the NOI presented by the seller is likely calculated with fiscal 2026 holding taxes (current assessed values). In a location where taxes will rise from fiscal 2027, the sound approach is to build the price after factoring in that difference. Among this article’s 10 locations, Tokyo, Fukuoka and Kyoto could see a gap of around ¥20,000 per room per year, or about ¥2 million a year for 100 rooms. Capitalized at a 4% cap rate, that becomes an issue worth about ¥50 million in property value. For projects involving new construction or extensions, fixed asset tax reductions under municipal hotel attraction incentives may offset the revaluation increase in some cases.
Summary
The fiscal 2027 fixed asset tax revaluation resets the tax base to land prices as of January 1, 2026. Commercial land prices at hotel locations have diverged widely over the past three years, from +11.1% in Kanazawa to +134.3% in Hakuba Village, so assessed values will move very differently by location.
But rising assessed values do not pass straight through to taxes. Under the burden adjustment measures for commercial land, +10% assessed value leaves the tax unchanged for three years, +30% raises it by +11.4% by the third year, and +50% by +28.6%, in a staircase. Because the increase is not completed in the first year but builds up over three years, judging only by the fiscal 2027 tax bill will miss the fiscal 2029 level.
Per room, the increase ranges from ±¥0 in Kanazawa to ¥26,100 a year in Tokyo. The size of the rate and the size of the amount do not match; what should be judged is the share of rooms GOP. Tokyo (2.25%), Kyoto (1.90%) and Fukuoka (1.75%) are relatively large, equal to an additional ¥2.0–2.6 million a year for 100 rooms. That is also a scale a single new ancillary income stream could absorb, so there is ample room to respond.
For buildings, the age-depreciation adjustment and the rule that “holds values at the prior-year level” mean assessed values will not rise. It is safe to budget on the basis that only land moves in fiscal 2027. Since this is a scheduled event every three years, what is needed is an advance estimate so as not to be surprised.
References and Sources
■ Data Sources
Land prices: from commercial benchmark sites in MLIT’s Real Estate Information Library (Land Price Publication), we matched the same benchmark sites in 2023 and 2026 (1–35 sites per location) and computed the median three-year change. Room rates: estimated transacted ADR from MetroEngines Research & Consulting (July 2023 and July 2026; N = 21–194 properties). The framework of the system is based on MIC’s “Overview of Fixed Asset Tax” and “Fixed Asset Valuation Standards, Chapter 2: Buildings,” and on materials published by the Tokyo Metropolitan Government Bureau of Taxation, Osaka City and Hamamatsu City.
■ Model Assumptions
We assumed a 100-room hotel with 3,850㎡ gross floor area (38.5㎡ per room); site area was set as gross floor area ÷ the median designated floor area ratio at each location (approx. 270–740% / approx. 520–1,440㎡). Land assessed value was set at 70% of the official land price, the current burden level started at 70% (where commercial land has converged), and the taxable base was calculated in sequence for fiscal 2027, 2028 and 2029 under the burden adjustment measures (above 70% = reduced to 70% of assessed value / 60–70% = prior year held / below 60% = add 5% of assessed value each year, capped at 60%). The tax rate is the standard 1.7% (fixed asset tax 1.4% + city planning tax 0.3%). Rooms GOP was set as estimated transacted ADR (July 2026) × assumed occupancy of 75% × 365 days × 32% GOP margin.
■ Limitations
Estimates cover land only and exclude buildings and depreciable assets. Assessed value growth is proxied by each location’s three-year change in official land prices; actual fiscal 2027 assessed values are determined individually by each municipality. The 70% starting burden level is an assumption based on the nationwide convergence of commercial land; the actual burden level of your own site must be confirmed from the taxable base ÷ assessed value on your tax bill. Area medians average out site-level differences within the same city (+2.2% to +54.4% in Fukuoka, +15.6% to +91.9% in Osaka) and may diverge from individual sites. Estimated transacted ADR is an estimate derived by applying property-type correction factors to published rates on major booking sites and differs from each property’s actual transacted prices.
■ Systems and Regulations
- MIC, “Overview of Fixed Asset Tax” (Japanese) — revaluation base years, 70% assessment of land, burden adjustment measures, tax rates
- Tokyo Metropolitan Government Bureau of Taxation, “Burden Adjustment Measures for Fixed Asset Tax and City Planning Tax on Commercial Land (Land Other Than Residential Land) Will Continue” (Japanese)
- Osaka City, “Tax Burden Adjustment Measures (Fixed Asset Tax: Land)” (Japanese) — formula for burden levels below 60%
- MIC Local Tax Bureau, Asset Valuation Office, “How Fixed Asset Valuation Works (Land Valuation)” (Japanese)
- MIC, “Fixed Asset Valuation Standards, Chapter 2: Buildings” (Japanese) — replacement cost method, age-depreciation adjustment rate
- Hamamatsu City, “What Is the Fiscal 2024 Building Revaluation?” (Japanese) — replacement cost adjustment rate (wooden 1.11 / non-wooden 1.07), prior-year freeze treatment
- MIC Local Tax Bureau, Fixed Asset Tax Division, “On the Future of Burden Adjustment Measures” (May 22, 2025) (Japanese)
■ Public Data
- MLIT, “Real Estate Information Library” — official land prices (commercial benchmark sites, 2023 and 2026), zoning and designated floor area ratios
- MLIT, “Statistics on Building Construction Starts” — building cost per tsubo (2025 steel-frame figure: ¥2.405 million/tsubo)
■ Market Data
- MetroEngines Research & Consulting — estimated transacted ADR (July 2023 and July 2026; N = 21–194 properties; based on rates published on major booking sites), 100-room model holding tax estimates