

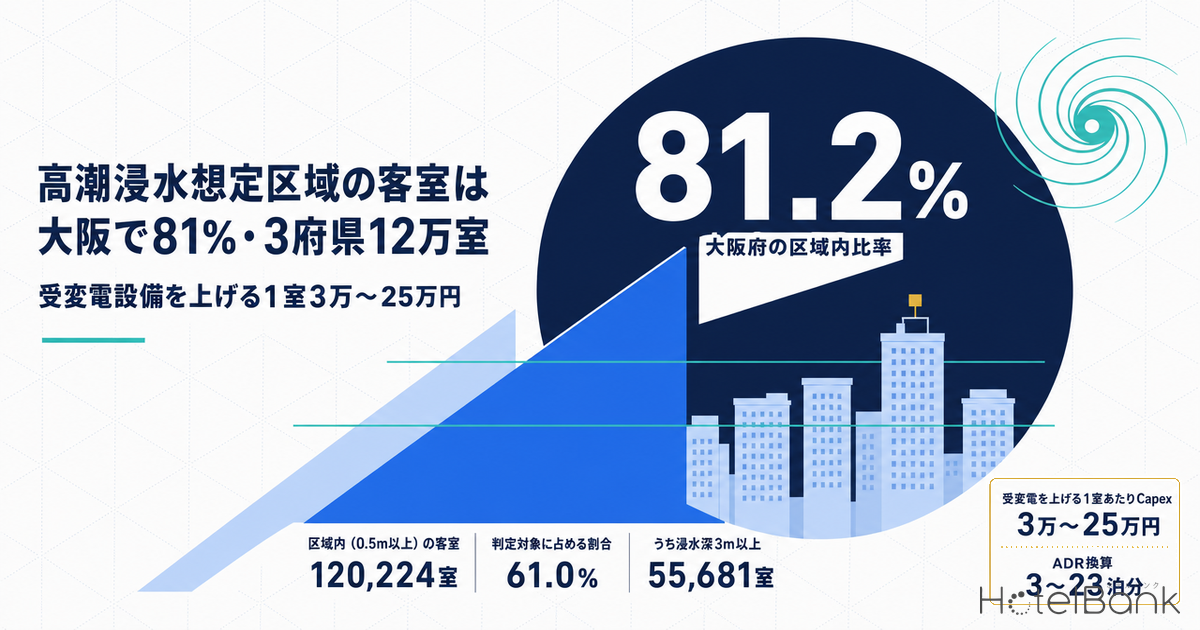
How many hotel rooms sit inside the zones that would flood in the “largest conceivable storm surge” along Osaka Bay and Ise Bay? We took the storm surge inundation zone data from the National Land Numerical Information (国土数値情報) for Osaka, Aichi and Mie, and matched the locations of 2,345 hotels with confirmed operations against the zone polygons. The result: 1,024 properties and 120,224 rooms lie in zones with an assumed inundation depth of 0.5m or more, or 61.0% of all rooms assessed. In Osaka Prefecture alone the share reaches 81.2%. This article maps the distribution of rooms by inundation-depth band and by property size, and presents an estimate of the Capex per room required to place substation (power receiving and transforming) equipment above the assumed inundation depth, based on published equipment cost ranges.
Metric Definitions Used in This Article
- ADR (Average Daily Rate): An estimated settled rate (tax-exclusive equivalent), calculated by applying a segment-specific adjustment factor to the lowest-plan price each property publishes on OTAs (per room, two guests, tax-inclusive). Checked against property-level results disclosed by listed hotel REITs (91 properties, most recent three months), the median error is about 7%. These are estimates and differ from each property’s actual settled prices and accounting figures. Area-level ADR is the median of the properties covered (the level of a typical property in the area). This article uses the median for September 2025–August 2026 (the 12 most recent finalized months).
- Storm surge inundation zone: A zone designated and published by each prefecture under the Flood Control Act, where flooding is expected from the largest conceivable storm surge (assuming failure of seawalls and levees). Inundation depth is shown in bands (e.g. 0.5m to under 3m).
- Properties assessed: Hotels, ryokan and similar properties located in Osaka, Aichi and Mie for which selling prices were observed on OTAs between September 2025 and August 2026 and room counts are known (N=2,345 properties, 197,137 rooms).
- Data sources: MetroEngines Research & Consulting; Ministry of Land, Infrastructure, Transport and Tourism (MLIT), “National Land Numerical Information (Storm Surge Inundation Zone Data)”
- — 120,224 rooms (61.0%) Of the 197,137 rooms assessed in Osaka, Aichi and Mie, the number located in storm surge inundation zones with an assumed depth of 0.5m or more. Of these, 55,681 rooms are in zones of 3m or more
- — Osaka: 81.2% With Kita Ward at 99.3% and Chuo Ward at 87.0%, the city-center lodging clusters of Umeda and Namba fall inside the zones, so “avoid the waterfront and you are outside the zone” rarely holds
- — Aichi 32.9%, Mie 30.4% In Nagoya, 93.8% of rooms in Nakamura Ward are inside the zones, versus 1.3% in Naka Ward, which includes Sakae. In Mie, exposure is concentrated in Yokkaichi and Kuwana
- — 70.9% in properties of 150+ rooms 85,286 of the in-zone rooms are in mid-to-large properties with high-voltage power supply, so flood protection for electrical equipment bears directly on asset value
- — ¥30,000–¥248,000 per room Capex per room to relocate substation equipment to upper floors or the roof (editorial estimate). Equivalent to 3–23 nights of estimated settled ADR, heaviest for the 150–299-room band
Conclusion — 120,000 Rooms Across Three Prefectures Sit in Zones of 0.5m+, 56,000 of Them in Zones of 3m+
There are three key points. First, in Osaka Prefecture 81.2% of assessed rooms fall inside zones of 0.5m or more. This is not confined to the waterfront: most of the city-center lodging clusters in Osaka City’s Chuo, Kita, Naniwa and Yodogawa wards are within the assumed zones. Second, Aichi (32.9%) and Mie (30.4%) have in-zone shares only in the 30% range, but their rooms are concentrated in specific wards and cities such as Nagoya’s Nakamura Ward, Yokkaichi and Kuwana. Third, more than 70% of in-zone rooms (85,286) are in properties with 150 rooms or more. Divided by room count, the cost of placing substation equipment on upper floors or the roof comes to between several tens of thousands of yen and a little over ¥200,000 per room, equivalent to 3–23 nights of estimated settled ADR. The larger the property, the more thinly resilience investment can be spread per room.
What Are Storm Surge Inundation Zones? — A Maximum-Scale Scenario Based on Muroto- and Isewan-Class Typhoons
Storm surge inundation zones are designated by prefectures, coast by coast, under a system created by the 2015 amendment to the Flood Control Act. Osaka Prefecture published its zone maps for the Osaka Bay coast (Osaka section) on August 5, 2020. The scenario assumes a typhoon of the largest scale on record in Japan (Muroto Typhoon class, 910hPa), on the track that maximizes the storm surge anomaly, together with simultaneous river flooding and the failure of seawalls and levees. Aichi Prefecture designated the Mikawa Bay and Ise Bay coast (Aichi section) on June 11, 2021, and Mie Prefecture designated the Ise Bay coast (Mie section) on March 24, 2023. According to Mie Prefecture’s published materials, the inundation area for its section is about 288km², the maximum inundation depth about 13m, and the longest inundation duration more than one week.
In other words, these zone maps do not depict a “likely, everyday scenario” but the worst case of a storm surge exceeding the capacity of protective infrastructure. Being located inside a zone does not in itself mean a high likelihood of damage. In due diligence and insurance underwriting, however, whether a site is inside or outside a zone and its assumed inundation depth are routinely referenced as design conditions for equipment placement, which makes quantifying them valuable as a basis for comparing hotel assets. Flood exposure also feeds through into insurance premiums and, through PML, into LTV terms.
The methodology is as follows. We overlaid the location coordinates of the assessed properties on the inundation-depth polygons in the National Land Numerical Information storm surge inundation zone data (Osaka, Aichi and Mie) and made a point-in-polygon determination. Where a property fell in more than one polygon, the deeper band was used. Osaka’s data uses coarse depth bands (“under 0.5m / 0.5m to under 3m / 3m to under 5m / 5m to under 10m”), while Aichi and Mie use finer ones (“under 0.3m / 0.3–0.5m / 0.5–1m / 1–3m”). To allow comparison across the three prefectures, this article consolidates them into four bands: “under 0.5m / 0.5–3m / 3–5m / 5m+”.
By Prefecture — Osaka’s In-Zone Share Is 81.2%, with 51,489 Rooms in Zones of 3m+ Alone
Laying out room counts by inundation-depth band for each prefecture, Osaka’s profile stands out. It has 42,484 rooms in the 0.5–3m band, 38,904 in the 3–5m band and 12,585 in the 5m+ band. The 3m+ total of 51,489 rooms equals 44.5% of Osaka’s assessed rooms. In Aichi, over 90% of its 19,680 in-zone rooms (18,551) are concentrated in the 0.5–3m band, with only 1,129 rooms at 3m or more. In Mie, 3,063 of its 6,571 in-zone rooms are at 3m or more, a high share of deep bands reflecting lodging located on low-lying coastal land.
Source: MLIT, “National Land Numerical Information (Storm Surge Inundation Zone Data)”; MetroEngines Research & Consulting (assessed N=2,345 properties, 197,137 rooms)
| Prefecture | Assessed | Under 0.5m | 0.5–3m | 3–5m | 5m+ | Share at 0.5m+ |
|---|---|---|---|---|---|---|
| Osaka | 1,030 properties 115,751 rooms | 20 properties 1,625 rooms | 369 properties 42,484 rooms | 256 properties 38,904 rooms | 96 properties 12,585 rooms | 81.2% |
| Aichi | 731 properties 59,775 rooms | 17 properties 737 rooms | 177 properties 18,551 rooms | 17 properties 957 rooms | 3 properties 172 rooms | 32.9% |
| Mie | 584 properties 21,611 rooms | 13 properties 361 rooms | 53 properties 3,508 rooms | 30 properties 1,843 rooms | 23 properties 1,220 rooms | 30.4% |
| Three-prefecture total | 2,345 properties 197,137 rooms | 50 properties 2,723 rooms | 599 properties 64,543 rooms | 303 properties 41,704 rooms | 122 properties 13,977 rooms | 61.0% |
Source: MLIT, “National Land Numerical Information (Storm Surge Inundation Zone Data)”; MetroEngines Research & Consulting. Inundation-depth bands consolidated into four for three-prefecture comparison
Osaka’s high share reflects the fact that the zone maps cover a wide expanse of low-lying land within Osaka City. By ward, 31,326 of the 36,012 assessed rooms in Chuo Ward (87.0%) and 20,774 of the 20,928 in Kita Ward (99.3%) are inside the zones, and every room in Naniwa Ward and Yodogawa Ward is in-zone. Because the city-center lodging clusters of Umeda and Namba lie inside the zones, the simple rule of “avoid the waterfront and you are outside the zone” rarely holds in Osaka. Rather than screening locations by whether they are inside or outside a zone, this is a market where differences between properties are more likely to show up in how equipment placement has been designed relative to inundation depth within the same zone.
In Aichi, 11,583 of the 12,348 assessed rooms (93.8%) in Nakamura Ward, home to Nagoya Station, are inside the zones. Tokoname, across the water from Chubu Centrair International Airport, also has 3,817 of its 3,852 rooms in-zone. By contrast, Naka Ward, which includes the Sakae district, has only 230 of 17,624 rooms (1.3%) in-zone, so even within Nagoya location conditions diverge sharply between the west side of the station and the Sakae side. In Mie, in-zone shares are high in Yokkaichi (2,512 of 2,776 rooms) and Kuwana (1,134 of 1,482 rooms).
Where In-Zone Hotels Are — Mapping 572 Properties of 50+ Rooms by Inundation-Depth Band
The map shows the 572 properties with 50 or more rooms located in zones of 0.5m or more. Circle size represents room count and color intensity represents the inundation-depth band. On the Osaka Bay side, dark colors (3m+) run continuously along the waterfront from Konohana Ward to Suminoe Ward and Sakai Ward in Sakai City. On the Ise Bay side, the 0.5–3m band around Nagoya Station contrasts with the deeper bands in Kuwana and Yokkaichi.
Source: MLIT, “National Land Numerical Information (Storm Surge Inundation Zone Data)”; MetroEngines Research & Consulting (50+ rooms, N=572 properties)
In-Zone Rooms and Estimated Settled ADR in 10 Coastal Cities and Wards
For 10 major coastal cities and wards, we compiled in-zone room counts and estimated settled ADR (median for September 2025–August 2026). Because coastal wards have few properties and year-on-year changes swing widely, this article does not use YoY figures and compares levels over the 12 most recent finalized months. For cities and wards where fewer than five properties are covered by the estimated settled ADR, figures are not shown because the level would not be sufficiently representative.
| City / ward | Assessed | In zones of 0.5m+ | Of which 3m+ | Estimated settled ADR (12-month median) |
|---|---|---|---|---|
| Konohana Ward, Osaka City | 27 properties, 3,640 rooms | 3,479 rooms | 2,852 rooms | ¥21,356 (N=13) |
| Minato Ward, Osaka City | 21 properties, 1,341 rooms | 1,341 rooms | 1,341 rooms | ¥12,080 (N=9–11) |
| Suminoe Ward, Osaka City | 8 properties, 1,795 rooms | 668 rooms | 300 rooms | ¥12,663 (N=6–7) |
| Taisho Ward, Osaka City | 2 properties, 11 rooms | 11 rooms | 11 rooms | — (N=2) |
| Sakai Ward, Sakai City | 20 properties, 2,416 rooms | 1,936 rooms | 1,548 rooms | ¥7,505 (N=16–17) |
| Izumisano City | 39 properties, 4,050 rooms | 1,956 rooms | 0 rooms | ¥7,830 (N=21–26) |
| Minato Ward, Nagoya City | 6 properties, 468 rooms | 216 rooms | 120 rooms | — (N=2–3) |
| Atsuta Ward, Nagoya City | 6 properties, 707 rooms | 210 rooms | 0 rooms | — (N=4) |
| Yokkaichi City | 43 properties, 2,776 rooms | 2,512 rooms | 1,090 rooms | ¥6,950 (N=24–26) |
| Kuwana City | 26 properties, 1,482 rooms | 1,134 rooms | 1,134 rooms | ¥8,322 (N=18–19) |
Source: MLIT, “National Land Numerical Information (Storm Surge Inundation Zone Data)”; MetroEngines Research & Consulting. N for estimated settled ADR is the range of monthly property counts (a different population from the number of assessed properties)
In Konohana Ward, 2,852 of the 3,479 in-zone rooms are in zones of 3m or more, and its estimated settled ADR of ¥21,400 is the highest among the 10 coastal cities and wards. It is a high-rate lodging cluster supported by theme-park demand; with larger revenue per room, the period needed to recover the cost of flood-proofing equipment through ADR is shorter. By contrast, Yokkaichi (¥7,000) and Sakai Ward (¥7,500) sit in price ranges driven mainly by business demand, so the same equipment investment weighs relatively more heavily in ADR terms. Even within the same “in-zone” category, the combination of inundation-depth band and price range changes both the priority of countermeasures and how the payback looks. Combining hazard exposure with ADR in this way can also be applied to other coastal markets, as in our analysis of disaster risk, ADR and risk-adjusted yield at 10 Pacific coast destinations.
By Property Size — Over 70% of In-Zone Rooms Are in Properties of 150+ Rooms
Dividing the 1,024 properties in zones of 0.5m or more into four size bands, properties with 49 rooms or fewer are the most numerous at 452, but they account for only 7,659 rooms (6.4%). The 89 properties with 300+ rooms hold 44,285 rooms (36.8%) and the 198 properties with 150–299 rooms hold 41,001 rooms (34.1%); properties of 150 rooms or more alone account for 70.9% of in-zone rooms. The concentration of rooms in mid-to-large properties that take high-voltage power and have their own substation equipment is an important premise for any discussion of flood protection for electrical equipment.
Source: MLIT, “National Land Numerical Information (Storm Surge Inundation Zone Data)”; MetroEngines Research & Consulting (in zones of 0.5m+, N=1,024 properties)
What the Guideline Says — Place Substation Equipment Above the Assumed Inundation Depth
During Typhoon Hagibis (2019 East Japan Typhoon), high-voltage substation equipment installed in the basement of a high-rise condominium was submerged, and the resulting power outage left elevators and water supply systems unusable for some time. In response, MLIT and the Ministry of Economy, Trade and Industry (METI) compiled the “Guideline for Flood Countermeasures for Electrical Equipment in Buildings” in June 2020. It covers large buildings that receive extra-high or high-voltage power, and hotels share the same equipment configuration. The guideline’s core measures are to place electrical equipment where flood risk is low, taking into account the inundation depth assumed in hazard maps and similar sources, and to form a “flood defense line” by installing flood barriers and watertight doors at building entrances and connections to basements.
The options fall broadly into two approaches. One is to place substation and emergency generator equipment on the second floor or above, or on the roof. The other is to leave the equipment where it is and prevent water from entering with a flood defense line. The accompanying case collection describes a mid-sized eight-story office building completed in July 2019 that placed all of its high-voltage substation equipment, emergency generator, solar power system and storage batteries on the roof, where flood risk is low. In zones of 0.5–3m there is considerable scope to respond with a combination of raised platforms and a flood defense line, whereas in zones of 3m or more it is difficult to stay above the assumed depth with equipment left at ground-floor level or outdoors at grade, making upper-floor or rooftop placement the realistic option. 46.3% of in-zone rooms (55,681) are in this 3m+ band.
Comparison with post-disaster restoration costs also helps gauge whether the Capex is reasonable. Press reports on cases where electrical equipment in condominium basements was flooded noted that restoration “can cost as much as ¥20 million.” For hotels, lost room revenue during closure comes on top of that, so a proactive review of equipment placement can be evaluated not only in terms of repair costs but also from the perspective of business continuity. When sizing such measures, the revenue lost during any closure should be counted as part of the effective Capex alongside construction costs.
Capex per Room to Raise Substation Equipment — ¥30,000 to ¥250,000 by Size Band (Editorial Estimate)
We converted the cost of placing substation equipment above the assumed inundation depth into a per-room figure for each size band. Equipment costs are based on published price ranges for cubicle-type high-voltage power receiving equipment, including installation, and the additional cost of relocating to upper floors or the roof is reflected through a multiplier. Costs vary widely with each property’s power capacity, structure and delivery conditions, so the following is only a simple estimate to give a sense of scale.
■ Estimation Assumptions
- Equipment cost (published price range including installation): mid-size (50kVA–300kVA) ¥2m–¥6m; large (300kVA+) ¥10m–¥20m or more
- Mapping of size bands to equipment capacity (editorial assumption): 50–149 rooms = mid-size; 150–299 rooms and 300+ rooms = large. Because the published range for large equipment is open-ended (“or more”), costs for 300+ room properties may be understated
- Relocation multiplier (editorial assumption): 1.5x (low) to 2.5x (high). Assumes foundation and structural reinforcement, extension of high-voltage cabling, lifting and delivery, removal of existing equipment and outage work for upper-floor or rooftop placement are added on top of equipment cost
- Capex per room = equipment cost × relocation multiplier ÷ median room count of the size band (50–149 rooms: 100 rooms; 150–299 rooms: 202 rooms; 300+ rooms: 397 rooms)
- ADR equivalent = Capex per room ÷ median estimated settled ADR of the size band (in-zone properties, September 2025–August 2026)
- Properties with 49 rooms or fewer are excluded, as many take low-voltage power and may not have substation equipment (measures center on raising distribution boards and the like)
| Size band (in-zone) | Properties / rooms | Equipment cost × multiplier | Capex per room | Median estimated settled ADR | ADR equivalent |
|---|---|---|---|---|---|
| 50–149 rooms (median 100) | 285 properties, 27,279 rooms | ¥3m–¥15m | ¥30k–¥150k | ¥9,160 (N=242) | 3.3–16.4 nights |
| 150–299 rooms (median 202) | 198 properties, 41,001 rooms | ¥15m–¥50m | ¥74k–¥248k | ¥10,618 (N=181) | 7.0–23.3 nights |
| 300+ rooms (median 397) | 89 properties, 44,285 rooms | ¥15m–¥50m | ¥38k–¥126k | ¥12,494 (N=75) | 3.0–10.1 nights |
Source: MetroEngines Research & Consulting (room counts, estimated settled ADR); equipment costs estimated by the editorial team from published price ranges
Source: MetroEngines Research & Consulting; equipment costs estimated by the editorial team from published price ranges (see assumptions above)
The estimate shows that Capex per room is heaviest in the 150–299-room band. These properties incur large-equipment costs but do not have as many rooms as 300+ room properties, so there are fewer rooms to spread the cost across. For 300+ room properties the same equipment cost is divided by 397 rooms, keeping it at ¥38,000–¥126,000 per room, and with higher ADR the equivalent is 3.0–10.1 nights. For 50–149 rooms the equipment itself is cheaper, at ¥30,000–¥150,000 per room.
If all 572 in-zone properties with 50+ rooms were to carry out a similar placement review, the total would be roughly ¥5.2bn–¥18.6bn, or ¥46,000–¥165,000 per room across 112,565 in-zone rooms. Planning the substation room on an upper floor at the design stage of a new build avoids the removal and outage work captured by the relocation multiplier, allowing the measure to be built in at a lower cost than retrofitting an existing property. For development on the waterfront, the earlier this difference is factored in at the planning stage, the larger it becomes.
Scenario and Sensitivity Analysis — How Does the Per-Room Burden Change with Equipment Cost and Relocation Multiplier?
The estimate above spans a low case (lower-bound equipment cost × 1.5x multiplier) and a high case (upper-bound equipment cost × 2.5x multiplier). To capture the level most likely in practice, we added a mid case using the midpoint equipment cost (¥4m for mid-size, ¥15m for large) × 2.0x, giving three scenarios. In the mid case, the total for the 572 in-zone properties with 50+ rooms is about ¥10.9bn, or ¥97,000 per room, and even the 150–299-room band stays at around 14 nights in ADR terms.
| Scenario | 50–149 rooms | 150–299 rooms | 300+ rooms | Total for 572 properties |
|---|---|---|---|---|
| Low (lower-bound cost × 1.5) | ¥30k (3.3 nights) | ¥74k (7.0 nights) | ¥38k (3.0 nights) | ~¥5.2bn (¥46k/room) |
| Mid (midpoint cost × 2.0) | ¥80k (8.7 nights) | ¥149k (14.0 nights) | ¥76k (6.0 nights) | ~¥10.9bn (¥97k/room) |
| High (upper-bound cost × 2.5) | ¥150k (16.4 nights) | ¥248k (23.3 nights) | ¥126k (10.1 nights) | ~¥18.6bn (¥165k/room) |
Source: MetroEngines Research & Consulting (room counts, estimated settled ADR; in-zone properties with 50+ rooms, N=572); equipment costs estimated by the editorial team from published price ranges. The mid-case midpoint equipment cost and 2.0x multiplier are editorial assumptions
For the 150–299-room band, where the per-room burden is heaviest, a two-way sensitivity on equipment cost and relocation multiplier shows the burden moving across a range of about 3.3x, from ¥74,000 to ¥248,000. Even at the upper-bound equipment cost of ¥20m, holding the multiplier to 1.5x keeps it at ¥149,000 (14.0 nights), showing that delivery routes and structural reinforcement conditions have a large effect on the per-room burden. In due diligence, checking lifting conditions to upper floors and the roof early, alongside power capacity, improves the accuracy of the estimate.
| Equipment cost \ multiplier | 1.5x | 2.0x | 2.5x |
|---|---|---|---|
| Equipment cost ¥10m | ¥74k (7.0 nights) | ¥99k (9.3 nights) | ¥124k (11.7 nights) |
| Equipment cost ¥15m | ¥111k (10.5 nights) | ¥149k (14.0 nights) | ¥186k (17.5 nights) |
| Equipment cost ¥20m | ¥149k (14.0 nights) | ¥198k (18.6 nights) | ¥248k (23.3 nights) |
Source: MetroEngines Research & Consulting (estimated settled ADR, N=181 properties); equipment costs estimated by the editorial team from published price ranges
Four Items to Check in Due Diligence, Lending and Insurance Practice
| Item | What to look at | Link to this article’s data |
|---|---|---|
| Assumed inundation depth | Depth band on the zone map; inundation duration | The 3m+ band holds 46.3% of in-zone rooms |
| Floor level of substation equipment | Basement, ground floor or outdoors at grade, versus upper floors or roof | 70.9% of in-zone rooms are in properties of 150+ rooms |
| Flood defense line | Flood barriers and watertight doors; sealing of basement connections and cable entry points | The 0.5–3m band (64,543 rooms) offers a wide range of options |
| Allocation of countermeasure costs | Capex per room; payback scale in ADR terms | ¥30k–¥248k per room by size band, or 3–23 nights |
Source: Prepared by MetroEngines Research & Consulting with reference to MLIT and METI, “Guideline for Flood Countermeasures for Electrical Equipment in Buildings”
Summary
Of the 2,345 hotels (197,137 rooms) with confirmed operations in Osaka, Aichi and Mie, 1,024 properties and 120,224 rooms (61.0%) lie in storm surge inundation zones with an assumed depth of 0.5m or more. In Osaka Prefecture, city-center lodging clusters are widely included in the zones, pushing the share to 81.2%. Aichi and Mie are in the 30% range, but exposure is concentrated in Nagoya’s Nakamura Ward, Tokoname, Yokkaichi and Kuwana.
More than 70% of in-zone rooms are in properties with 150 or more rooms, and the cost of placing substation equipment above the assumed inundation depth can be framed at a scale of ¥30,000–¥250,000 per room (3–23 nights of estimated settled ADR). The zone maps assume a worst-case, maximum-scale storm surge. Rather than treating an in-zone location itself as a negative, checking each property’s equipment floor level and the presence of a flood defense line, and evaluating countermeasure costs on a per-room basis, makes comparisons of waterfront hotel assets more precise. In new developments, building upper-floor placement in at the design stage offers an opportunity to improve flood resilience at a lower cost than retrofitting.
* Zone determination in this article is a point determination based on location coordinates and does not reflect site shape, ground elevation of buildings or the actual floor on which equipment is installed. Storm surge inundation zones are based on the largest conceivable storm surge and do not indicate the probability of occurrence or the likelihood of damage to individual properties. The Capex estimate is a simple estimate based on published price ranges and editorial assumptions; actual investment decisions require equipment surveys and quotations for each property.
Related Articles
References and Sources
■ Data Sources
MetroEngines Research & Consulting (property locations and room counts; estimated settled ADR as the 12-month median for September 2025–August 2026, the most recent finalized months; assessed N=2,345 properties, 197,137 rooms); MLIT, “National Land Numerical Information (Storm Surge Inundation Zone Data)” for Osaka, Aichi and Mie. Point-in-polygon determination by location coordinates; where a property falls in multiple zones the deeper band is used, and inundation depth is consolidated into four bands for three-prefecture comparison.
■ Estimation Assumptions
Equipment costs are published price ranges, including installation, for cubicle-type high-voltage power receiving equipment (mid-size ¥2m–¥6m; large ¥10m–¥20m or more). The relocation multiplier for upper-floor or rooftop placement is 1.5x (low), 2.0x (mid) and 2.5x (high) (editorial assumptions). Capex per room = equipment cost × multiplier ÷ median room count of the size band (100 / 202 / 397 rooms); the ADR equivalent divides by the median estimated settled ADR for each size band. Properties with 49 rooms or fewer are excluded as many take low-voltage power.
■ Limitations and Caveats
Zone determination is a point determination by location and does not reflect site shape, ground elevation or the actual floor on which equipment is installed. The zone maps assume the largest conceivable storm surge and do not indicate the probability of occurrence or the likelihood of damage to individual properties. Because the published range for large equipment is open-ended (“or more”), costs for 300+ room properties may be understated. Estimated settled ADR is an estimate, and cities and wards with fewer than five covered properties are not shown.
■ Market Data
- MetroEngines Research & Consulting — property locations and room counts (assessed N=2,345 properties), estimated settled ADR (September 2025–August 2026)
■ Government and Prefectural Materials
- MLIT, “National Land Numerical Information (Storm Surge Inundation Zone Data)” (in Japanese)
- Osaka Prefecture, “About the Storm Surge Inundation Zone Maps” (published August 5, 2020; in Japanese)
- Aichi Prefecture, “Designation and Publication of Aichi Prefecture Storm Surge Inundation Zones” (June 11, 2021; in Japanese)
- Mie Prefecture, “Publication of Storm Surge Inundation Zone Maps for the Largest Conceivable Storm Surge on the Ise Bay Coast [Mie Section]” (designated March 24, 2023; in Japanese)
- MLIT and METI, “Guideline for Flood Countermeasures for Electrical Equipment in Buildings” (June 2020; in Japanese)
- MLIT, “Case Collection of Flood Countermeasures for Electrical Equipment in Buildings (Draft)” (in Japanese)
■ Equipment Cost Ranges and Press Reports
- Energy-Saving Subsidy Support Center for SMEs, “How Much Does It Cost to Install, Replace or Expand a Cubicle? Price Ranges by Capacity and Breakdown of Works” (July 28, 2025; in Japanese)
- Kansai Electric Power, Business Solutions, “What Is Cubicle-Type High-Voltage Power Receiving Equipment? Benefits, Caveats and Cost Ranges” (in Japanese)
- Yomiuri Shimbun Online, “‘Underground Facilities’ Are a Weak Point for Condominiums… Restoration Can Cost ¥20 Million” (in Japanese)