

National land sales, closed-school reuse, fishing-port facility conversions, redevelopment of returned military land — every public-asset route to new lodging supply we have tracked so far has followed the same path: acquire land or a building, then build a new property on it. Yet among the real estate held by the public sector there is a meaningful stock of assets that are already operating as lodging, with guest rooms, an inn-business (ryokan-gyo) licence and an operating track record all in place. These are the kokumin shukusha (public lodges) and recreation facilities set up by local governments, and the onsen inns run by third-sector companies. Because revenue starts on day one of ownership, this fifth route is fundamentally different in character from the other four.
Metric Definitions Used in This Article
- ADR (average daily rate): an estimated settled rate (tax-exclusive equivalent), calculated by applying a property-type adjustment factor to the lowest-plan price each property publishes on major booking sites (two guests per room, per-room price, tax included). Checked against property-level results disclosed by listed hotel REITs (91 properties, most recent 3 months), the median error is about 7%. These are estimates and differ from each property’s actual settled prices and accounting figures. Area-level ADR is the median of the properties covered (the level of a typical property in the area).
- OCC (occupancy rate): rooms sold as a share of total rooms in the area (an estimate based on OTA and other sales inventory). The occupancy rates cited in this article are published figures from the Japan Tourism Agency’s Overnight Travel Statistics Survey.
- Public inns (as defined in this article): a group of listed properties extracted by facility-name string, comprising those whose names contain any of “Kokumin Shukusha”, “Kyukamura”, “Fureai no Sato”, “Town-run”, “Village-run” or “City-run” (N=165, excluding campgrounds and auto-campgrounds). The operating entity was not verified against registry records; this is a convenience classification based on names, and it includes properties now operated by private companies.
- Data sources: MetroEngines Research & Consulting / Ministry of Internal Affairs and Communications (MIC) / Japan Tourism Agency
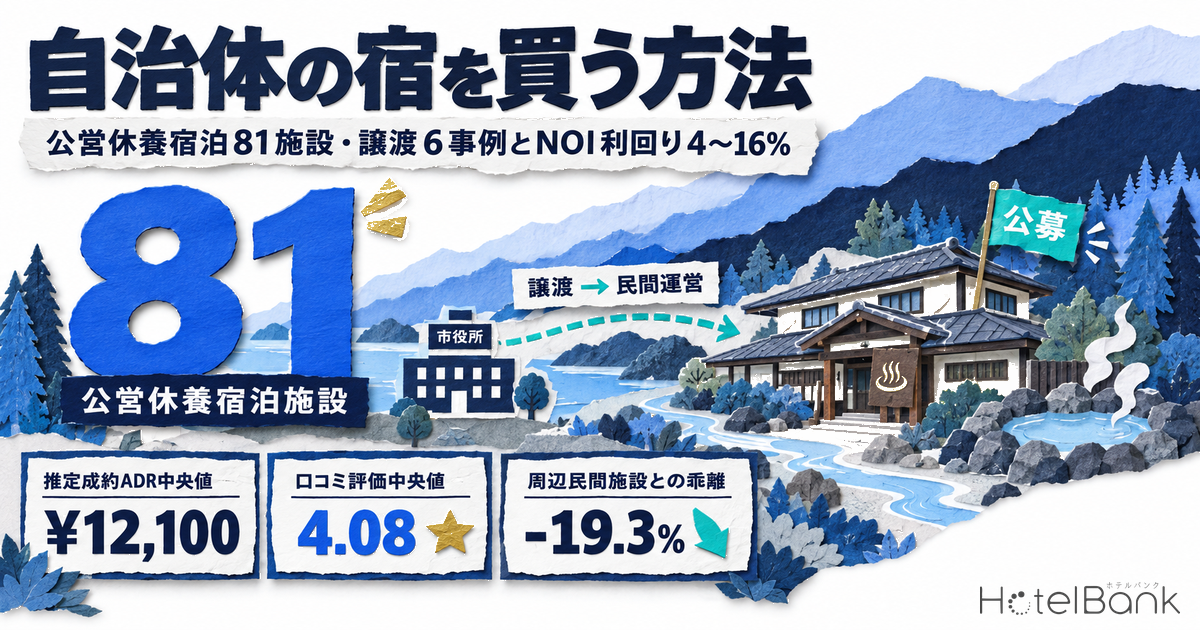
The conclusions first. First, recreational lodging facilities run as local public enterprises had been pared down to 60 businesses and 81 facilities in the FY2024 accounts, roughly 30% fewer than the 83 businesses and 112 facilities of FY2018. The universe itself is small, but the steady flow of 4–5 facilities leaving public accounts every year means deals keep surfacing for anyone who looks. Second, the 165 public inns captured in listing data have a solid customer-satisfaction base: a median review score of 4.08, with 65.5% scoring 4.0 or higher. Third, when matched against private properties of the same type in the same market area, the public inns’ estimated settled ADR sits 19.3% lower at the median. The reviews are there, but pricing has not yet caught up with the market — and that is the headroom private operating know-how can capture.
- — Recreational lodging facilities run as local public enterprises numbered 60 businesses and 81 facilities in the FY2024 accounts. That is 31 fewer than the 112 facilities of FY2018, with 4–5 facilities a year continuing to leave public accounts.
- — The “public inns” captured in listing data total 165 facilities and 5,707 rooms. The median room count is 27 and the median opening year is 1990, with buildings aged 30–60 years forming the core.
- — The median review score is 4.08 (out of 5, N=116 facilities), and 65.5% score 4.0 or higher. A customer-satisfaction base is already in place.
- — Matched one-to-one with private properties of the same type in the same market area, the gap in estimated settled ADR is -19.3% at the median (N=57 pairs). Pricing has not caught up with reviews.
- — With 40 rooms, a ¥100–300 million acquisition price and renovation capex of ¥1–5 million per room, NOI yields come to 4.2–16.1% (assuming GOP margins of 20–30%). But setting the GOP margin at 15%, the top of the industry benchmark range, pulls the yield down to 4.8%.
What “already being an inn” means — the decisive difference from the other four routes
Lodging supply that originates in public assets has several entry points: general competitive tenders for national land, calls for proposals to reuse closed schools, the fishing-port facility utilisation scheme, and redevelopment of returned military land. In every one of them, the buyer takes on the entire timeline of design, construction and permitting after acquisition. From confirming zoning to obtaining an inn-business licence, it is not unusual for opening to take 2–4 years. Converting closed schools, which arise at a pace of around 450 a year, into lodging assets is a case in point: it works only when zoning, building-code and demand conditions line up, and all of that has to be solved before the first guest arrives.
Municipal lodging facilities, by contrast, come with the building, rooms, kitchen, baths, licence, staff and historical occupancy data all in place at the time of acquisition or operating contract. The nature of the risk switches from development risk to operating risk. For small and mid-sized funds, local operators, or businesses already running such facilities as designated managers, this is an easy form of deal to evaluate. On the other hand, building age, the burden of equipment renewal and the constraints inherent in public tendering stand at the entrance.
Route 1 Transfer (change of ownership)
Land and buildings are sold through an open proposal competition. After acquisition the business is entirely private. Pricing splits between cases with a minimum sale price and cases of transfer at no cost plus a renovation subsidy.
Route 2 Designated management (operating contract)
The municipality keeps ownership and the operating rights are contracted out. Entry requires little upfront investment, but terms of five years are the norm and the split of capital expenditure depends on the agreement.
Route 3 Site sale (cleared land)
Only the land is sold, with conditions, after demolition. This returns to the same development model as the four existing routes, so it falls outside the main scope of this article.
The scale of publicly held room stock — three layers
“Municipal inns” may sound like a single category, but institutionally they fall into three layers. Each is covered by different statistics, so whenever the numbers are set side by side, their sources must be read separately.
| Layer | Institutional status | Scale | Source / reference date |
|---|---|---|---|
| 1. Local public enterprises | Run directly by the municipality as a tourism facility business (recreational lodging facility business) | 60 businesses / 81 facilities (10 businesses and 14 facilities under the Local Public Enterprise Act; 50 businesses and 67 facilities outside it). 599,000 guest-nights a year | MIC, Local Public Enterprise Yearbook FY2024 (72nd edition, FY2024 accounts) |
| 2. Third-sector entities | Owned and operated by corporations in which municipalities hold equity | 833 corporations in tourism and leisure (out of 5,760 corporations covered by the management survey). 306 of them receive municipal subsidies, totalling ¥16.3 billion | MIC, Survey Results on the Status of Third-Sector Entities (as of March 31, 2025) |
| 3. Designated management | Operation of public facilities contracted to private companies and others | The system covers 76,268 facilities in total. Of these, 15,215 facilities are in the “recreation and sports facilities” category that includes lodging and recreation facilities (hotels, kokumin shukusha, etc.), and 4,982 of those (32.7%) are managed by joint-stock companies | MIC, Survey Results on the Introduction of the Designated Manager System for Public Facilities (as of April 1, 2018; published May 2019) |
Of these, layer 1 is the easiest to track as a source of deals. The number of tourism facility businesses overall fell 74.7%, from 814 in FY1993 to 206 in FY2024, and operating revenue dropped from a peak of ¥125.5 billion to ¥18.9 billion. Note, however, that this reflects not only business shrinkage but also the shift to the designated manager system with usage-fee arrangements. In fact, 186 tourism facility businesses in FY2024 — 90.7% of the total — were profitable, and the segment as a whole posted a surplus of ¥4.261 billion. The picture is not one of public inns failing across the board; closer to the reality is that what leaves the public-enterprise framework moves into private operation.
Over the last seven years, the facility count went 112 → 96 → 93 → 90 → 90 → 85 → 81. On average, 4–5 facilities a year have left the public-enterprise framework — by no means a small turnover rate for a universe of 81 facilities. On top of this, third-sector entities in layer 2 also produce deals in the form of share transfers or business transfers. Third-sector entities numbered 6,947 corporations as of March 31, 2025, down 80 over the last two years, and abolitions, mergers and equity withdrawals during the survey period totalled 195 corporations.
165 “public inns” in listing data — 27 rooms, opened 1990, rated 4.08
From here we look at the same universe from the side of properties listed on major booking sites. Extracting by name string the properties whose names contain “Kokumin Shukusha”, “Kyukamura”, “Fureai no Sato”, “Town-run”, “Village-run” or “City-run” yields 165 facilities (excluding campgrounds and auto-campgrounds), with a total of 5,707 rooms where room counts are known. The median is 27 rooms per facility, and properties with fewer than 40 rooms make up about 70% of the total. We should note up front that this is a convenience universe derived from names, not verified against institutional status, and that it includes facilities already run by private operators. Narrowing to kokumin shukusha and Kyukamura alone still leaves 136 facilities spread across the country, which gives a sense of how widely this room stock is dispersed.
The median opening year is 1990. Thirty-four facilities opened in 1969 or earlier, and the largest group is the 50 facilities of the 1990s. A core of buildings aged 30–60 years means that equipment-renewal capex after acquisition has to be taken as a given. Put the other way, book values are heavily depreciated, which is also why the seller’s pricing tends to settle around land value net of demolition cost.
Locations are spread thinly across the country. By prefecture, Nagano has 14 facilities, Wakayama 9, Hokkaido 8, and Hyogo and Hiroshima 7 each (N=165 facilities, listing basis; source: MetroEngines Research & Consulting). True to their institutional origin — built in natural parks and national health-resort onsen areas — they are scattered across mountain and coastal areas far more than in prefectural capitals.
Customer satisfaction is high. Among the 116 facilities with 10 or more reviews, the median score is 4.08 (out of 5), and 65.5% score 4.0 or higher. True to their institutional purpose of offering comfortable stays at low prices, satisfaction relative to price has built up. The table below lists the top-rated facilities among those with 100 or more reviews.
| Facility | Location | Rooms | Review score | Reviews |
|---|---|---|---|---|
| Kokumin Shukusha Kurosaki-so (国民宿舎くろさき荘) | Fudai Village, Iwate | 36 | 5.00 | 289 |
| Nishiizu Town-run Yamabiko-so (西伊豆町営 やまびこ荘) | Nishiizu Town, Shizuoka | 10 | 5.00 | 283 |
| Toimisaki Kokumin Shukusha (都井岬 国民宿舎) | Kushima City, Miyazaki | 11 | 5.00 | 118 |
| Kokumin Shukusha Ishizuchi (国民宿舎 石鎚) | Kumakogen Town, Ehime | 25 | 4.60 | 175 |
| Kokumin Shukusha Sugikubo House (国民宿舎 杉久保ハウス) | Shinano Town, Nagano | 11 | 4.60 | 154 |
| Kyukamura Kishu-Kada (休暇村 紀州加太) | Wakayama City, Wakayama | 72 | 4.57 | 4,567 |
| Kokumin Shukusha Senjoen (国民宿舎 千畳苑) | Hamada City, Shimane | 31 | 4.53 | 1,828 |
| Kokumin Shukusha Matsushiro-so (国民宿舎 松代荘) | Nagano City, Nagano | 35 | 4.52 | 2,214 |
| Kamisaibara Onsen Kokumin Shukusha Itsuki (上齋原温泉 国民宿舎 いつき) | Kagamino Town, Okayama | 33 | 4.52 | 537 |
| Kokumin Shukusha Enasanso (国民宿舎 恵那山荘) | Ena City, Gifu | 18 | 4.50 | 326 |
Price position — matched against private properties of the same type in the same market area
Next, pricing. A simple average comparison between public inns and private properties would be meaningless, so we extracted, for each facility, private properties of the same type within a 15 km radius (up to 12 properties), and matched the facility one-to-one against their median estimated settled ADR. This produced 57 pairs with at least three nearby comparables and estimated settled ADR for completed months on both sides.
The median gap across the 57 pairs is -19.3%. In 39 of the 57 pairs (68.4%), the public inn priced below the median of nearby private properties. The spread is wide — the first quartile is -38.1% and the third quartile +7.3% — but the centre of the distribution clearly sits on the downside. Across these 57 pairs, the median estimated settled ADR is around ¥12,400 for the public inns versus ¥14,000 for nearby private properties.
How should this gap be read? Given that these facilities were established to be widely available at low prices, pricing below market is exactly what the system was designed to produce. It is not something to criticise. What matters from an investment standpoint is the fact that rooms that have already earned review scores in the 4s are selling at prices about 20% below market. When demand-side appreciation has not caught up with pricing, that is the part most directly reflected in revenue once the operator changes and redesigns pricing and sales channels. How far rates can move once a renovation is added is a separate question: in our separate analysis of 43 municipal kokumin shukusha, the estimated median ADR was ¥8,800, while converted properties reached the ¥20,000 range — though the result depends heavily on the depth of the refurbishment and the local price band.
The 12 pairs on the upside (+25% or more) are also meaningful. In mountain and coastal locations where the only neighbours are pensions or small minshuku, the public inn is effectively the best-equipped property in the area and its rates sit well above its surroundings. In those cases the issue shifts from pricing to distribution channels and smoothing occupancy.
Acquisition routes in practice — six cases traceable in public documents
Below are deals that have actually been made public. We limited the list to cases where at least one of the transfer price, room count or post-transfer operator could be confirmed in public documents. How the terms are structured varies widely by municipality, ranging from “transfer at no cost plus a renovation subsidy” to “competitive proposal with a minimum sale price”.
| Municipality / facility | Method | Price / support terms | Scale | Outcome / operator |
|---|---|---|---|---|
| Oshu City, Iwate Former Kokumin Shukusha Sun Hotel Koromogawa-so (旧 国民宿舎サンホテル衣川荘) |
Transfer (open proposal competition) | No charge. The city subsidised half of renovation costs up to ¥50 million, and granted a management-stabilisation subsidy of ¥5 million a year for five years after opening. Before handover, the city paid for demolition of unneeded buildings and equipment repairs | 42 rooms (after renovation, 4 room types) | Handed over July 2022. Opened by Libera Hotels & Resorts Co., Ltd. as “Oshu Hiraizumi Onsen Ryokan ITSUMU” on April 25, 2025 |
| Kurayoshi City, Tottori Former Kokumin Shukusha Sekigane-so / Green Scole Sekigane (旧 国民宿舎関金荘/グリーンスコーレせきがね) |
Designated management (open proposal competition for combined design and operation) | The city retains ownership and contracts out design and operation as a package | 30 rooms, capacity 162 (North Wing 13 rooms / South Wing 17 rooms) | In August 2022, a consortium led by Ryutsu Co., Ltd. was selected; opened as “HOTEL Hoshitori Terrace Sekigane” on April 26, 2025 |
| Ueda City, Nagano Former Kakeyu public lodge (旧 国民宿舎 鹿月荘) / former Kakeyu Health Center |
Transfer (open proposal competition) | Minimum sale price ¥34,316,000 (land and buildings) | Building: reinforced concrete, 2 storeys plus 1 basement level, total floor area 3,512.95㎡ (completed March 1983) / site 4,461.59㎡ plus leased land 2,511.27㎡ | Closed March 2025. Tender held in 2026; per the city’s published schedule, the final contract is due in early October of the same year (as of the page update on April 27, 2026) |
| Minakami Town, Gunma Former “Ichiyotei (New Wing)” (旧「一葉亭(新館)」) |
Open proposal competition for a reuse operator | Terms set out in the application guidelines | Steel and reinforced concrete, single storey (after downsizing), total floor area 917.28㎡ | Applications invited October–December 2024, with the preferred negotiator scheduled to be chosen in late December of the same year |
| Iga City, Mie Oyamada Onsen and Shimagahara Onsen (大山田温泉・島ヶ原温泉) |
Transfer (open proposal competition) | Operator selected on its intention to keep running the onsen facilities for 10 years or more | 2 facilities (opened 1994 and 1999) | Applications accepted November 2022–January 2023; screening results published |
| Wajima City, Ishikawa Former site of Noto Monzen Family Inn View Sunset (能登・門前ファミリーイン ビュー・サンセット跡地) |
Site sale (cleared land, with conditions) | Building lodging with dining facilities is mandatory. Landscape consideration, job creation, and environmental and disaster-prevention consideration are also required | Site 33,913.66㎡ | Registration closed May 2025. Land handover scheduled for late March 2027 after demolition |
Three practical points emerge from these six cases. First, prices often fall in a range from zero to a few tens of millions of yen. The Ueda case, including a building of 3,512.95㎡ total floor area and a 4,461.59㎡ site, carries a minimum sale price of ¥34.316 million — about ¥9,800 per ㎡ of building floor area. Second, municipal support is sometimes packaged in. In the Oshu case, half of renovation costs (up to ¥50 million) came with an operating subsidy for five years after opening. Third, the lead time to opening is not short. The Oshu case took 2 years and 9 months from handover to opening, and the Kurayoshi case 2 years and 8 months from operator selection to opening. “Having rooms from day one” is not the same as “selling from day one”.
Pro forma — NOI yield by renovation capex for 40 rooms acquired at ¥100–300 million
Keeping in mind that the universe median is 27 rooms, we set 40 rooms as a scale at which operations can more easily break even, and model the returns from acquiring a municipal inn with a largely depreciated book value for ¥100–300 million under three renovation scenarios. In this article, GOP (gross operating profit) means revenue less operating expenses, and the yield is a gross yield: annual GOP divided by total investment (acquisition price plus renovation capex). Depreciation, interest, FF&E reserves and property tax are not deducted. This is a simplified estimate built from the medians of public statistics and listing data; actual investment decisions require a detailed, property-specific feasibility study.
| Assumption | A. Light renovation | B. Mid renovation Base | C. Full renovation |
|---|---|---|---|
| Renovation capex (per room) | ¥1 million | ¥3 million | ¥5 million |
| Renovation capex (40 rooms total) | ¥40 million | ¥120 million | ¥200 million |
| Assumed ADR (tax-exclusive equivalent, per room) | ¥12,100 | ¥14,000 | ¥20,000 |
| Basis for ADR | Median estimated settled ADR of public inns (N=73 facilities) | Median of nearby private properties of the same type (¥13,992) | Repositioning above market level |
| Assumed OCC (full-year basis) | 40% | 50% | 55% |
| Assumed GOP margin | 20% | 25% | 30% |
| Annual revenue | ¥71 million | ¥102 million | ¥161 million |
| Annual GOP | ¥14 million | ¥26 million | ¥48 million |
| Acquisition price | A. Light (total investment) | A. Yield | B. Mid (total investment) | B. Yield | C. Full (total investment) | C. Yield |
|---|---|---|---|---|---|---|
| ¥100 million | ¥140 million | 10.1% | ¥220 million | 11.6% | ¥300 million | 16.1% |
| ¥200 million | ¥240 million | 5.9% | ¥320 million | 8.0% | ¥400 million | 12.0% |
| ¥300 million | ¥340 million | 4.2% | ¥420 million | 6.1% | ¥500 million | 9.6% |
What this table shows is a structure in which renovation depth and the ADR setting determine the yield more than the acquisition price does. Compare a light renovation at a ¥100 million acquisition (total investment ¥140 million, yield 10.1%) with a full renovation at the same acquisition price (total investment ¥300 million, yield 16.1%): investment more than doubles, yet the yield rises. The turning point is whether ADR can be lifted from ¥12,100 to ¥20,000 and OCC from 40% to 55%. Conversely, if that uplift is not achievable, a light renovation that holds down investment is the more rational choice — the scenario is determined by the location’s demand density and the market area’s price band.
The -19.3% gap against nearby private properties seen earlier also supports the realism of scenario B. Simply bringing rates back to market level implies ADR headroom of about 20%, well within reach through renovation and sales design. Scenario C’s ¥20,000, on the other hand, is far above the local median and presupposes a remake of the product itself.
| Sensitivity (scenario B, ¥200 million acquisition) | Annual revenue | Annual GOP | Yield |
|---|---|---|---|
| Base case (ADR ¥14,000, OCC 50%, full-year basis) | ¥102 million | ¥26 million | 8.0% |
| ADR -10% (¥12,600) | ¥92 million | ¥23 million | 7.2% |
| OCC -5pt (45%) | ¥92 million | ¥23 million | 7.2% |
| Both (ADR -10%, OCC -5pt) | ¥83 million | ¥21 million | 6.5% |
| GOP margin -5pt (20%) | ¥102 million | ¥20 million | 6.4% |
| GOP margin at the top of the industry benchmark (15%) | ¥102 million | ¥15 million | 4.8% |
| All three at once (ADR -10%, OCC -5pt, GOP margin 15%) | ¥83 million | ¥12 million | 3.9% |
The variable in this table that demands the most attention is neither ADR nor OCC but the GOP margin. Our estimate assumes GOP margins of 20–30%, above the ryokan industry benchmark of 5–15%, reflecting a change of operating structure and meal-inclusive plans. Lowering scenario B to the 15% top of the benchmark cuts the yield from 8.0% to 4.8%, and combined with downside in ADR and OCC it falls to 3.9%. Before negotiating the acquisition price or scrutinising renovation capex, the core of this investment is building the evidence for how far the GOP margin can be raised at that property — food costs, labour costs and occupancy smoothing.
Points to watch — issues specific to public tendering
| Issue | Details | Practical response |
|---|---|---|
| Building age and equipment renewal | The median opening year is 1990, and 34 facilities opened in 1969 or earlier. Renewal of boilers, power receiving and transforming equipment, HVAC, and water supply and drainage tends to fall due at the same time | Read closely the lists of required repairs and outstanding issues attached to tender documents. In the Ueda case, a “list of areas requiring repair” and “outstanding issues for the property as a whole” were published and repeatedly updated |
| Conditions on continued use | Continued operation as lodging for a set period is often a condition (10 years or more in the Iga case) | This directly affects exit flexibility, so confirm the required number of years and penalty clauses in advance |
| Length of the tender schedule | Six months or more from distribution of the application guidelines to the final contract. The final contract follows a vote by the municipal assembly | In the Ueda case, about 7 months from distribution of the guidelines (March 2026) to the final contract (scheduled for early October of the same year). Align the funding plan with the procedural timeline |
| Submission of a financial plan | Proposals require a financial plan and business plan in addition to the price proposal | Give the ADR and OCC assumptions a solid basis. The persuasiveness of the proposal decides selection |
| Local employment and use of local resources | Landscape consideration, job creation, and environmental and disaster-prevention consideration are sometimes required (the Wajima case) | Build touchpoints with the local community into the operating plan |
| Mismatched reference dates in statistics | The most recent published national survey of the designated manager system is as of April 1, 2018 | Supplement the macro picture with the Local Public Enterprise Yearbook (FY2024 accounts) and the third-sector survey (as of March 31, 2025) |
Conclusion
As a universe, the lodging stock held by the public sector is small: 81 recreational lodging facilities run as public enterprises, with 4–5 a year leaving public accounts. But add the 833 third-sector corporations in tourism and leisure and the layer of designated-management facilities that includes lodging and recreation, and deals do not come from a single source. Above all, the fact that rooms, licence, operations and review scores are all in place from the first day of ownership is a strength no other public-asset route offers.
What the listing data shows is that this room stock sits in a position where it has a customer-satisfaction base with a median review score of 4.08, yet prices 19.3% below private properties of the same type in the same market area at the median. Providing lodging at low prices is precisely what the system was designed to do, and this is not a verdict on how the facilities have been run. What matters from an investment and operating standpoint is a single point: there is room to layer private-sector pricing and sales design on top of the customer goodwill the public sector has built up. At 40 rooms and an acquisition price of ¥100–300 million, the numbers point to NOI yields of 4–16% depending on renovation depth.
For small and mid-sized funds seeking regional deals, local operators, and designated managers considering a move from operating contract to ownership, tender information is scattered across individual municipal websites. Because the universe is small, there is real value in narrowing down target municipalities and monitoring them regularly.
Note on estimates: The NOI yield estimates in this article are simplified estimates built from the medians of public statistics and listing data. ADR, OCC and GOP margin are all assumptions, and the profitability of individual deals varies greatly with location, market area, building condition and operating structure. Actual investment decisions require a detailed feasibility study.
Related Reading
References and Sources
■ Data sources
MIC, Local Public Enterprise Yearbook (editions for FY2019, FY2021, FY2023 and FY2024 accounts); MIC, Survey Results on the Status of Third-Sector Entities (as of March 31, 2025); MIC, Survey Results on the Introduction of the Designated Manager System for Public Facilities (as of April 1, 2018); Japan Tourism Agency, Overnight Travel Statistics Survey (2025 annual, preliminary). Facility-side data covers the group of 165 listed properties extracted by name string — those whose names contain “Kokumin Shukusha”, “Kyukamura”, “Fureai no Sato”, “Town-run”, “Village-run” or “City-run” (excluding campgrounds and auto-campgrounds) — for which estimated settled ADR, room count, opening year and review scores were aggregated from listings between August 2025 and August 2026. Acquisition cases are limited to those whose URLs could be confirmed in public documents of each municipality and operator.
■ Estimate assumptions
40 rooms, 365 operating days, acquisition price ¥100–300 million, renovation capex of ¥1 million (A) / ¥3 million (B) / ¥5 million (C) per room. Assumed ADR is estimated settled ADR (tax-exclusive equivalent, per room) of ¥12,100 / ¥14,000 / ¥20,000; assumed OCC on a full-year basis is 40% / 50% / 55%; assumed GOP margin is 20% / 25% / 30%. Annual revenue = assumed ADR × 40 rooms × 365 days × assumed OCC; annual GOP = annual revenue × assumed GOP margin; yield = annual GOP ÷ (acquisition price + renovation capex). This is a gross yield before depreciation, interest, FF&E reserves, property tax and insurance. The sensitivity analysis takes scenario B with a ¥200 million acquisition as the base and varies ADR by -10%, OCC by -5pt, and GOP margin by -5pt and to the 15% top of the industry benchmark.
■ Limitations and caveats
(1) The 165 “public inns” are a convenience extraction based on facility-name strings; the operating entity was not verified against registry records, and facilities already run by private operators are included. A small number of non-qualifying facilities may be mixed in through name matches. (2) Estimated settled ADR is an estimate derived by applying a property-type adjustment factor to listed prices and differs from each property’s actual settled prices and accounting figures. (3) The assumed GOP margin of 20–30% is above the ryokan industry benchmark (5–15%) and is the variable with the strongest effect on yield. Yields with the margin lowered to the top of the benchmark are shown in the sensitivity analysis. (4) The most recent published national survey of the designated manager system is as of April 1, 2018, and its reference date does not match those of the Local Public Enterprise Yearbook (FY2024 accounts) or the third-sector survey (as of March 31, 2025), so the three layers’ figures should be read individually rather than added together. (5) These estimates are simplified estimates built from the medians of public statistics and listing data; the profitability of individual deals varies greatly with location, market area, building condition and operating structure. Actual investment decisions require a detailed feasibility study.
■ Market data
- MetroEngines Research & Consulting — estimated settled ADR, room count, opening year and review scores of listed properties (public inns N=165 facilities; ADR calculation N=73 facilities; comparison with private properties N=57 pairs)
■ Government statistics and public data
- MIC, Local Public Enterprise Yearbook FY2024, Chapter 3 By Business, 11. Tourism Facility Business (72nd edition, FY2024 accounts; Japanese)
- MIC, Local Public Enterprise Yearbook FY2024, Chapter 2 Status by Business (PDF, Japanese) — 206 tourism facility businesses; 60 recreational lodging businesses with 81 facilities
- MIC, Local Public Enterprise Yearbook FY2023, Chapter 2 Status by Business (PDF, Japanese)
- MIC, Local Public Enterprise Yearbook FY2021, Chapter 2 Status by Business (PDF, Japanese)
- MIC, Local Public Enterprise Yearbook FY2019, Chapter 2 Status by Business (PDF, Japanese)
- MIC, Summary of Survey Results on the Status of Third-Sector Entities (as of March 31, 2025; PDF, Japanese)
- MIC, Third-Sector Entities: list of survey results (Japanese)
- MIC, Survey Results on the Introduction of the Designated Manager System for Public Facilities (as of April 1, 2018; PDF, Japanese)
- MIC press release: Publication of Survey Results on the Introduction of the Designated Manager System for Public Facilities (Japanese)
- MIC, Direction for Fundamental Reform of Tourism and Other Businesses (Recreational Lodging) (PDF, Japanese)
- Japan Tourism Agency, Overnight Travel Statistics Survey (2025 annual, preliminary) (published February 27, 2026; Japanese)
■ Municipal documents and tender information
- Ueda City: Sale of city-owned property (land and buildings) by open proposal competition (former kokumin shukusha 鹿月荘 and former Kakeyu Health Center “Kurhaus Kakeyu”) (Japanese)
- Kurayoshi City: Notice of the completion ceremony for “HOTEL Hoshitori Terrace Sekigane” (operator: Ryutsu Co., Ltd.; opened April 26, 2025; Japanese)
- Minakami Town: FY2024 call for operators by open proposal competition for the former “Ichiyotei (New Wing)” (Japanese)
- Iga City: Sale of city-owned property by open proposal competition (Oyamada Onsen and Shimagahara Onsen) (Japanese)
- Yanai City: Sale of the former Kokumin Shukusha Uzushio-so site (Japanese)
■ News reports and press releases
- Kahoku Shimpo: Private transfer of Oshu’s Koromogawa-so settled; to reopen next summer (July 31, 2022; Japanese)
- Iwate Nichinichi: “ITSUMU” to open on the 25th as an Oshu–Hiraizumi tourism base; former Koromogawa-so transferred by the city to the private sector (April 22, 2025; Japanese)
- Libera Gaming Operations Co., Ltd.: Press conference and preview held ahead of the grand opening of “Oshu Hiraizumi Onsen Ryokan ITSUMU” (Japanese)
- Ryutsu Co., Ltd.: “HOTEL Hoshitori Terrace Sekigane”, with universal design in every room, opens in Sekigane Onsen (Japanese)
- Ryutsu Co., Ltd.: Preferred negotiating rights obtained for the redevelopment of “Kokumin Shukusha Green Scole Sekigane” (September 2, 2022; Japanese)
- San-in Chuo Shimpo: Former Kurayoshi kokumin shukusha renovated; Sekigane hotel to open April 26 (Japanese)
- Kanko Keizai Shimbun: Wajima City, Ishikawa, sells former hotel site by public tender; lodging with dining facilities required (March 30, 2025; Japanese)
- Relo Hotel Solutions: GOP margin benchmarks by property type (Japanese)
- Invincible Investment Corporation: Hotel portfolio (operating GOP margin)