

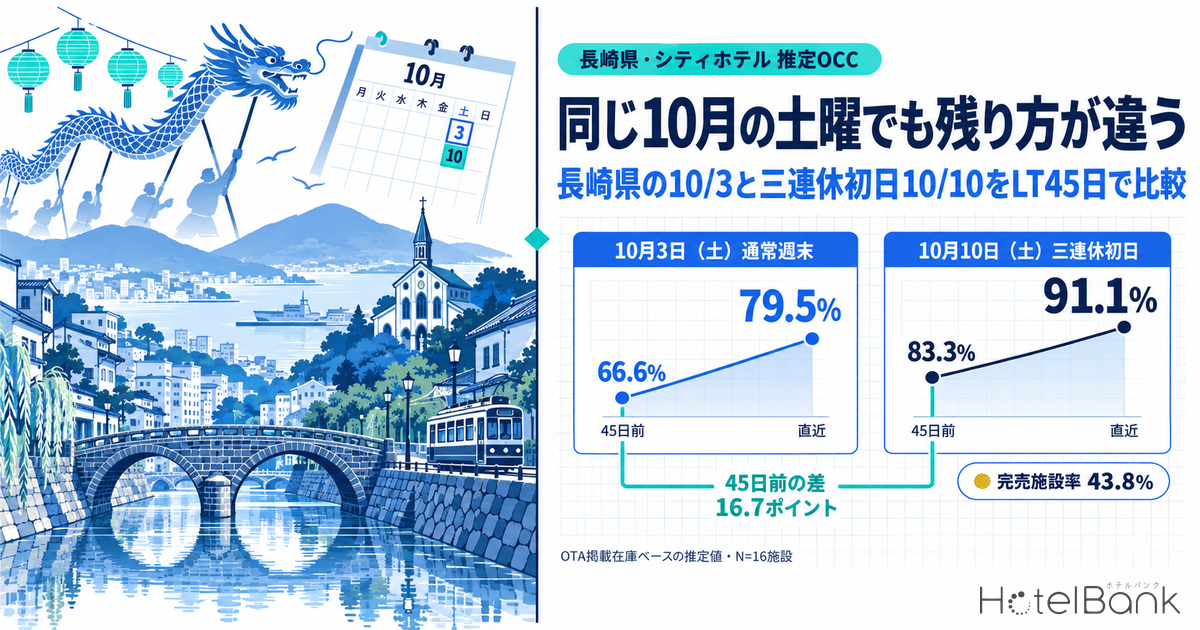
In Nagasaki, two Saturdays in the same October turned out to be entirely different animals in terms of how rooms were left unsold. Tracking from 45 days before the stay date through the most recent observation, estimated OCC (based on inventory listed on major booking sites) at city hotels rose from 66.6% to 79.5% — a 12.9-point build-up — for the ordinary weekend of Saturday, October 3, 2026. Saturday, October 10, the first day of the three-day weekend, was already at 83.3% at the 45-day mark and has since reached 91.1%. Standing at the same 45-day checkpoint, one is “a Saturday with a third of the rooms still open” and the other is “a Saturday that is already 80% full” — and the moves available from that point on are entirely different. This article lines up both dates across three hotel categories in Nagasaki — city, business and resort — using a three-point frame of 45 days out, 30 days out and the latest reading, then works down to last-minute inventory allocation, plan exposure and how to handle minimum-stay rules.
About the data in this article — Coverage: Nagasaki city hotels N=16 properties (1,513 rooms) / business hotels N=58 properties (4,699 rooms) / resort hotels N=30 properties (2,353 rooms), all based on inventory listed on major booking sites. The price metric in this article is estimated settled ADR (the transacted price level estimated from sales data on booking sites and other channels, tax-excluded equivalent); occupancy is an estimate based on listed OTA inventory. Definitions for both appear at the end of the article. Data as of September 19, 2026.
- — The starting points 45 days out differ by 16.7 points. Nagasaki city hotels stood at an estimated OCC of 66.6% for the ordinary weekend of October 3 (observed August 19, 2026; N=16 properties), versus 83.3% for October 10, the first day of the long weekend (same checkpoint).
- — The build-up runs opposite to the level. From 45 days out to the latest reading (observed September 18, 2026), city hotels added +12.9 points for October 3 and +7.8 points for October 10. Business hotels are the exception: October 10 added a larger +10.6 points.
- — The sold-out property rate is 43.8% versus 0.0%. At the latest reading, 7 of the 16 city hotels had no listed inventory left for October 10, while every property still had rooms for October 3. The value of remaining inventory and the value of exposure swap places.
- — Only the first day of the long weekend is strong. At the 30-day cross-section, city hotels run 85.6% on the 10th, 76.7% on the 11th and 60.3% on the 12th — a 25.3-point trough in two days. Resorts fall more gently, from 82.1% to 74.5% to 68.2%.
- — A weekday event links up with the long weekend. Nagasaki Kunchi runs October 7–9, 2026, and its closing Friday sits at 75.7% for city hotels at the 30-day mark — above the 72.0% recorded for Saturday, October 3.
The starting point 45 days out is already different
The first thing to grasp is the gap in where the two dates start. Compared at the same 45-day checkpoint, Nagasaki city hotels (N=16 properties) stood at 66.6% for October 3 and 83.3% for October 10 — a spread of 16.7 points. Resort hotels (N=30 properties) show a similar 11.6-point gap, 66.3% against 77.9%. Business hotels (N=58 properties) come in at 65.1% versus 68.8%, a difference of only 3.7 points, marking them as the category that absorbs the least of the long-weekend demand.
This is the point that matters most in day-to-day operations: inventory for the first day of a long weekend is already close to settled 45 days out. Leisure demand moves early, so for a stay date already above 80% at the 45-day mark, there is structurally little room left to add, no matter how you move price or exposure over the remaining 45 days. An ordinary weekend like October 3, by contrast, still has a third of its rooms open at that point, leaving genuine room for what you stack on between then and arrival to change where the date lands. Treating every “Saturday in October” the same way creates lost opportunity right here.
Source: MetroEngines Research; compiled by the HotelBank Editorial Team
The shape of the curves is equally contrasting. For October 3, city hotels added 5.4 points over the 15 days from 45 to 30 days out (66.6% → 72.0%) and 7.5 points over the following 15 days to the latest reading, 15 days before the stay (72.0% → 79.5%) — the back half is the steeper stretch. This is the classic late-build pattern. For October 10, city hotels moved 2.3 points from 45 to 30 days out (83.3% → 85.6%) and 5.5 points from 30 days out to the latest reading, 22 days before the stay (85.6% → 91.1%). That is 7.8 points in total, less than the 12.9 points for October 3. The level is high, but as a curve it is a date that has largely finished moving.
Resort hotels show the same structure. October 3 runs 66.3% → 71.1% → 76.6%, a total build of 10.3 points; October 10 runs 77.9% → 82.1% → 85.8%, a total of 7.9 points. Business hotels alone invert the pattern: October 3 goes 65.1% → 69.2% → 72.5% (7.4 points in total), while October 10 goes 68.8% → 73.7% → 79.4% (10.6 points), growing more strongly into the final stretch on the long-weekend side. At properties built around business demand, the role of catching long-weekend leisure guests kicks in within 30 days rather than at the 45-day mark. We applied the same three-point framework to the first half of September in Nagasaki in Nagasaki Early Sep Booking Curves: 9/12 OCC 82.7%, Ryokan 24.2pt Gap, which lets you compare how the differences between categories show up from one month to the next.
Lining the dates up in a three-point frame: 45 days, 30 days, latest
Putting the numbers into a table on the three-point frame makes each category’s habits around leaving rooms unsold immediately visible. The sold-out property rate (the estimated share of properties whose listed inventory can no longer be found on booking sites) is shown alongside.
| Category / stay date | 45 days out | 30 days out | Latest | Total build | Latest sold-out rate |
|---|---|---|---|---|---|
| City — Oct 3 (Sat, ordinary weekend) | 66.6% | 72.0% | 79.5% | +12.9pt | 0.0% |
| City — Oct 10 (Sat, first day of long weekend) | 83.3% | 85.6% | 91.1% | +7.8pt | 43.8% |
| Business — Oct 3 | 65.1% | 69.2% | 72.5% | +7.4pt | 12.1% |
| Business — Oct 10 | 68.8% | 73.7% | 79.4% | +10.6pt | 25.9% |
| Resort — Oct 3 | 66.3% | 71.1% | 76.6% | +10.3pt | 6.7% |
| Resort — Oct 10 | 77.9% | 82.1% | 85.8% | +7.9pt | 10.0% |
The latest reading was observed on September 18, 2026 (15 days before the stay for October 3, 22 days before the stay for October 10). Source: MetroEngines Research; compiled by the HotelBank Editorial Team
The most striking figure is the gap in the sold-out property rate. For October 10, city hotels stand at 43.8% at the latest reading — that is, 7 of the 16 properties in scope no longer show any listed inventory. October 3 sits at 0.0%, with every property still holding something back. Business hotels show more than a twofold gap as well, 25.9% against 12.1%. The first day of the long weekend has entered a phase in which the market as a whole is running thin on choices. For the properties that still have rooms, fewer comparison options make it easier for price to hold up; October 3, with inventory spread across the whole market, is more likely to come down to a straight contest on rate.
Viewing the three-day weekend together with the weekdays that precede it
Looking at October 10 in isolation leads to the wrong call. The October 2026 long weekend runs Saturday the 10th, Sunday the 11th and Monday the 12th (Sports Day, which falls on the second Monday of October; Japanese Public Holidays Calendar). On top of that, Nagasaki City hosts Nagasaki Kunchi, the autumn grand festival of Suwa Shrine, scheduled for Wednesday, October 7 through Friday, October 9, 2026 (Nagasaki Tabinet, Nagasaki City). A demand event lands midweek from Wednesday to Friday and the long weekend begins the very next day — a sequence particular to Nagasaki in the first half of October.
Lining up six stay dates at the same 30-day checkpoint makes that sequence show up clearly in the numbers.
Source: MetroEngines Research; compiled by the HotelBank Editorial Team
Friday, October 9 — the closing day of Kunchi — sits at 75.7% for city hotels, 66.7% for business hotels and 70.7% for resorts at the 30-day mark. That is not extraordinary against a typical Friday, but it is above the 72.0% recorded by city hotels for Saturday, October 3, and clearly high for a weekday. Then the 10th (Saturday) jumps to 85.6% for city hotels, the 11th (Sunday) falls back to 76.7% for city and 74.5% for resorts, and the 12th (Monday, a public holiday) drops to 60.3% for city, 56.1% for business and 68.2% for resorts. The long weekend follows a pattern where only the first day is strong, with clear slack on the middle and closing days.
The drop on the final day reflects itineraries built around heading home. Here resort hotels (68.2%) sit above city (60.3%) and business (56.1%), suggesting that stay-oriented demand carries through to the last day. Even within the same long weekend, urban lodging demand concentrates on the first night while stay-oriented demand spreads out. How you sell the holiday should depend on which of those two your property is.
For reference, Saturday, October 17 — the weekend after the long weekend — stands at 80.0% for city, 70.5% for business and 77.4% for resorts at 45 days out, and 80.1% for city, 75.9% for business and 84.5% for resorts at 30 days out. It is tracking above October 3, which shows that Nagasaki in the first half of October has a within-month distribution where ordinary weekends are relatively thin and the holiday and the days around it are thick. A comparable October long weekend in a different market showed the same pattern of Saturday running ahead of the rest of the holiday, and comparing markets with different category mixes makes it easier to place where your own property sits.
Checking baseline strength by day of week — the August 2026 pattern
Before turning to specific dates, it is worth confirming Nagasaki’s underlying strength by day of week. Averaging the daily actuals for August 2026, a completed month (estimated OCC, based on listed OTA inventory), by day of week gives the following.
Daily actuals for August 2026 averaged by day of week. Source: MetroEngines Research; compiled by the HotelBank Editorial Team
City hotels (N=15–16 properties) bottom out at 78.1% on Monday and peak at 89.7% on Saturday, a spread of 11.6 points. Business hotels (N=55–58 properties) bottom at 67.6% on Sunday and peak at 84.7% on Wednesday, a 17.1-point spread — the widest weekly swing of the three categories. Resort hotels (N=27–30 properties) run from 76.2% on Monday to 86.4% on Saturday, 10.2 points, with a comparatively shallow midweek trough. Monthly averages are 82.8% for city, 78.5% for business and 80.1% for resorts.
Business hotels running high from Tuesday to Thursday at 83.0–84.7% and falling off into the weekend — 77.1% on Friday, 80.0% on Saturday and 67.6% on Sunday — shows that the business hotel stock in Nagasaki is built on weekday corporate travel. That is precisely why the 10.6-point build at business hotels for the first day of the long weekend matters: inventory that would normally loosen on a Saturday instead moves toward filling on the opening day of a holiday. This is where it is worth comparing your own weekday-versus-weekend occupancy gap against the market’s shape.
A yardstick for price — monthly estimated settled ADR
We do not go down to daily or day-of-week pricing here, but the monthly estimated settled ADR (tax-excluded equivalent) works as a yardstick for the price band. Year-on-year comparisons between completed months in Nagasaki are as follows.
| Category | Aug 2025 (confirmed) | Aug 2026 (confirmed) | YoY | Oct 2026 (current estimate) |
|---|---|---|---|---|
| City hotels (N=24–25 properties) | ¥15,648 | ¥13,476 | -13.9% | ¥16,468 |
| Business hotels (N=122–128 properties) | ¥7,070 | ¥7,097 | +0.4% | ¥10,374 |
| Resort hotels (N=35–37 properties) | ¥20,284 | ¥18,739 | -7.6% | ¥18,683 |
The October 2026 figure is an estimate based on current selling conditions and may change. Wait for month-end confirmation before comparing it directly with confirmed figures. Source: MetroEngines Research; compiled by the HotelBank Editorial Team
Comparing completed months, August 2026 came in at -13.9% year on year for city hotels and -7.6% for resorts, while business hotels were essentially flat at +0.4%. The contrast is that leisure-oriented categories priced below the prior year in the peak summer month, while business hotels, supported by weekday demand, held their level. The October 2026 figures are estimates based on current selling conditions; rather than comparing them directly with confirmed figures, treat them as a guide to the price band the market is currently selling at.
For revenue managers running city, business and resort hotels in Nagasaki — implications and an action plan
(1) Do not sell “the same Saturday” from the same template. City hotels in this market start from points 16.7 points apart at the 45-day mark — 66.6% for October 3 and 83.3% for October 10. Line up your own booking progress for both dates at the same checkpoints (45 days and 30 days out) and check whether the same gap appears at your property. If your gap is narrower than the market’s, it is worth suspecting either that you are missing the first day of the long weekend or that you are selling the ordinary weekend too early.
(2) Read the remaining upside from the slope of the curve. For October 3, city hotels added 7.5 points from 30 days out to the latest reading, and the sold-out property rate is still 0.0%. With inventory left across the whole market, the contest for last-minute bookings is still ahead. October 10, by contrast, shows a 43.8% sold-out rate and a total build of just 7.8 points from 45 days out. Remaining rooms carry value in the latter case; securing exposure is what works in the former.
(3) Treat the first, middle and last day of the long weekend as separate products. At the 30-day cross-section, city hotels fall from 85.6% on the 10th to 76.7% on the 11th to 60.3% on the 12th — 25.3 points in two days. Resorts fall more gently, 82.1% → 74.5% → 68.2%. If your property is urban, there is a case for moving final-day inventory early; if it is stay-oriented, for capturing the final day through multi-night stays.
(4) Design the weekday event and the long weekend as a single run of demand. Friday, October 9, inside the Kunchi window of October 7–9, sits at 75.7% for city hotels at the 30-day mark, above the 72.0% recorded for Saturday, October 3. Whether you can build a path that avoids leaving a one-day trough between the weekday demand peak and the first day of the long weekend — through multi-night or extended-stay offers — is what will drive total roomnights across the first half of October.
| Time horizon | Move | Decision trigger | Objective |
|---|---|---|---|
| Today to this week (T-21 to T-14) | Review minimum-stay and multi-night restrictions on October 10 and carve out an allocation that accepts single-night stays | When your own progress for October 10 falls short of the market’s 91.1% (city) / 79.4% (business) / 85.8% (resort) | Capture the remaining one-night demand in a market where the sold-out rate has risen |
| Today to this week | Bundle October 12 (Mon, holiday) inventory as an extended-stay product off October 10 and 11 | When your own October 12 is the weakest date within the holiday, as in the market’s 30-day levels (city 60.3%, business 56.1%) | Lift the final-day trough using the strength of the opening day |
| Within two weeks (T-14 to T-7) | Increase the number of plans on display and the inventory allocated to Saturday, October 3 ahead of the last-minute phase | When your own October 3 is below the market’s latest 79.5% (city), 72.5% (business) or 76.6% (resort) | Secure impressions in a phase where the sold-out rate is 0.0% — every property still has rooms |
| Within two weeks | Prepare a two-night product spanning Friday, October 9 and Saturday, October 10 | When your own progress on the 9th is at or above the market’s 30-day levels of 75.7% (city) and 70.7% (resort) | Bundle the weekday event and the first day of the long weekend into a single stay |
| Looking to next month (late October to November) | Shift to reviewing ordinary weekends from Saturday, October 17 onward every week at the 45-day checkpoint | Whether you can reproduce at your own property the market fact that October 17 sits at 80.0% (city) and 77.4% (resort) at 45 days out — above October 3 at the same checkpoint | Identify within-month weekend disparities early and write them into the pricing calendar |
| Looking to next month | Reset next month’s baseline by checking your October price band against the monthly market level | When your October settings sit far from the market’s current estimates (city ¥16,468, business ¥10,374, resort ¥18,683) | Update your sense of the price range, bearing in mind that these are estimates |
* The above indicates where opportunities lie and does not guarantee results. Select among them according to your own catchment, guest mix and sales design.
In summary — three yardsticks to take away
Yardstick 1: Sort stay dates into three groups by their level 45 days out. Among Nagasaki city hotels, October 10 at 83.3% and October 3 at 66.6% sat side by side as Saturdays in the same month. Once you sort dates up front into “days to defend” when the 45-day level is high and “days to go after” when it is low, the priority of everything that follows sets itself.
Yardstick 2: Measure last-minute upside by the total build (the point gap from 45 days out to the latest reading). City hotels added +12.9 points for October 3 and +7.8 points for October 10. Business hotels invert it, with October 10 adding a larger +10.6 points. Looking at the slope rather than the level gives you a sense of how many points you can still go after.
Yardstick 3: View a long weekend at three points — first day, middle day, final day. At the 30-day cross-section, city hotels run 85.6% → 76.7% → 60.3%. Treat the holiday as a single block and the 25.3-point trough on the final day stays invisible. Whether you can channel the strength of the opening day into the last one determines total roomnights across the whole holiday.
Metric Definitions Used in This Article
- Definition of estimated OCC (based on listed OTA inventory): occupancy based on listed OTA inventory = 100 − 100 × rooms still listed on OTAs ÷ total rooms. Coverage is a fixed cohort of properties listing at least 30% of their total rooms on OTAs (the same set of properties for every stay date). It is an estimate based on how listed OTA inventory is being sold down, and its definition differs from actual room occupancy (it reads higher because rooms not listed are counted on the sold side). The target month is October 2026 (day-of-week actuals are for August 2026 only).
- Booking curve: based on observations from 45 days before the stay date through the most recent reading. The latest cross-section in this article was observed on September 18, 2026, which is 15 days before the stay for October 3 and 22 days before the stay for October 10.
- Definition of estimated settled ADR: the transacted price level (tax-excluded equivalent) estimated from sales data on OTAs and other channels (lowest-plan level × category-specific coefficient, ensembled across multiple channels). Past months are confirmed figures; the current and future months are estimates based on current selling conditions. Median error against published operating results is 6.6%.
- Breakdown of N: for the booking curves, Nagasaki city hotels N=16 properties (1,513 rooms), business hotels N=58 properties (4,699 rooms), resort hotels N=30 properties (2,353 rooms). For the day-of-week actuals (August 2026), city N=15–16, business N=55–58, resort N=27–30 properties (varying by day). For estimated settled ADR, city N=24–25, business N=122–128, resort N=35–37 properties (varying by month). The sold-out property rate is an estimate of the share of properties whose listed inventory can no longer be found on OTAs and similar channels.
- Data as of September 19, 2026. Selling conditions and inventory change daily, so the figures in this article are a snapshot at the time of retrieval.
References and Sources
■ Data sources
Booking progress is based on our own aggregation of room inventory listed on major booking sites in Nagasaki, observed daily from 45 days before each stay date (city hotels N=16 properties / 1,513 rooms; business hotels N=58 properties / 4,699 rooms; resort hotels N=30 properties / 2,353 rooms — a fixed cohort using the same set of properties for every stay date). Baseline strength by day of week uses daily actuals for August 2026, and price levels use monthly estimated settled ADR. Data as of September 19, 2026.
■ Calculation assumptions
Estimated OCC (listed-inventory basis) is calculated as “100 − 100 × rooms still listed ÷ total rooms”, with the cohort made up of properties listing at least 30% of their total rooms. Estimated settled ADR is the transacted price level (tax-excluded equivalent) estimated from sales data, with a median error of 6.6% against published operating results. The latest cross-section was observed on September 18, 2026, which is 15 days before the stay for October 3 and 22 days before the stay for October 10. The sold-out property rate is an estimate of the share of properties whose listed inventory can no longer be found.
■ Limitations and caveats
Estimated OCC is an estimate based on how listed inventory is being sold down, and reads higher than actual room occupancy because rooms not listed are counted on the sold side. The estimated settled ADR for October 2026 is based on current selling conditions and cannot be compared directly with confirmed figures. Selling conditions and inventory change daily, so the figures in this article are a snapshot at the time of retrieval, and the implications described indicate where opportunities lie rather than guaranteeing results.
- Nagasaki Kunchi 2026 | Nagasaki Tabinet
- When and where can you see Nagasaki Kunchi? | Nagasaki City
- Nagasaki Kunchi | Nagasaki Traditional Performing Arts Promotion Association
- October Public Holidays 2026 | Sports Day
Frequently Asked Questions
Both are Saturdays in October — what actually differs between October 3 and October 10?
Their starting points at the same 45-day checkpoint differ. Estimated OCC (listed-inventory basis) at Nagasaki city hotels was 66.6% for October 3 and 83.3% for October 10, the first day of the long weekend, a gap of 16.7 points (observed August 19, 2026; N=16 properties). At the latest reading on September 18, 2026, they stand at 79.5% and 91.1%. October 10 was already 80% full at the 45-day mark, making it a stay date with structurally little room left to add.
How much do the first, middle and final days of the long weekend differ?
At the 30-day cross-section, city hotels stand at 85.6% on October 10, 76.7% on the 11th and 60.3% on the 12th (Monday, Sports Day) — a fall of 25.3 points over two days. Resort hotels run 82.1% → 74.5% → 68.2%, a gentler decline in which stay-oriented demand carries through to the final day. There is a case for designing the first, middle and final days of a long weekend as separate products.
How should the sold-out property rate be read?
At the latest reading, the sold-out property rate for city hotels is 43.8% for October 10 (7 of the 16 properties in scope no longer show listed inventory) and 0.0% for October 3, where every property still has rooms. The former is a phase in which remaining rooms themselves carry value because there are fewer comparison options; the latter is one in which securing exposure works, because inventory remains across the market.
How does Nagasaki Kunchi affect supply and demand in the first half of October?
Nagasaki Kunchi 2026 is scheduled for Wednesday, October 7 through Friday, October 9, putting a demand event on weekdays with the long weekend beginning the next day. The closing day, Friday, October 9, sits at 75.7% for city hotels and 70.7% for resorts at the 30-day mark, above the 72.0% recorded by city hotels for Saturday, October 3. What matters is whether you can build a path that avoids leaving a trough between the weekday peak and the first day of the long weekend.
Is the estimated OCC in this article the same as actual room occupancy?
No. The estimated OCC here is a listed-inventory estimate calculated as “100 − 100 × rooms still listed ÷ total rooms”, covering a fixed cohort of properties that list at least 30% of their total rooms. Because rooms not listed are counted on the sold side, it reads higher than actual room occupancy. Use it to read the gaps between stay dates and the slope over time rather than the absolute level.
Related reading
- Nagasaki Early Sep Booking Curves: 9/12 OCC 82.7%, Ryokan 24.2pt Gap (September 2026, Nagasaki / listed-inventory estimate)
- Nagasaki Kunchi vs. Kishiwada Danjiri: Weekday vs. Weekend Hotel Demand