

On 16 June 2026, the Bank of Japan raised its target for the uncollateralized overnight call rate to around 1.0% at its Monetary Policy Meeting. Reports indicate the market has priced in a substantial probability of a further hike at the 17-18 September meeting. When rates move, the first line in a hotel REIT’s income statement to react is neither ADR nor occupancy — it is interest expense.
This article breaks down the debt side of Japan’s seven major hotel REITs. Interest-bearing debt, LTV, fixed-rate ratio, weighted-average remaining maturity, the spread of repayment dates, and credit ratings are lined up side by side from each REIT’s own IR disclosures. We then model what happens to distributions over five years if funding costs rise uniformly by +0.5% and +1.0% — specifically, when and in what order the impact lands. The headline finding: across the seven, the difference in timing matters far more than the difference in magnitude.
How this differs from our earlier coverage. We have previously examined hotel REITs from three angles: (1) the equity side — NAV multiples and equity-raise terms; (2) the feasibility of new development — the interest-rate level at which a project still pencils out; and (3) the asset side — acquisition prices, appraisal values, and capital expenditure. This article is none of those. Its subject is the borrowings that support the portfolios already owned, and both the transmission mechanism and the time horizon (the arrival of refinancing) differ from all three.
Metric Definitions Used in This Article
- Interest-bearing debt: The sum of loans payable and investment corporation bonds. Figures are quoted directly from each REIT’s IR disclosures, with the reference date stated alongside.
- LTV: Interest-bearing debt divided by assets. Because the level shifts materially depending on whether the denominator is total assets (book value) or appraisal value (market value), every figure in this article states which basis applies. Any side-by-side comparison must first align the basis.
- Fixed-rate ratio: The share of interest-bearing debt carrying a fixed rate. This includes floating-rate borrowings effectively fixed via interest-rate swaps (following each REIT’s own definition).
- Weighted-average remaining maturity (duration): The remaining period to the repayment deadline of interest-bearing debt, weighted by outstanding balance.
- ADR (Average Daily Rate): The ADR, OCC, and RevPAR quoted here as REIT operating results are the actual monthly figures each REIT disclosed, not our own estimates. Transacted ADR in REIT disclosures is shown excluding consumption tax.
- Data sources: Each REIT’s IR disclosures (earnings releases, financial information pages, monthly operating results), Japan Credit Rating Agency (JCR), Rating and Investment Information (R&I), and MetroEngines Research’s REIT ownership master.
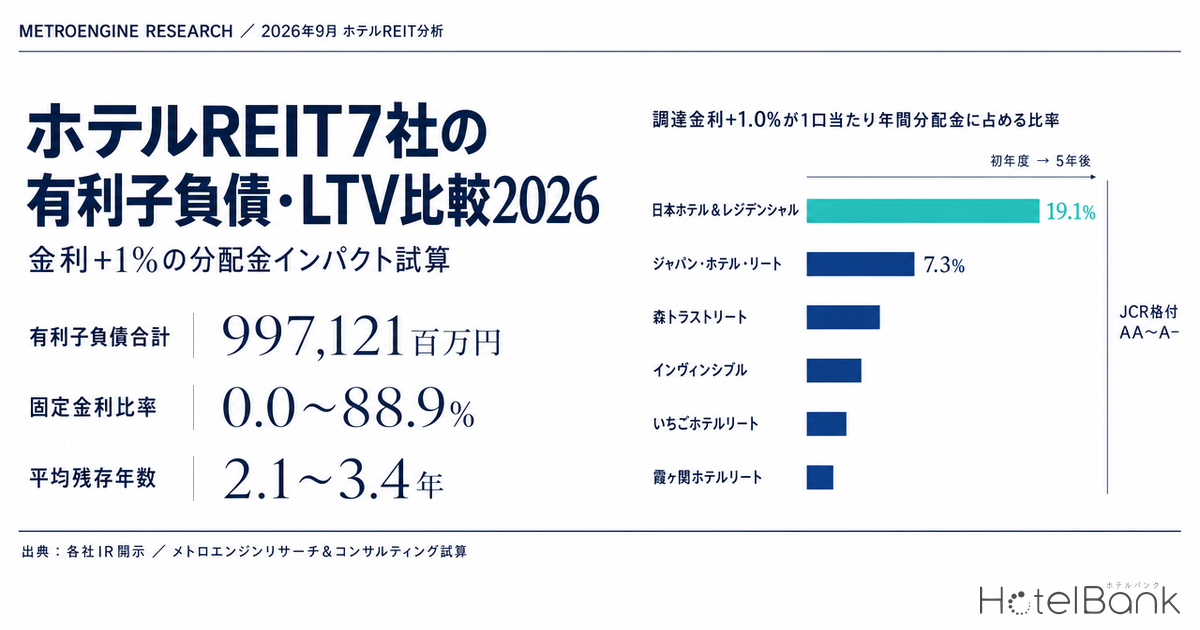
- — Fixed-rate ratios span 0.0% to 88.9% across the seven REITs. Lining up LTV alone tells you nothing about how a rate shock propagates.
- — Five years after a +1.0% move in funding costs, the landing point is equivalent to 7.3%-19.1% of annual distribution per unit. The spread is only about 2.6x.
- — In the first year, however, the range is 1.9%-19.1% — roughly a tenfold gap. What creates it is not asset-management skill but the floating-rate share and the timing of refinancing.
- — Interest-bearing debt per room runs ¥8.6mn to ¥21.8mn. This tracks RevPAR levels closely, so the relative weight of the burden differs little across the seven.
- — Within a single REIT at an unchanged rating, bond coupons have gone from 0.600% to 2.052%. The rising price of refinancing is already an observable fact.
Debt structure of the seven REITs — ¥997,121mn across the six that disclose, with fixed-rate ratios from 0.0% to 88.9%
We start by putting each REIT’s latest disclosure on a single page. The most important point here is that lining up LTV side by side is not a comparison. The 34.5% Japan Hotel REIT discloses is on a market-value (appraisal) basis; Invincible’s 41.9% is on the same market-value basis, but on a total-asset (book-value) basis it becomes 49.2%. The 46.8% figures for Mori Trust REIT, Ichigo Hotel REIT, and Nippon Hotel & Residential are all total-asset based, and would come down if restated to market value. The table states every basis explicitly.
| REIT (code) | Interest-bearing debt | Reference date | LTV | LTV basis | Long-term ratio | Fixed-rate ratio | Avg remaining maturity | Avg funding cost | JCR rating |
|---|---|---|---|---|---|---|---|---|---|
| Japan Hotel REIT (8985) | ¥334,355mn | 30 Jun 2026 | 34.5% | Market value | 100.0% | 78.5% | 3.4 yrs | — | AA−/stable |
| Invincible (8963) | ¥348,654mn | 30 Jun 2026 | 41.9% (49.2%) |
Market value (book value) |
— | 59.8% | 3.1 yrs | 1.46% | AA−/stable |
| Mori Trust REIT (8961) | ¥220,500mn | 28 Feb 2026 | 46.8% | Book value | 89.3% | 88.9% | 2.1 yrs | 0.86% | AA/stable |
| Ichigo Hotel REIT (3463) | ¥38,020mn (loans payable) |
25 Aug 2026 | 46.8% | Book value | 61.6% (our aggregation) |
— | 1.29249% (end of Jan 2026 period) |
Unrated | |
| Nippon Hotel & Residential (3472) | ¥32,956mn | 31 May 2026 | 46.8% | Book value | 99.1% | 0.0% | — | — | A−/stable |
| Kasumigaseki Hotel REIT (401A) | ¥22,636mn | 31 Jul 2026 | — (to be disclosed after 1st period) |
Total assets / market value | 90.6% (our aggregation) |
70.7% (our aggregation) |
— | — | A−/stable |
| Hoshino Resorts REIT (3287) | — | 30 Apr 2026 | 40.8% | Book value | — | — | — | — | A+/stable |
Source: each REIT’s IR disclosures (Japan Hotel REIT “Financial Summary” as of 30 Jun 2026 / Invincible “Financial Results for the Fiscal Period Ended Jun 2026” dated 25 Aug 2026 and “Financial Highlights” / Mori Trust REIT “Interest-Bearing Debt” as of 28 Feb 2026 / Ichigo Hotel REIT “Loans and Investment Corporation Bonds” as of 25 Aug 2026 and 21st fiscal period results / Nippon Hotel & Residential “Financial Results for the Fiscal Period Ended May 2026” dated 22 Jul 2026 and “Interest-Bearing Debt List” as of 31 May 2026 / Kasumigaseki Hotel REIT “Loans” as of 31 Jul 2026 / Hoshino Resorts REIT 26th fiscal period results), and Japan Credit Rating Agency. “Our aggregation” means MetroEngines Research & Consulting compiled the figure from the individual loan schedules each REIT publishes. “—” indicates the REIT does not disclose that item; we have not filled such gaps with estimates. Hoshino Resorts REIT is referenced in this article for LTV only, as an industry benchmark.
One caveat should be stated plainly: the reference dates are not aligned. They range from Mori Trust REIT’s 28 February 2026 to Kasumigaseki Hotel REIT’s 31 July 2026 — a gap of up to five months, reflecting differing fiscal year-ends. This is therefore not a strict point-in-time comparison. Even so, the fact that fixed-rate ratios span 0.0% to 88.9% is a structural difference that a five-month offset cannot explain.
Mori Trust REIT is a diversified REIT holding offices and retail as well: of its 20 properties, six are hotels. Its borrowings therefore do not all support hotels. In the modelling that follows, its figures should be read with the caveat that this is not a like-for-like comparison against hotel-only REITs.
Two axes: fixed-rate ratio and duration — how thick the shield is and how long it lasts are different questions
Resilience to rising rates is often discussed through a single number: the fixed-rate ratio. But that is only half the picture. Fixing determines how thick the shield is right now; what determines how long the shield lasts is weighted-average remaining maturity. A fixed-rate ratio of 88.9% with a duration of 2.1 years means the shield is replaced within two years. A ratio of 78.5% with a duration of 3.4 years means a thinner shield that lasts longer.
Source: compiled by MetroEngines Research & Consulting from each REIT’s IR disclosures (N=4 REITs; only the four disclosing weighted-average remaining maturity are plotted. Nippon Hotel & Residential discloses a 0.0% fixed-rate ratio but not its remaining maturity, so a weighted-average of 1.8 years calculated from its individual loan schedule is shown as a dashed bubble for reference).
The further to the upper right, the thicker the shield and the longer it holds. Japan Hotel REIT (78.5% fixed / 3.4 years) and Invincible (59.8% / 3.1 years) are both large and long-dated. Mori Trust REIT (88.9% / 2.1 years) is the most heavily fixed of the seven, yet has the shortest remaining maturity — meaning it is the best protected today and also the first to enter a refinancing phase. These are not contradictory; they are two sides of the same financial policy (borrow short at tight spreads, then fix via swaps). Consistent with that, its period-end average interest rate of 0.86% is the lowest among the seven disclosed figures.
The spread of repayment dates — REITs with refinancing bunched in 2027, and one stretching to 2034
There are only two channels through which rising rates hit distributions: the portion that reprices immediately on floating-rate debt, and the portion that reprices sequentially as refinancings fall due each year. Reading the latter requires building up repayment dates from the individual loan schedules each REIT publishes. For the four REITs that publish loan-by-loan detail, we aggregated maturing amounts by calendar year.
Source: compiled by MetroEngines Research & Consulting from the loan and bond schedules in each REIT’s IR disclosures (Japan Hotel REIT N=49 loans + 6 bonds, ¥334,301mn / Ichigo Hotel REIT N=15 loans, ¥38,020mn / Nippon Hotel & Residential N=8 loans, ¥32,955mn / Kasumigaseki Hotel REIT N=8 loans, ¥22,636mn). Aggregated by the calendar year containing the final repayment date. Amortizing principal is booked in full at final maturity, so some repayment in practice occurs earlier.
The shapes differ clearly. Japan Hotel REIT is spread across nine years from 2026 to 2034, with no single year accounting for more than 17% of the total. Even the four facilities drawn on 13 March 2026 (¥22,000mn / ¥8,000mn / ¥10,000mn / ¥25,000mn) were deliberately staggered from 2027 to 2031. Its bonds mature in February 2028, June 2029, September 2030, and September 2032.
Nippon Hotel & Residential, by contrast, has ¥13,545mn (41.1% of the total) falling due in 2027 and ¥11,960mn (36.3%) in 2028, with the entire book turning over by May 2029. All eight of its loans are linked to JBA TIBOR, with spreads of +0.40% to +0.85%. On 29 May 2026 the sponsor guarantee on its debt ended, leaving all interest-bearing debt unsecured and unguaranteed. Having obtained a JCR long-term issuer rating of A− (outlook: stable) in February 2026, the REIT looks to be in a position where the preconditions for moving toward fixing and lengthening its debt are now in place.
At Kasumigaseki Hotel REIT, the seven term loans drawn on 14 August 2025 are concentrated in August 2028, August 2029, and August 2030. Its fixed-rate tranches carry 1.653% to 2.004%, all drawn on 14 August 2025. Having only just completed its first fiscal period (ended January 2026), it states that LTV will be disclosed after its earnings announcement.
Sensitivity — a +1.0% funding cost shifts 7-19% of distributions into interest over five years
Using the structure above, we build up the increase in annual interest expense if funding costs rise uniformly by +0.5% and +1.0%, splitting it into (i) the portion repricing immediately on floating-rate debt and (ii) the portion repricing sequentially as refinancing falls due each year. All assumptions are listed directly beneath the table.
| REIT | Floating-rate balance | Funding cost +0.5% | Funding cost +1.0% | ||||
|---|---|---|---|---|---|---|---|
| Immediate (annual) | Cumulative, 3 yrs | Cumulative, 5 yrs | Immediate (annual) | Cumulative, 3 yrs | Cumulative, 5 yrs | ||
| Japan Hotel REIT | 71,886 | 359 | 848 | 1,254 | 719 | 1,695 | 2,509 |
| Invincible | 140,159 | 701 | 1,093 | 1,428 | 1,402 | 2,186 | 2,857 |
| Mori Trust REIT | 24,475 | 122 | 666 | 1,102 | 245 | 1,333 | 2,205 |
| Ichigo Hotel REIT | 14,600 | 73 | 114 | 165 | 146 | 228 | 330 |
| Nippon Hotel & Residential | 32,956 | 165 | 165 | 165 | 330 | 330 | 330 |
| Kasumigaseki Hotel REIT | 6,632 | 33 | 74 | 113 | 66 | 149 | 226 |
Unit: ¥mn per year (increase in annual interest expense). Source: modelled by MetroEngines Research & Consulting from each REIT’s IR disclosures.
- Interest-bearing debt and fixed-rate ratios are held at the latest disclosed figures in the table above; changes during the period (acquisitions, disposals, equity raises) are not considered.
- NOI, operating revenue, and unit count are held constant. The impact on distributions is simplified so that the increase in interest expense reduces distributable income one-for-one.
- Floating-rate debt is assumed to reprice in full immediately at the point rates change.
- Fixed-rate debt reprices only when its repayment date arrives, at “the current level + Δ”. Annual maturity ratios are calculated from actual amounts in the published loan schedules for Japan Hotel REIT, Ichigo Hotel REIT, Nippon Hotel & Residential, and Kasumigaseki Hotel REIT; for Invincible (3.1-year average remaining maturity) and Mori Trust REIT (2.1 years), which do not publish loan-level detail, maturities are allocated on the assumption that repayment dates are uniformly distributed from 0 years to twice the average remaining maturity.
- Within each year, the fixed/floating mix of maturing debt is assumed to match the mix of the portfolio as a whole.
- Refinancing spreads are held unchanged from current levels, so Δ represents only the change in the reference rate. In practice spreads may move at the same time.
- This model simply adds a uniform Δ on top of existing rates. Accordingly, the lower a REIT’s legacy funding cost, the larger the actual increase on refinancing may be relative to this model (for example, between Mori Trust REIT at a 0.86% period-end average rate and Invincible at 1.46%, refinancing into the same market rate implies a larger step-up for the former).
- “After 3 years” and “after 5 years” cumulate the amounts maturing through end-2028 and end-2030 respectively.
Absolute amounts scale with size, so they are not comparable on their own. The chart below restates the same model as a ratio to distribution per unit.
Source: modelled by MetroEngines Research & Consulting from each REIT’s IR disclosures. The denominator, annual distribution per unit, is ¥5,811 for Japan Hotel REIT (forecast, fiscal period ending Dec 2026); ¥4,135 for Invincible (¥1,949 actual for the period ended Dec 2025 + ¥2,186 actual for the period ended Jun 2026); ¥3,609 for Mori Trust REIT (sum of forecasts for the periods ending Aug 2026 and Feb 2027); ¥6,687 for Ichigo Hotel REIT (sum of forecasts for the periods ending Jul 2026 and Jan 2027); ¥3,989 for Nippon Hotel & Residential (sum of forecasts for the periods ending Nov 2026 and May 2027, including distributions in excess of earnings); and ¥6,465 for Kasumigaseki Hotel REIT (sum of forecasts for the periods ending Jul 2026 and Jan 2027). Unit counts are derived from each REIT’s earnings releases and from market capitalisation divided by unit price as of 2 Sep 2026 (Nippon Hotel & Residential’s 432,307 units matches its disclosed figure).
Three structures emerge.
1. Immediate type — high floating share
With 100.0% of its interest-bearing debt on floating rates, Nippon Hotel & Residential sees the full +1.0% impact from year one — ¥330mn a year, or ¥762 per unit, equivalent to 19.1% of annual distribution — and flat thereafter. In exchange for having no lag, it also benefits immediately when rates fall.
2. Delayed type — heavily fixed, long-dated
Japan Hotel REIT goes from 2.4% in year one to 7.3% after five years, roughly tripling over the period. Because repayment dates run out to 2034, it is still only at 8.6% after six years (end-2031), and full replacement takes longer still.
3. Delayed but fast-converging
Mori Trust REIT starts at 1.9%, the lowest of the six, but with a duration of just 2.1 years the entire book turns over by 2030, reaching 17.2%. The shield is thick, but it is replaced quickly — and assumption 7, that lower legacy rates mean bigger step-ups on refinancing, compounds the effect.
Put another way: against a +1.0% shock, the six REITs’ five-year landing points fall within a range of 7.3% to 19.1%, while the first-year landing points span 1.9% to 19.1% — a tenfold gap. The differences in distributions observed between REITs during a rate-rising phase are, in most cases, not differences in portfolio management but this difference in timing. Conversely, for the delayed-type REITs, the next few years represent breathing room in which to fix and lengthen their debt.
Connecting to the asset side — interest-bearing debt per room of ¥8.6mn to ¥21.8mn
Reducing debt to a per-room basis sharpens the character differences between REITs one step further. Taking each REIT’s total room count from our REIT ownership master (7 hotel REITs, 302 properties in Japan, as of 31 August 2026) and dividing interest-bearing debt by it produces the table below.
| REIT | Properties | Total rooms | Total acquisition price | Interest-bearing debt | Debt per room | OCC | ADR | RevPAR | Scope of monthly disclosure |
|---|---|---|---|---|---|---|---|---|---|
| Japan Hotel REIT | 53 | 15,338 | ¥655,708mn | ¥334,355mn | ¥21.8mn | 83.1% | ¥21,806 | ¥18,119 | 29 hotels with variable rent etc. (Jul 2026) |
| Invincible | 112 | 19,285 | ¥639,037mn | ¥348,654mn | ¥18.1mn | 86.3% | ¥15,100 | ¥13,039 | 101 domestic hotels (Jul 2026) |
| Ichigo Hotel REIT | 29 | 4,418 | ¥71,903mn | ¥38,020mn | ¥8.6mn | 84.4% | ¥9,684 | ¥8,175 | Entire portfolio (Jul 2026) |
| Hoshino Resorts REIT | 71 | 8,667 | ¥233,906mn | — | — | 74.2% | ¥18,478 | ¥13,716 | Entire portfolio (Jun 2026) |
Source: MetroEngines Research’s REIT ownership master (7 hotel REITs, 302 properties in Japan, snapshot as of 31 Aug 2026) and each REIT’s monthly operating results. OCC, ADR, and RevPAR are quoted directly from the monthly actuals each REIT published and are not our estimates. ADR is shown excluding consumption tax. Debt per room is not calculated for three REITs: Nippon Hotel & Residential (16 properties recorded in the master against 31 held), Kasumigaseki Hotel REIT (room-count field not reliably captured in the master), and Mori Trust REIT (a diversified REIT including offices and retail, so its debt is not hotel-specific). Nippon Hotel & Residential, Kasumigaseki Hotel REIT, and Mori Trust REIT are also excluded from the table because they do not publish monthly OCC/ADR/RevPAR covering the entire portfolio. The scope of monthly disclosure differs by REIT, and properties closed for renovation may be excluded.
Interest-bearing debt per room ranges 2.5x, from Ichigo Hotel REIT’s ¥8.6mn to Japan Hotel REIT’s ¥21.8mn. This reflects not financial skill but the price band of the assets held. Ichigo Hotel REIT’s monthly RevPAR is ¥8,175 against Japan Hotel REIT’s ¥18,119 — a ratio of 2.2x, closely tracking the ratio of debt per room. It confirms the unsurprising relationship that the weight of debt is roughly proportional to the revenue those rooms generate.
In other words, the absolute level of debt per room says little about the weight of the burden. A +1.0% rate move generates additional annual interest per room of ¥218,000 at Japan Hotel REIT (¥21.8mn x 1.0%) and ¥86,000 at Ichigo Hotel REIT. Against annualised RevPAR (roughly ¥6.61mn and ¥2.98mn per room respectively), both come in around 3%. The relative weight of the burden does not differ greatly across the seven REITs. What differs is when it surfaces.
Source: MetroEngines Research’s REIT ownership master (N=300 properties, Japan only / snapshot as of 31 Aug 2026. Only properties with usable coordinates are shown). Property names follow each REIT’s disclosed naming.
On the map, differences in debt character overlap to some degree with differences in location. Invincible’s 110 properties are spread thinly across urban centres and tourist areas nationwide; Hoshino Resorts REIT clusters in resort destinations; Kasumigaseki Hotel REIT concentrates in smaller properties in regional core cities. A portfolio with many properties, each of them small, has the characteristic of being able to move LTV nimbly by swapping individual assets.
The price of refinancing is already moving — one REIT’s bond coupons have gone from 0.600% to 2.052%
Our model rests on a “+0.5% / +1.0%” assumption, but how refinancing prices have actually moved can be observed directly by lining up the coupons on bonds a single REIT issued at different times. Japan Hotel REIT’s six issues are as follows.
Source: Japan Hotel REIT “Loans and Investment Corporation Bonds” as of 30 Jun 2026 (N=6 issues, ¥30,700mn outstanding in total)
The 7th and 8th series issued in November 2016 carry 0.600% (10-year); the 10th series of February 2018 carries 0.840% (10-year); the 11th series of June 2019 carries 0.854% (10-year). Up to that point, coupons sat in a 0.6-0.9% range.
Against that, the 15th series issued in September 2025 carries 1.783% (5-year), and the 14th series green bond issued the same day carries 2.052% (7-year). For the same issuer at the same rating (AA−), coupons have stepped up roughly threefold.
In November 2026, the 7th and 8th series — ¥9,000mn plus ¥1,100mn — reach redemption. If they are replaced at current market levels, those two issues alone add roughly ¥120mn to annual interest expense. The “sequential” component in our sensitivity table materialises exactly like this, one facility at a time.
The same thing is happening on the loan side. The REIT’s 2019 drawdowns carry 1-month TIBOR +55-60bps, while its 13 March 2026 drawdowns carry 12-month TIBOR +25bps (¥22,000mn), 1-month TIBOR +27.5bps (¥8,000mn), +35bps (¥10,000mn), and +40bps (¥25,000mn) — meaning spreads have actually tightened. The rise in funding costs therefore comes not from credit spreads but from the increase in the reference rate (TIBOR). An AA− rating on the credit side, alongside spreads that have come down to 25bps, indicates that bank syndicates’ view of hotel assets has not deteriorated even as rates rise.
Conclusion — what matters is not the level of LTV but the time profile of the impact
What lining up the seven REITs makes clear is that LTV, as a single number, is almost useless for comparison. The basis (book or market value) is not aligned, and even at the same LTV, a different fixed-rate ratio and remaining maturity mean a rate shock propagates in an entirely different way.
On credit, six of the seven hold a JCR long-term issuer rating, distributed across AA (Mori Trust REIT), AA− (Japan Hotel REIT, Invincible), A+ (Hoshino Resorts REIT), and A− (Nippon Hotel & Residential, Kasumigaseki Hotel REIT). Invincible was upgraded from A+ to AA− on 13 May 2026; Kasumigaseki Hotel REIT was newly rated on 25 December 2025; and Nippon Hotel & Residential was affirmed on 19 February 2026. No REIT has been downgraded over the past year.
The practical implications for investors and analysts come down to three points.
First, always align the basis before comparing. A table mixing market-value and book-value LTV makes portfolios with large unrealised gains look more heavily levered than they are.
Second, read the fixed-rate ratio and remaining maturity together. The higher the fixed-rate ratio and the longer the duration, the more the impact is pushed out; a high fixed-rate ratio with a short duration converges to market rates within a few years.
Third, look at refinancing amounts by year. Neither the total nor the ratio but which year sees how many tens of billions of yen replaced is what shapes that year’s distribution. Individual loan schedules are published by each REIT, and the profile can be reproduced simply by stacking them up by calendar year.
And for the delayed-type REITs, the current phase is also time still available to fix and lengthen their debt. Japan Hotel REIT securing spreads of 25-50bps at maturities of one to seven years in March 2026, and Nippon Hotel & Residential widening its fixing options through the release of its debt guarantee and the acquisition of a rating, can both be read as moves in that direction. Seen from the debt side, 2026 for hotel REITs is less a phase of rising rates than a phase in which there is still grace to restructure the funding mix.
Related reading
References and Sources
Data sources
Financial materials disclosed by each REIT’s IR (earnings releases, financial highlights, loan and bond schedules, rating information); rating lists from Japan Credit Rating Agency (JCR) and Rating and Investment Information (R&I); Bank of Japan Monetary Policy Meeting publications; MetroEngines Research & Consulting’s J-REIT ownership master (7 hotel REITs, 302 properties in Japan, snapshot as of 31 Aug 2026); and each REIT’s published monthly operating results. Unit prices, market capitalisation, and earnings forecasts are from JAPAN-REIT.COM (as of 2 Sep 2026). ADR, OCC, and RevPAR are quoted directly from each REIT’s monthly disclosures and contain no estimates of ours.
Model assumptions
Interest-bearing debt and fixed-rate ratios are held at each REIT’s latest disclosed figures, with no allowance for changes during the period (acquisitions, disposals, equity raises). NOI, operating revenue, and unit count are held constant, and the model is simplified so that the increase in interest expense reduces distributable income one-for-one. Floating-rate debt reprices in full immediately when rates change; fixed-rate debt reprices only when its repayment date arrives, at “the current level + Δ”. Annual maturity ratios are calculated from actual amounts for the four REITs that publish loan schedules, and allocated for the two that do not on the assumption that repayment dates are uniformly distributed from 0 years to twice the average remaining maturity. Refinancing spreads are held unchanged from current levels, so Δ represents only the change in the reference rate.
Limitations and caveats
(1) Reference dates for disclosures range from 28 Feb 2026 to 31 Jul 2026, a gap of up to five months, so this is not a strict point-in-time comparison. (2) LTV figures mix book-value and market-value bases, so levels must be compared only after aligning the basis. (3) Mori Trust REIT is a diversified REIT including offices and retail, so not all of its interest-bearing debt supports hotels. (4) The model simply adds a uniform Δ to existing rates; the lower a REIT’s legacy funding cost, the larger the actual step-up on refinancing may be. (5) Hoshino Resorts REIT does not disclose interest-bearing debt and is therefore excluded from the sensitivity model, with LTV referenced only as an industry benchmark. (6) This article is intended to describe market structure and does not present investment judgments, target prices, or distribution forecasts.
REIT IR disclosures
- Japan Hotel REIT Investment Corporation, “Financial Summary” (as of 30 Jun 2026) / “Loans and Investment Corporation Bonds” (as of 30 Jun 2026) / “Rating Information” (as of 13 May 2026)
- Invincible Investment Corporation, “Financial Highlights” / “Financial Results for the Fiscal Period Ended June 2026 (REIT)” (25 Aug 2026)
- Mori Trust REIT Investment Corporation, “Interest-Bearing Debt” (as of 28 Feb 2026)
- Ichigo Hotel REIT Investment Corporation, “Loans and Investment Corporation Bonds” (as of 25 Aug 2026) / 21st fiscal period (ended Jan 2026) results
- Nippon Hotel & Residential Investment Corporation, “Interest-Bearing Debt List” (as of 31 May 2026) / “Financial Results for the Fiscal Period Ended May 2026 (REIT)” (22 Jul 2026) / “Rating Information” (as of 19 Feb 2026)
- Kasumigaseki Hotel REIT Investment Corporation, “Loans” (as of 31 Jul 2026) / “Investment Corporation Bonds and Rating Information” (as of 25 Dec 2025) / “Financial Highlights” (as of 31 Jan 2026)
- Hoshino Resorts REIT, Inc., “Interest-Bearing Debt” (as of 30 Apr 2026) / 26th fiscal period (ended Apr 2026) results
Ratings
- Japan Credit Rating Agency, Ltd. (JCR), Structured Finance (Investment Corporation) rating list (accessed 2 Sep 2026)
- Rating and Investment Information, Inc. (R&I), issuer rating (Japan Hotel REIT Investment Corporation A+/stable, as of 13 May 2026)
Monetary policy
- Bank of Japan, “Change in the Guideline for Money Market Operations” (16 Jun 2026)
- Bank of Japan, “Statement on Monetary Policy” (28 Apr 2026)
Market data
- MetroEngines Research & Consulting — J-REIT ownership master (7 hotel REITs, 302 properties in Japan, snapshot as of 31 Aug 2026), REIT monthly operating results database
- JAPAN-REIT.COM (unit prices, market capitalisation, earnings forecasts, as of 2 Sep 2026)