

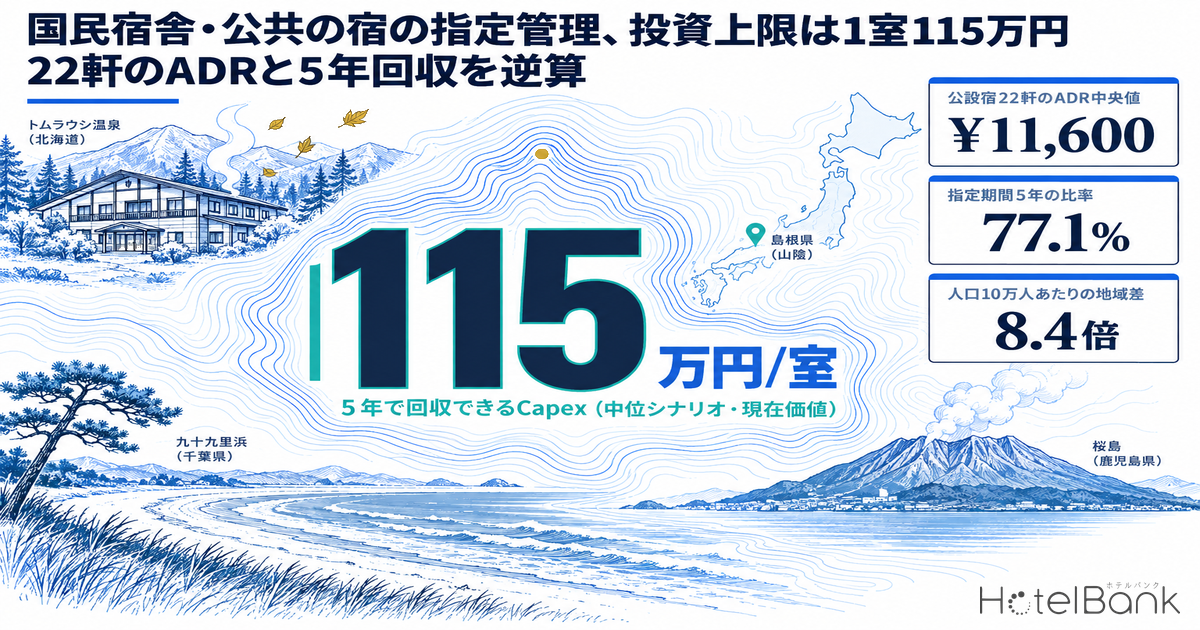
According to the Ministry of Internal Affairs and Communications (MIC) survey on the adoption of the designated manager system for public facilities, published in July 2025 with a reference date of 1 April 2024, 79,332 public facilities nationwide are now run under the designated manager system. Of those, 77.1% carry a five-year designation term. Lodging and recreation facilities — hotels, Kokumin Shukusha public lodges and the like — are entrusted to designated managers at 92.9% of prefectural facilities and 100.0% of designated-city facilities, making this one of the categories where the shift away from direct public operation has gone furthest. This article starts from that primary statistic, lays out estimated settled ADR and guest review scores for 22 publicly owned lodges across Japan using real data, and works backwards from the designation term — the ceiling on any payback period — to quantify how much capital can actually be put into a single guest room.
Metric definitions used in this article
- ADR (average daily rate) = an estimated settled rate (tax-exclusive equivalent) derived by applying a category-specific adjustment factor to the lowest published plan level each property lists on OTAs and similar channels (two guests per room, per-room rate, tax-included). Cross-checked against per-property results disclosed by listed hotel REITs (91 properties, most recent three months), the median error is about 7%. These are estimates and differ from each property’s actual transacted prices and accounting figures. Area-level ADR is the median of the properties covered (the level of a typical property in that area).
- OCC (occupancy rate) = sold rooms as a share of total rooms in the area (an estimate based on OTA sales inventory). The room occupancy rate used in this article’s modelling is the published figure from the Japan Tourism Agency’s Overnight Travel Statistics Survey.
- Where published prices are mentioned, they are per-room rates for two guests sharing (tax-included).
- Data sources: MetroEngines Research & Consulting / Ministry of Internal Affairs and Communications / Japan Tourism Agency
- — 79,332 facilities operate under the designated manager system, and 77.1% of them on a five-year term. For lodging and recreation facilities the adoption rate is 92.9% at prefectural level and 100.0% at designated-city level — the category of public facility where outsourced operation has advanced furthest.
- — Working backwards from that five-year payback constraint, the capex that can be deployed is ¥1.15M per room in the mid case, and ¥660k–¥1.67M per room across the conservative-to-bull range. A full renovation including bathrooms and plumbing (¥3.98M per room) is out of reach.
- — Across 22 properties and 798 rooms nationwide the median estimated settled ADR is ¥11,600 (N=21 properties). Prices span ¥5,900 to ¥26,200, a 4.4x spread, while review scores cluster in a narrow band: an average of 4.11, with 16 of 21 properties above 4.0.
- — 13 of the 21 properties price below the going rate for the same category in their own prefecture, with a median gap of −15%. This is a cohort with headroom left in pricing design and distribution.
- — Facilities under the system are distributed 8.4x more densely in some prefectures than others — 201.4 per 100,000 residents in Shimane versus 24.1 in Osaka. The stock that can be entered without buying land or buildings is thickest in regional areas where lodging supply is thin.
Latest survey published July 2025, reference date 1 April 2024 — lodging facilities lead the shift to outside operators
The primary source is the survey on the adoption of the designated manager system for public facilities, produced by the Administrative Management Support Office of MIC’s Local Administration Bureau. It is conducted roughly every three years, and the latest round has a reference date of 1 April 2024 and was published in July 2025. The previous round, as of 1 April 2021, counted 77,537 facilities under the system; the latest round puts the figure at 79,332, an increase of 1,795. The breakdown is 6,658 prefectural facilities, 8,016 designated-city facilities and 64,658 municipal facilities.
Broken down by facility type, “recreation and sports facilities” — the category that contains hotels, Kokumin Shukusha lodges and other lodging and recreation facilities — number 15,474, or 19.5% of the total. That is essentially flat against the previous 15,479 (19.8%), in contrast to infrastructure facilities, which rose from 27,491 to 29,507 over the same period, a gain of 2,016. The overall pie is expanding, yet the category containing lodging facilities is standing still in unit terms.
| Facility type | 1 Apr 2021 | 1 Apr 2024 | Change | Share (2024) |
|---|---|---|---|---|
| Infrastructure (parks, public housing, car parks, etc.) | 27,491 | 29,507 | +2,016 | 37.2% |
| Recreation and sports facilities (includes lodging and recreation facilities) | 15,479 | 15,474 | −5 | 19.5% |
| Education and culture (libraries, museums, cultural halls, etc.) | 15,680 | 15,434 | −246 | 19.5% |
| Social welfare facilities | 13,200 | 12,781 | −419 | 16.1% |
| Industrial promotion facilities | 6,393 | 6,136 | −257 | 7.7% |
| Total | 78,243 | 79,332 | +1,089 | 100.0% |
The adoption rate for lodging and recreation facilities specifically is set out by facility class in MIC’s survey on local government administrative reform initiatives (published 17 May 2023). Prefectural facilities stand at 92.9%, designated-city facilities at 100.0% and municipal facilities at 84.8%. Against libraries (12.9% at prefectural level) or museums (49.5%), lodging and recreation facilities are almost without exception run by outside bodies, private operators included. In practice, the option of a local government running a hotel or ryokan business directly has all but disappeared.
Who the designated managers are — joint-stock companies at 25.2% and foundation/public-corporation bodies at 24.9% lead
So who takes these contracts? Private-sector bodies (joint-stock companies, NPOs, joint ventures and the like) are the designated manager at 35,572 facilities, or 44.5% of those under the system, up 1.4 points from 43.1% in the previous survey. By type of manager (multiple responses, 79,923 entries in total), joint-stock companies lead with 20,157 facilities or 25.2%, followed by transitional Civil Code corporations, general and public-interest incorporated associations and foundations, and the three types of local public corporations, at 19,867 facilities or 24.9%.
Among lodging and recreation facilities the mix tilts further towards joint-stock companies and foundation/public-corporation bodies. Kokumin Shukusha Sunroad Kibiji (国民宿舎サンロード吉備路, Soja City, Okayama), discussed later in this article, is run by a joint venture of Kaden Kanko Bus and Shanthi Yakageya (lead member: Shanthi Co., Ltd.) under a designation running from 1 April 2024 to 31 March 2029, while Kokumin Shukusha Ojo (国民宿舎大城, Kudamatsu City, Yamaguchi) has been operated since FY2006 by the Kudamatsu City Kasadojima Development Center, a general incorporated foundation, under a user-fee arrangement. At Tomuraushi Onsen Kokumin Shukusha Higashi-Taisetsuso (トムラウシ温泉 国民宿舎 東大雪荘, Shintoku Town, Hokkaido) the designated manager is Shintoku Tourism Promotion Corporation. The same two-track structure — corporate operators alongside municipality-funded foundations and public corporations — carries straight over into lodging.
One further point worth noting is the spread of open tendering. Designated managers are selected through an open call at 53.4% of all facilities, up 2.5 points from 50.9% in the previous survey, reaching 66.1% at prefectural level and 67.7% at designated cities. Operating contracts for lodging facilities are shifting from discretionary, non-tendered designation to competitive open-call proposals.
Shimane at 201 facilities per 100,000 residents versus Osaka at 24 — an 8.4x regional gap
Dividing the prefectural distribution of facilities under the system by MIC Statistics Bureau population estimates (as of 1 October 2024) brings the skew into sharp relief. The national average is 64.1 facilities per 100,000 residents, but Shimane tops the table at 201.4 and Osaka sits at the bottom with 24.1 — a gap of 8.4x. Thirty prefectures are above the national average, and almost all of them are regional areas in population decline.
This skew points in the opposite direction to lodging demand. Within the scope MetroEngines Research tracks, 349 lodging properties in Shimane were trading on OTAs as of June 2026 against 1,238 in Osaka, with supply concentrated in the major metropolitan areas including Tokyo. Public facility stock, by contrast, is thickest in the regions. In other words, the publicly owned lodge as an asset class sits largely dormant in exactly those regional areas where private lodging supply is thin and where the land and buildings already exist.
The demand side backs this up. According to the Japan Tourism Agency’s Overnight Travel Statistics Survey (2024, annual figures, final), total guest nights in 2024 reached 659.06 million, up 10.6% on 2019, while foreign guest nights hit a record 164.46 million, up 42.2%. Room occupancy by property type, however, was 73.7% for business hotels and 72.3% for city hotels against just 36.1% for ryokan. Regional ryokan-type stock still carries slack where demand has not fully returned.
Twenty-two public lodges laid out on real data — review scores at 4.11 while ADR spreads 4.4x
From here we name actual properties and set their prices against their scores. The selection worked as follows. The starting point was the list of publicly run Kokumin Shukusha published by the Japan Kokumin Shukusha Association (43 properties), from which those flagged on that list as temporarily closed (Shinranzanso, Noto Ushitsuso, Noto Yanagidaso and Ryokanso) were excluded. To these were added publicly owned lodges whose founding authority could be confirmed on an official municipal website or in a municipal ordinance, council bill or designated manager solicitation document, and the set was then narrowed to properties whose prices could be observed continuously on OTAs over the most recent 12 months (September 2025 to August 2026). The result is 22 properties and 798 rooms across 16 prefectures.
The median estimated settled ADR is ¥11,600 (N=21 properties, median of monthly medians over the last 12 months). From the lowest, Kokumin Shukusha Kurosakiso (国民宿舎 くろさき荘, Fudai Village, Iwate) at ¥5,900, to the highest, Kokumin Shukusha Hotel Takachiho (国民宿舎 ホテル高千穂, Takachiho Town, Miyazaki) at ¥26,200, the range is 4.4x. Review scores, meanwhile, average 4.11 over the last 24 months (out of 5, N=21 properties, 7,067 reviews in total) with a median of 4.17, and 16 of the 21 properties sit at 4.0 or above. Quality ratings cluster in a narrow band while price alone scatters widely — that is the defining feature of this cohort.
How do they compare with private lodgings in the same prefecture and the same category? Setting each property’s estimated settled ADR against the median estimated settled ADR for the same category (ryokan / resort / city hotel) in its own prefecture, 13 of the 21 properties price below their local market, with a median gap of −15%. Kokumin Shukusha Shinguso (国民宿舎 志んぐ荘, Tatsuno City, Hyogo) is 69% below, Kokumin Shukusha Oku-Hamanako (国民宿舎 奥浜名湖, Hamamatsu City, Shizuoka) 59% below and Kokumin Shukusha Seiranso (国民宿舎 清嵐荘, Unnan City, Shimane) 54% below. One caveat: the ryokan medians for Hyogo and Shizuoka are pulled up by high-rate hot-spring destinations such as Arima, Kinosaki, Izu and Atami, so the gap cannot be read straight across as room to raise prices.
| Property | Prefecture | Founding authority | Rooms | Estimated settled ADR | In-prefecture same-category median | Gap | Score | Reviews |
|---|---|---|---|---|---|---|---|---|
| Tomuraushi Onsen Kokumin Shukusha Higashi-Taisetsuso (トムラウシ温泉 国民宿舎 東大雪荘) | Hokkaido | Shintoku Town | 29 | ¥11,551 | ¥9,598 | +20% | 4.50 | 340 |
| Kokumin Shukusha Kurosakiso (国民宿舎 くろさき荘) | Iwate | Fudai Village | 36 | ¥5,892 | ¥8,664 | -32% | 4.11 | 110 |
| Kokumin Shukusha Eboshiso (国民宿舎 えぼし荘) | Iwate | Karumai Town | 27 | ¥6,301 | ¥8,664 | -27% | 3.90 | 190 |
| Kokumin Shukusha U-no-Misaki (国民宿舎 鵜の岬) | Ibaraki | Ibaraki Prefecture (prefectural) | 58 | — | ¥8,258 | — | — | — |
| Ryokami Onsen Kokumin Shukusha Ryokamiso (両神温泉 国民宿舎 両神荘) | Saitama | Ogano Town | 40 | ¥12,714 | ¥13,662 | -7% | 4.19 | 568 |
| Kokumin Shukusha Sunrise Kujukuri (国民宿舎 サンライズ九十九里) | Chiba | Sanmu City | 94 | ¥18,284 | ¥17,204 | +6% | 4.03 | 388 |
| Kokumin Shukusha Matsushiroso (国民宿舎 松代荘) | Nagano | Nagano City | 35 | ¥14,111 | ¥13,141 | +7% | 4.21 | 559 |
| Kokumin Shukusha Mochizukiso (国民宿舎 もちづき荘) | Nagano | Saku City | 29 | ¥8,498 | ¥13,141 | -35% | 4.17 | 131 |
| Kokumin Shukusha Oku-Hamanako (国民宿舎 奥浜名湖) | Shizuoka | Hamamatsu City | 28 | ¥7,707 | ¥18,710 | -59% | 3.93 | 149 |
| Kokumin Shukusha Shinguso (国民宿舎 志んぐ荘) | Hyogo | Tatsuno City | 63 | ¥6,268 | ¥20,172 | -69% | 4.08 | 139 |
| Kokumin Shukusha Suimeiso (国民宿舎 水明荘) | Tottori | Yurihama Town | 40 | ¥9,918 | ¥12,750 | -22% | 4.21 | 189 |
| Kokumin Shukusha Sanshien (国民宿舎 山紫苑) | Tottori | Tottori City | 35 | ¥9,306 | ¥12,750 | -27% | 4.17 | 492 |
| Kokumin Shukusha Sanbeso (国民宿舎 さんべ荘) | Shimane | Oda City | 34 | ¥16,172 | ¥16,068 | +1% | 4.22 | 417 |
| Kokumin Shukusha Senjoen (国民宿舎 千畳苑) | Shimane | Hamada City | 31 | ¥15,904 | ¥16,068 | -1% | 3.89 | 576 |
| Kokumin Shukusha Seiranso (国民宿舎 清嵐荘) | Shimane | Unnan City | 19 | ¥7,370 | ¥16,068 | -54% | 4.34 | 233 |
| Kokumin Shukusha Sunroad Kibiji (国民宿舎 サンロード吉備路) | Okayama | Soja City | 39 | ¥14,292 | ¥12,377 | +15% | 3.89 | 358 |
| Kokumin Shukusha Ojo (国民宿舎 大城) | Yamaguchi | Kudamatsu City | 37 | ¥12,676 | ¥14,845 | -15% | 4.40 | 200 |
| Kokumin Shukusha Marine Terrace Ashiya (国民宿舎 マリンテラスあしや) | Fukuoka | Ashiya Town | 19 | ¥13,541 | ¥13,014 | +4% | 4.21 | 568 |
| Kokumin Shukusha Chikugo Funagoya Koen-no-Yado (国民宿舎 筑後船小屋 公園の宿) | Fukuoka | Chikugo City | 16 | ¥10,956 | ¥13,014 | -16% | 4.06 | 97 |
| Kokumin Shukusha Ikishimaso (国民宿舎 壱岐島荘) | Nagasaki | Iki City | 23 | ¥7,608 | ¥10,357 | -27% | 4.17 | 165 |
| Kokumin Shukusha Hotel Takachiho (国民宿舎 ホテル高千穂) | Miyazaki | Takachiho Town | 39 | ¥26,170 | ¥7,329 | +257% | 3.42 | 705 |
| Kokumin Shukusha Rainbow Sakurajima (国民宿舎 レインボー桜島) | Kagoshima | Kagoshima City | 27 | ¥13,362 | ¥10,376 | +29% | 4.16 | 493 |
One property has held an occupancy rate of 79.7% for 36 years — the ceiling for this asset class
One property shows what this asset class can reach. Kokumin Shukusha U-no-Misaki (国民宿舎 鵜の岬, Hitachi City, Ibaraki, 58 rooms), run by Ibaraki Prefecture, posted a FY2024 lodging utilisation rate of 79.7%, first among all publicly run Kokumin Shukusha in Japan and its 36th consecutive year at the top since FY1989 (Ibaraki Shimbun). That is roughly 2.2 times the 36.1% ryokan average in the Japan Tourism Agency statistics. The property does not sell through OTAs and so falls outside this article’s ADR set, but over a 36-year horizon it demonstrates that, with the right location and operation, a publicly owned lodge can run well above the private ryokan average.
Scores hold up too. Tomuraushi Onsen Kokumin Shukusha Higashi-Taisetsuso (Shintoku Town, Hokkaido, 29 rooms) scores 4.50 over the last 24 months (N=340), Kokumin Shukusha Ojo (Kudamatsu City, Yamaguchi, 37 rooms) 4.40 (N=200) and Kokumin Shukusha Seiranso (Unnan City, Shimane, 19 rooms) 4.34 (N=233) — all strongly supported by guests. These are properties whose ability to fill rooms and satisfy guests is already demonstrated, and layering pricing design and distribution design on top of that is where the opportunity for further revenue growth sits.
Working backwards from the five-year designation term — the capex ceiling is ¥1.15M per room
Back, then, to the constraint on the institutional side. In the latest survey, five-year terms account for 77.1% of designations, overwhelmingly the norm and up 4.4 points from 72.7% in the previous round. Three-year terms account for 10.9% and terms of ten years or more for just 5.7%. Terms are lengthening, but in practice “five years and then a reset” is the standard form.
For an operator holding the contract, the designation term is simply the ceiling on the payback period. Re-designation at expiry is not guaranteed by the system, and with 53.4% of facilities selecting managers through an open call, capital spending cannot be structured on cash flows from year six onwards. So how much can be put into a single room within a five-year frame? We build a model property and work backwards.
- Model property: a 30-room publicly owned lodge (Kokumin Shukusha type) built around two meals included. That is slightly below the median room count of the 22 properties in this article (34.5 rooms), a deliberately conservative scale.
- Room occupancy rate: 36.1% (the ryokan room occupancy rate in the Japan Tourism Agency’s Overnight Travel Statistics Survey, 2024 annual figures, final)
- Per-room lodging rate: ¥18,000 (tax-exclusive, food and beverage revenue included; the roughly ¥20,000 median published price across the 22 properties in this article — two guests per room, tax-included — converted to a tax-exclusive basis)
- Annual rooms revenue: 30 rooms × 365 days × 36.1% × ¥18,000 = ¥71.2M
- Non-staying revenue (day-use bathing, restaurant, banquets): 15% of rooms revenue = ¥10.7M → total revenue ¥81.9M
- GOP margin on a designated-manager basis: 12% (assuming building depreciation, fixed asset tax and major repairs are borne by the founding authority, and no rent is payable) → ¥9.82M
- Improvement scenario (mid case): rate +12%, room occupancy +4pt. GOP flow-through on incremental revenue of 40%
- Discount rate: 5% (discounted to present value on a year-end cash flow basis, not mid-year)
In the mid case, total revenue rises by ¥20M from ¥81.9M to ¥101.8M and incremental GOP comes to ¥7.99M a year. Discounted to present value over the designation term, that is ¥34.6M over five years, ¥61.7M over ten and ¥82.9M over fifteen. Divided across 30 rooms, the capex ceiling works out at ¥1.15M per room over five years, ¥2.06M over ten and ¥2.76M over fifteen.
In the conservative case (rate +8%, occupancy +2pt) five years yields ¥660k per room, and even the bull case (+16%, +6pt) reaches only ¥1.67M per room. What can be moved within a five-year designation term is roughly a ¥700k–¥1.7M per-room range. Set against the per-room capital expenditure listed hotel REITs disclose — on the order of ¥130k to ¥620k a year — investment structured inside a five-year frame is comparable to the renewal capex an owned hotel accumulates over several years.
| Scenario | Assumptions (vs current) | Incremental GOP (annual) | 5 years | 10 years | 15 years |
|---|---|---|---|---|---|
| Conservative | Rate +8%, room occupancy +2pt | ¥4.58M | ¥660k | ¥1.18M | ¥1.58M |
| Mid | Rate +12%, room occupancy +4pt | ¥7.99M | ¥1.15M | ¥2.06M | ¥2.76M |
| Bull | Rate +16%, room occupancy +6pt | ¥11.55M | ¥1.67M | ¥2.97M | ¥4.0M |
Source: MetroEngines Research & Consulting estimate. Assumptions are as set out under “■ Modelling assumptions” above (30 rooms, base occupancy 36.1%, base rate ¥18,000, non-staying revenue at 15% of rooms revenue, GOP flow-through on incremental revenue of 40%, 5% discount rate, year-end basis). Incremental GOP is discounted to present value over the designation term and divided by 30 rooms. This is a simplified estimate; an actual investment decision requires a detailed feasibility study.
What does that figure mean in practice? Once lost revenue during the works is factored in, the effective capex of a guest-room renovation swells from a ¥3.0M per-room construction cost to ¥3.98M per room — lost revenue during a hotel renovation runs to 32.6% of the construction cost. A full guest-room renovation including bathrooms and plumbing is therefore some three to four times the five-year mid case (¥1.15M per room) and simply out of range within a designated management contract. Put the other way round, what does work inside a five-year frame — refreshing bedding, furniture, lighting, curtains and in-room amenities; sorting out signage and Wi-Fi; bringing in a PMS or revenue management tool and wiring up distribution channels — is everything that leaves the building fabric untouched.
That is not a weakness of the publicly owned lodge, though. As the previous section showed, this cohort already holds a 4.11 review score with 16 properties above 4.0. It is precisely because they score well without rebuilding the guest-room shell that they work as an asset class you can enter at low capex. Add in that building depreciation, fixed asset tax and major repairs are borne by the founding authority, that no rent is payable, and that no upfront investment at all is needed to acquire land or buildings, and the capital committed on entry is an order of magnitude away from a conventional hotel acquisition or development.
Three routes in: operating contract, rebrand, or transfer of ownership
A. Operating contract (designated management)5 years
Upfront investment is essentially working capital only. Capex ceiling ¥1.15M per room (mid case). The model is to refresh the soft side and the sales design and take returns early. 77.1% of all designations use this term.
B. Rebrand (long-term designation)10 years
The capex ceiling widens to ¥2.06M per room, bringing reconfiguration of public areas, partial renovation and brand-standard FF&E into range. Designations of ten years or more, however, are only 5.7% of the total.
C. Transfer (acquisition of ownership)no term limit
The payback constraint falls away: ¥2.76M per room on a 15-year view. Full renovation including bathrooms and plumbing, and change of use, become possible — but on top of the purchase price, tax, repairs and depreciation move onto your own books.
| Comparison item | A. Operating contract (designated management) | B. Rebrand (long-term designation) | C. Transfer (acquisition of ownership) |
|---|---|---|---|
| Payback period assumed | 5 years (77.1% of all designations) | 10 years (terms of 10 years or more are 5.7% of the total) | 15 years (no term limit) |
| Upfront investment in land and buildings | None | None | Purchase price required |
| Depreciation, fixed asset tax, major repairs | Borne by the founding authority | Borne by the founding authority | Borne by the acquirer |
| Capex ceiling (mid case, present value) | ¥34.6M = ¥1.15M per room | ¥61.7M = ¥2.06M per room | ¥82.9M = ¥2.76M per room (plus the purchase price) |
| Capex ceiling (conservative-to-bull range) | ¥660k–¥1.67M per room | ¥1.18M–¥2.97M per room | ¥1.58M–¥4.0M per room |
| Investment within range | Bedding, furniture, lighting, curtains; in-room amenities; signage; Wi-Fi; PMS / revenue management rollout; distribution channel connections | The above plus reconfiguration of public areas, partial renovation and a full brand-standard FF&E refit | The above plus full guest-room renovation including bathrooms and plumbing, change of use, and extensions |
| Points to watch | Re-designation at expiry is not guaranteed. The treatment of the residual book value of invested assets needs to be spelled out in the agreement | Long-term designations are few in number and require a council resolution | After acquisition the GOP margin falls below the designated-manager basis. Transfer terms may carry an obligation to continue operating |
The practical way in is the tender notice. Tatsuno City ran an open-call proposal in 2025 for Kokumin Shukusha Shinguso (Tatsuno City, Hyogo, 63 rooms), with operations starting 1 August 2025. In Soja City, Kokumin Shukusha Sunroad Kibiji (Soja City, Okayama, 39 rooms) was awarded to a joint venture for the five years from 1 April 2024 to 31 March 2029. Both were open calls, and this is a field where operating capability itself is the selection criterion. The criterion cited most often is “improving the services of the facility” (88.1%), ahead of “reducing facility management costs” (84.8%). The design is such that a low cost bid alone will not win it.
Conclusion — an asset class you can enter at low capex and short payback, concentrated in regional Japan
What MIC’s latest survey shows is that lodging and recreation facilities are the category of public facility where the shift to outside operation has gone furthest (92.9% prefectural, 100.0% designated-city, 84.8% municipal), and that 77.1% of designations run for five years. Working backwards from that five-year payback constraint, deployable capex comes to ¥1.15M per room in the mid case and ¥660k–¥1.67M per room across the range. Investment that rebuilds the hardware is out of reach — but this cohort already holds a 4.11 review score, with 16 of 21 properties above 4.0.
And the distribution is weighted towards regional Japan. Facilities under the system run to 201.4 per 100,000 residents in Shimane against 24.1 in Osaka, an 8.4x gap, and public facility stock has accumulated precisely where private lodging supply is thin. While ryokan room occupancy nationally sits at just 36.1%, the 79.7% lodging utilisation rate at Ibaraki Prefecture’s Kokumin Shukusha U-no-Misaki (FY2024, Ibaraki Shimbun) — first in Japan for 36 consecutive years — shows where the ceiling for this asset class lies.
The fact that estimated settled ADR spreads 4.4x, and that 13 of 21 properties price below their local market, means headroom remains in pricing design and distribution design. No land or buildings to buy, no major repairs or fixed asset tax to carry, and an investment in the order of ¥1M per room to take over operations. The publicly owned lodge is one of the few asset classes that can be entered on a low-capex, short-payback risk profile — and it is distributed thickly across regional Japan.
References and sources
■ Data sources
Figures on the institutional side come from the MIC survey on the adoption of the designated manager system for public facilities (reference date 1 April 2024, published July 2025) and the MIC survey on local government administrative reform initiatives (published 17 May 2023). Population figures are from MIC Statistics Bureau population estimates (as of 1 October 2024). Demand-side room occupancy and total guest nights are from the Japan Tourism Agency’s Overnight Travel Statistics Survey (2024, annual figures, final). Property-side estimated settled ADR, in-prefecture same-category medians and counts of properties trading on OTAs come from MetroEngines Research & Consulting (median of monthly medians, September 2025 to August 2026; 21 of the 22 properties covered had obtainable ADR). Review scores were compiled by the HotelBank Editorial Team (last 24 months, 7,067 reviews in total). Property identification started from the Japan Kokumin Shukusha Association’s list of publicly run Kokumin Shukusha (43 properties, 4 temporarily closed properties excluded) and was limited to those whose founding authority could be confirmed on an official municipal website or in a municipal ordinance, council bill or designated manager solicitation document.
■ Modelling assumptions
The capex ceiling is derived from a model property: a 30-room publicly owned lodge built around two meals included, with a base room occupancy rate of 36.1% (the ryokan figure in the Japan Tourism Agency statistics), a per-room lodging rate of ¥18,000 (tax-exclusive, food and beverage revenue included), non-staying revenue at 15% of rooms revenue and a GOP margin of 12% on a designated-manager basis (building depreciation, fixed asset tax and major repairs borne by the founding authority, no rent payable). Three improvement scenarios were run — rate +8% / +12% / +16% and room occupancy +2pt / +4pt / +6pt — with GOP flow-through on incremental revenue at 40% and a discount rate of 5% (year-end basis), discounted to present value and divided by 30 rooms to give the per-room ceiling (Table 3).
■ Limitations and caveats
ADR is an estimate and differs from each property’s actual transacted prices and accounting figures. Kokumin Shukusha U-no-Misaki is excluded from the ADR set because its prices cannot be observed continuously on OTAs, so the cohort is N=21 properties. The in-prefecture same-category median is aggregated at prefecture level, so in prefectures containing high-rate hot-spring destinations the median is pulled up and the gap cannot be read straight across as room to raise prices. The capex ceiling is a simplified estimate based on a single model property and does not reflect each property’s condition, location, building specification or contract terms. Re-designation at the end of a designation term is not guaranteed by the system, and the treatment of the residual book value of invested assets depends on the individual agreement. An actual investment decision requires a detailed feasibility study.
■ Primary statistics (Ministry of Internal Affairs and Communications)
- MIC, “Survey results on the adoption of the designated manager system for public facilities” (reference date: 1 April 2024 / published: July 2025)
- MIC, administrative reform of local public entities (index of survey results and individual entity data)
- MIC Local Administration Bureau, Administrative Management Support Office, “On the designated manager system” (26 April 2024; adoption rates by facility class are from “Survey results on local government administrative reform initiatives,” published 17 May 2023)
- MIC, “Surveys on local government administrative reform initiatives” (published 17 May 2023)
- e-Stat System of Social and Demographic Statistics, A1101 total population (as of 1 October 2024, MIC Statistics Bureau population estimates)
■ Tourism statistics
- Japan Tourism Agency, “Overnight Travel Statistics Survey (2024, annual figures, final)”
- Japan Tourism Agency, “Overnight Travel Statistics Survey”
■ Confirmation of properties and founding authorities
- Japan Kokumin Shukusha Association, “National list of publicly run Kokumin Shukusha” (including the marking of temporarily closed properties)
- Soja City, “Bill No. 2: On the designation of the designated manager for the Soja City Kokumin Shukusha” (Sunroad Kibiji, designation period 1 April 2024 to 31 March 2029; the PDF is currently unavailable following a redesign of the city website)
- Soja City ordinance compendium, “Soja City Kokumin Shukusha Ordinance” (Ordinance No. 189 of 22 March 2005; Article 1 establishment / Article 3 management by a designated manager)
- Tatsuno City, “Solicitation for the designated manager of the Tatsuno City Kokumin Shukusha Shinguso” (open-call proposal, operations starting 1 August 2025)
- Kudamatsu City, “Kokumin Shukusha Ojo”
- Hitachi City, “Kokumin Shukusha U-no-Misaki”
- Ibaraki Shimbun, “U-no-Misaki first in Japan: FY2024 Kokumin Shukusha utilisation rate, 36th consecutive year at the top, Hitachi, Ibaraki” (reported 2025; no link, as the article is no longer posted. The continuing national top ranking for lodging utilisation can be confirmed on the Hitachi City official page listed above)
- Oda City, Shimane tourism site, “Kokumin Shukusha Sanbeso”
- Hamada City Tourism Association, “Kokumin Shukusha Senjoen”
■ Market data
- MetroEngines Research & Consulting — estimated settled ADR (September 2025 to August 2026, 22 properties and same-category medians by prefecture), counts of lodging properties trading on OTAs
- HotelBank Editorial Team — guest review scores (last 24 months, 7,067 reviews in total)