

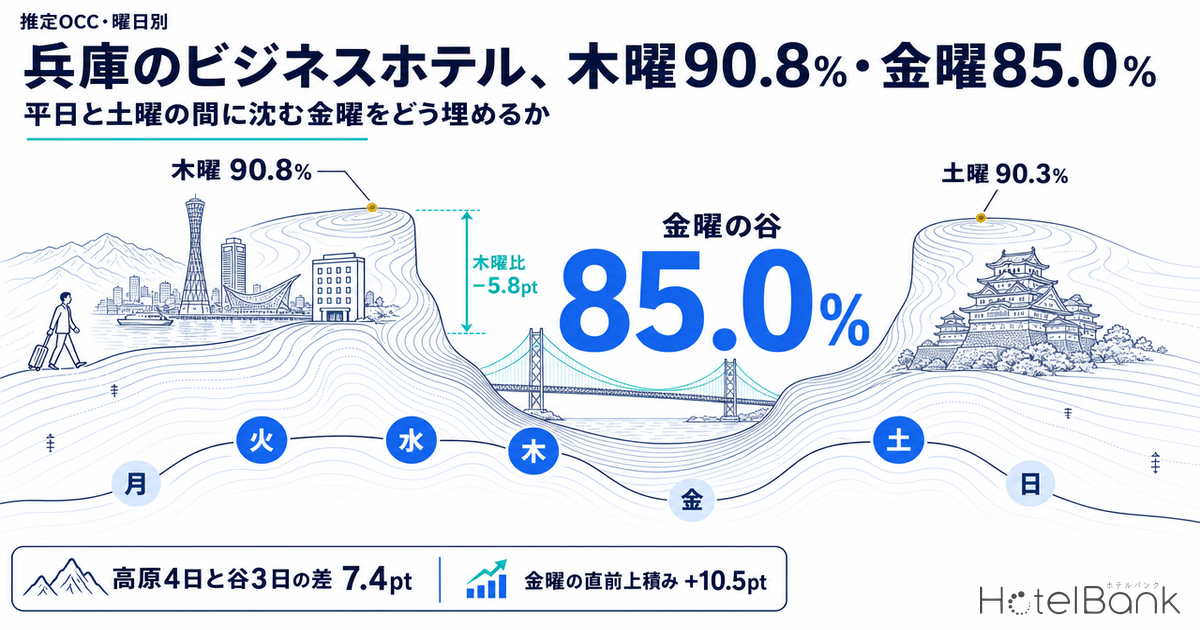
We aggregated the estimated OCC (based on OTA-listed inventory) of business hotels in Hyogo by day of week, using daily data for June–August 2026. The highest day, Thursday, came in at 90.8% and the lowest, Sunday, at 80.0%, a spread of 10.8pt. What stands out is that Tuesday, Wednesday, Thursday and Saturday form a “plateau” of 88.9–90.8%, while Friday, sandwiched between them, stays at 85.0%, forming a dip of −5.8pt versus Thursday and −5.3pt versus Saturday. Friday is usually treated as “the gateway to the weekend,” but for Hyogo’s business hotels it is the second-weakest day of the week: business-travel demand falls away while leisure demand has not yet fully ramped up. This article uses the day-of-week profile, the gaps between hotel types, and the shape of the booking curve to pin down what this Friday dip is and how to fill it.
Scope: business hotels in Hyogo, N=70–78 properties (8,165–9,130 rooms, based on listings on major booking sites). This article does not cover price metrics; occupancy is shown only as an estimate based on OTA-listed inventory. Definitions are at the end of the article. Data as of September 17, 2026.
• OCC (occupancy) = the share of rooms sold relative to total rooms in the area (an estimate based on OTA sales inventory). This article refers to it as “estimated OCC.”
• The sample is a fixed cohort of properties that list at least 30% of their total rooms on OTAs (the same set of properties for every stay date). Because unlisted rooms are counted as sold, the figures run higher than actual room occupancy.
• Public holidays (July 20 and August 11, 2026) and the Obon period (August 12–16) are excluded from the day-of-week aggregation.
• This article covers only the day-of-week structure of occupancy; it does not cover ADR or price metrics.
• Source: MetroEngines Research (continuously tracks OTA published prices for approximately 168,000 properties in Japan, of which approximately 27,000 are confirmed to be in operation)
- — Thursday 90.8%, Friday 85.0% — Tuesday, Wednesday, Thursday and Saturday form a plateau averaging 90.0%, and only Friday, sandwiched between them, drops into a −5.8pt dip (June–August 2026, 85 days excluding public holidays and Obon, N=70–76 properties).
- — The Friday dip is specific to business hotels — At resort hotels Friday runs +6.8pt above Thursday, and for city hotels and all properties the gap is only −1.9pt. On Friday, when the mix of demand shifts, business hotels alone fail to capture it.
- — Friday leads at T-45, but the final result flips — At 45 days out, Friday is ahead at 59.1% vs. Thursday’s 55.9%, but pickup over the final two weeks is +16.2pt for Thursday vs. +10.5pt for Friday, so Friday ends up 7.8pt behind.
- — Last-minute discounting works poorly on Fridays — The volume of late demand is itself smaller than on Thursdays, so the core levers are securing bookings early, at 45–30 days out, and designing Thu–Fri and Fri–Sat multi-night stays.
- — Friday also leads in the forward snapshot for October — October 16 at 73.7% and October 23 at 80.0% top their three-day sets, but this should be read as the day with the least room to grow being out in front (data as of September 17, 2026).
The seven-day week splits into a “four-day plateau” and a “three-day trough”
The chart below shows daily estimated OCC from June 1 to August 31, 2026, averaged by day of week. Public holidays (Marine Day on July 20 and Mountain Day on August 11) and the Obon period (August 12–16) distort the underlying day-of-week pattern, so they were excluded and the remaining 85 days were aggregated. The all-day average for the period was 86.8% (N=70–76 properties).
Source: MetroEngines Research; compiled by HotelBank Editorial Team
The shape is clear. Tuesday at 88.9%, Wednesday at 90.0%, Thursday at 90.8% and Saturday at 90.3% average 90.0% and sit almost at the ceiling. By contrast, Monday at 82.7%, Friday at 85.0% and Sunday at 80.0% average 82.6%. The gap between the four-day plateau and the three-day trough is 7.4pt, a clear two-tier structure within the week. Three trough days a week come to roughly 156 days a year, more than 40% of the calendar. How these days are handled determines the annual occupancy of Hyogo’s business hotels.
Breaking the data down by month barely changes the order. From June through the first half of September, Friday consistently stayed in an 84.0–87.2% range and kept falling short of Thursday in the same week. This is not a seasonal effect; it is a structure built into the day of the week itself.
| Day | Jun–Aug avg. | Jun | Jul | Aug | Sep 1–17 | Share of properties with no listed inventory |
|---|---|---|---|---|---|---|
| Mon | 82.7% | 79.5% | 82.0% | 86.4% | 85.3% | 16.9% |
| Tue | 88.9% | 85.9% | 89.5% | 93.0% | 89.8% | 24.5% |
| Wed | 90.0% | 86.3% | 90.8% | 93.8% | 91.4% | 30.2% |
| Thu | 90.8% | 88.9% | 90.6% | 93.7% | 92.5% | 31.0% |
| Fri | 85.0% | 84.5% | 84.2% | 87.2% | 85.0% | 15.3% |
| Sat | 90.3% | 89.8% | 90.3% | 90.9% | 89.0% | 33.7% |
| Sun | 80.0% | 75.9% | 82.1% | 82.1% | 78.2% | 13.9% |
Hyogo business hotels, N=70–78 properties. Public holidays and Obon excluded. September covers the 1st–17th only, with 2–3 days per weekday.
Source: MetroEngines Research; compiled by HotelBank Editorial Team
The right-hand column is worth a look too. The (estimated) share of properties with no listed inventory is high on Saturday at 33.7% and Thursday at 31.0%, while Friday is less than half that at 15.3%, and Sunday is the lowest at 13.9%. Saturday is polarized: many properties sell out, while those that don’t are left with large amounts of unsold inventory. Friday is the opposite: few properties sell out, and thin inventory remains across the board. The Friday dip is not a problem confined to a few properties; it occurs across the whole market.
The Friday dip is specific to business hotels — visible when hotel types are compared
Placing the day-of-week profiles of different hotel types in Hyogo side by side makes it clear that the Friday dip is a phenomenon specific to business hotels.
Source: MetroEngines Research; compiled by HotelBank Editorial Team
For resort hotels (N=31–42 properties, 1,402–1,808 rooms), estimated OCC by day of week was Monday 76.8%, Tuesday 76.6%, Wednesday 74.9%, Thursday 75.2%, Friday 82.0%, Saturday 90.8% and Sunday 82.5%. Friday runs +6.8pt above Thursday and climbs in a straight line to Saturday, the textbook shape of leisure demand that starts to build on Friday. For city hotels (N=20–25 properties, 3,224–3,759 rooms), the gap between Friday at 85.1% and Thursday at 87.0% is only −1.9pt; because they take both business and leisure travelers, their dip is shallow. Across all properties in the prefecture (N=338–427 properties, 17,434–19,413 rooms), the Friday–Thursday gap is also −1.9pt.
In other words, across Hyogo’s market as a whole the mix of demand shifts on Friday, but business hotels alone fail to capture that shift. They are not filling the space left by departing business travelers after Thursday (−5.8pt) with the leisure demand that is building. Put the other way, the roughly 5pt on Friday is not demand missing from the market but demand flowing to other hotel types, and it can move depending on how capture is designed. Which day of the week forms the dip also varies by hotel type and region; in some prefectures the dip itself flips between business hotels and ryokan.
| Hotel type (Hyogo) | Thu | Fri | Sat | Fri − Thu | Fri − Sat | N (properties) |
|---|---|---|---|---|---|---|
| Business hotels | 90.8% | 85.0% | 90.3% | −5.8pt | −5.3pt | 70–76 |
| City hotels | 87.0% | 85.1% | 91.0% | −1.9pt | −5.9pt | 20–25 |
| Resort hotels | 75.2% | 82.0% | 90.8% | +6.8pt | −8.8pt | 31–42 |
| All properties | 86.0% | 84.1% | 90.7% | −1.9pt | −6.6pt | 338–427 |
Daily averages for June–August 2026, excluding public holidays and Obon.
Source: MetroEngines Research; compiled by HotelBank Editorial Team
Friday on the booking curve — “sells early, then stalls”
To see at which stage the day-of-week dip forms, we took the Thursdays, Fridays and Saturdays of the two most recent weeks whose stay dates have passed (September 3–5 and September 10–12) and averaged the booking curves by day of week, from 45 days before the stay date to the most recent observation.
Hyogo business hotels, N=75–76 properties / 9,059–9,090 rooms (based on listings on major booking sites).
Source: MetroEngines Research; compiled by HotelBank Editorial Team
What is interesting is that at 45 days out, Friday (59.1%) is 3.2pt ahead of Thursday (55.9%). Early on, Friday looks like the day that is “selling.” Yet the final result is 92.8% for Thursday against 85.0% for Friday, a 7.8pt reversal. Splitting the curve into three intervals shows where the gap opens up.
| Day | T-45 | T-30 | T-14 | Final | T-45→T-30 | T-30→T-14 | T-14→Final |
|---|---|---|---|---|---|---|---|
| Thu | 55.9% | 63.8% | 76.6% | 92.8% | +7.9pt | +12.8pt | +16.2pt |
| Fri | 59.1% | 66.5% | 74.5% | 85.0% | +7.4pt | +8.0pt | +10.5pt |
| Sat | 67.2% | 73.9% | 79.5% | 89.0% | +6.7pt | +5.6pt | +9.5pt |
Average by day of week of two weeks, September 3–5 and September 10–12, 2026. Based on observations from 45 days before the stay date to the most recent observation.
Source: MetroEngines Research; compiled by HotelBank Editorial Team
Pickup from 45 to 30 days out is nearly level across the three days, at +6.7 to +7.9pt. The gap opens after that: pickup over the final two weeks is +16.2pt for Thursday, +10.5pt for Friday and +9.5pt for Saturday. Friday’s last-minute pickup is only two-thirds of Thursday’s. What sustains Thursday’s high occupancy is business-travel demand that comes in late, and it does not come on Friday. Saturday, meanwhile, secures a high position early (67.2% at 45 days out), so it lands high even though its late gains are small.
This shape points to two directions for Friday. One is to move Friday toward the Saturday pattern: go after early-booking leisure travelers at the early stage, 45 to 30 days out. The other is to extend Thursday-type demand into Friday: design stays for Thursday business guests as Thursday–Friday two-night stays, so that part of the late Thursday demand is carried onto Friday inventory. Neither is about last-minute discounting; both are about preparing in step with the stages when demand actually moves. How widely pickup differs by hotel type within Hyogo is analyzed in detail in our article Hyogo Booking Curves: 3.6x Pickup Gap by Category.
The forward snapshot for October — what it means that Friday is currently ahead
We applied the same lens to upcoming stay dates. The table below lines up estimated OCC at 45 days out and at the most recent observation for the Thursdays, Fridays and Saturdays of mid- and late October 2026 (all observations are within 45 days of the stay date).
| Stay date | At T-45 | Most recent observation | Pickup since T-45 |
|---|---|---|---|
| Oct 15 (Thu) | 64.9% | 72.7% (T-29) | +7.8pt |
| Oct 16 (Fri) | 67.1% | 73.7% (T-30) | +6.6pt |
| Oct 17 (Sat) | 65.6% | 73.5% (T-31) | +7.9pt |
| Oct 22 (Thu) | 71.1% | 76.0% (T-36) | +4.9pt |
| Oct 23 (Fri) | 75.0% | 80.0% (T-37) | +5.0pt |
| Oct 24 (Sat) | 73.7% | 78.2% (T-38) | +4.5pt |
Hyogo business hotels, N=78 properties / 9,130 rooms. Observations as of September 17, 2026. Booking status changes daily.
Source: MetroEngines Research; compiled by HotelBank Editorial Team
In both sets, Friday currently holds the highest position of the three days (October 16: 67.1% → 73.7%; October 23: 75.0% → 80.0%). As the September results showed, this “early Friday lead” happens every week and does not carry through to the final ranking. The most recent measured pattern was that Thursday piles on +16.2pt in the final two weeks and overtakes, while Friday stops at +10.5pt. The current Friday lead is therefore not a reason for comfort; this snapshot should rather be read as “the day with the least room to grow is the one furthest along right now.” Note also that the late-October dates start from a higher position than the mid-October ones, and compare your own property’s pace for the same dates against this market shape (reading just three points — T-45, T-30 and the final days — is enough to classify the character of a stay date).
For revenue managers running business hotels in Hyogo — implications and action plan
1. Split “the weekend” into Friday and Saturday and manage them separately. In the market’s day-of-week profile there is a 5.3pt gap between Friday at 85.0% and Saturday at 90.3%, and at resort hotels Friday actually runs +6.8pt above Thursday. Running Friday and Saturday the same way on a single weekend calendar mistakes two days with different characters for one. Line up your property’s day-of-week results against the market’s seven points (Mon 82.7, Tue 88.9, Wed 90.0, Thu 90.8, Fri 85.0, Sat 90.3, Sun 80.0) and first identify the days where you deviate most from the market.
2. Treat Friday’s weakness as a problem of “late-stage room to grow.” Pickup from 45 to 30 days out is nearly the same for Thursday, Friday and Saturday (+6.7 to +7.9pt), but the final two weeks open a gap: Thursday +16.2pt, Friday +10.5pt. Even if you try to move Friday inventory with last-minute price cuts, the volume of demand arriving late is smaller than on Thursday to begin with. Reading the recent measurements, Friday is a day on which securing bookings early is what works.
3. Thu–Fri and Fri–Sat multi-night stays are a lever that does not require creating “Friday-only demand.” In the market, Thursday builds up to 90.8%, and the share of properties with no listed inventory is also high at 31.0%. Designing stays so that Thursday guests stay on another night is more realistic than generating new Friday demand from scratch. The same goes for Friday–Saturday stays from the Saturday side: there is room to pull part of Saturday’s 90.3% demand forward onto Friday.
4. Look at the Sunday 80.0% and Monday 82.7% dips within the same framework. Friday is not the only trough of the week. Sunday is the week’s low at −10.3pt versus Saturday, and Monday is also low at 82.7%. The share of properties with no listed inventory is low on these days too — 13.9% on Sunday and 16.9% on Monday — indicating that thin inventory remains across the whole market on both. Alongside Friday measures, it helps to treat Sunday and Monday as a single continuous trough.
| Timeframe | Action | Decision trigger | Aim |
|---|---|---|---|
| Today – this week | Aggregate your property’s results for the last three months by day of week and overlay them on the market’s seven-day profile | If your Friday is below the market’s 85.0% and its gap to Thursday is wider than −5.8pt | Separate whether the dip is market-driven or property-specific |
| Today – this week | Check your pace for Fridays in mid- and late October by pickup since 45 days out | If the market has picked up +6.6 to +5.0pt since 45 days out and your pickup is below that | Detect early any lag on a day with little room to grow |
| Within two weeks | Offer Thu–Fri and Fri–Sat multi-night plans in your sales channels as a separate allocation from single-night stays | If your Thursday occupancy is close to the market’s 90.8% level and only Friday drops | Connect Thursday and Saturday demand to Friday inventory |
| Within two weeks | Shift Friday’s sales-channel mix away from business-travel-focused channels toward leisure and tourism | If resort hotels in the same area are rising on Friday (82.0%, +6.8pt vs. Thursday) while your Friday stays flat | Go after the demand segment that takes over on Friday |
| Toward next month | Put Friday, Sunday and Monday on a single preparation calendar as the “three trough days” | If the gap between the four plateau days (avg. 90.0%) and the three trough days (avg. 82.6%) is also around 7pt at your property | Move the 156 trough days a year from ad hoc handling to routine operation |
| Toward next month | Bring forward the review of Friday inventory release and sales conditions to the 45–30 days-out stage | If your Friday build-up relies on the final two weeks (in the market, Friday’s last-minute pickup tops out at +10.5pt) | Shift Friday’s curve from late-dependent to early-secured, moving it toward the Saturday pattern |
Source: MetroEngines Research; compiled by HotelBank Editorial Team
None of these guarantees results; they are levers to consider after confirming where your property sits relative to the market’s day-of-week structure. For Friday in particular, given that the room to recover through last-minute inventory adjustments is limited across the whole market, there is scope to bring the timing of decisions itself forward.
What changes if Friday gains a few points — sensitivity on an occupancy basis
The table below translates “how far the Friday dip must be filled to change the shape of the week” into simple occupancy arithmetic. Since price and revenue are outside the scope of this article, it shows only the number of additional rooms sold. It sets conversions based on 52 Fridays a year and a 100-room property alongside market-scale conversions applied to this article’s aggregation cohort (9,090 rooms as of September 10, 2026).
| Friday uplift | Friday estimated OCC | Weekly rank (of 7 days) |
Additional rooms sold per 100 rooms per year |
Scaled to the 9,090-room cohort (per year) |
|---|---|---|---|---|
| Current | 85.0% | 5th | — | — |
| +1pt | 86.0% | 5th (unchanged) | approx. 52 rooms | approx. 4,700 rooms |
| +3pt | 88.0% | 5th (short of Tue 88.9%) | approx. 156 rooms | approx. 14,200 rooms |
| +5pt | 90.0% | 3rd (level with Wed 90.0%) | approx. 260 rooms | approx. 23,600 rooms |
| +5.8pt (level with Thursday) | 90.8% | Tied for 1st | approx. 302 rooms | approx. 27,400 rooms |
Weekly rank is relative to estimated OCC by day of week for June–August 2026 (Mon 82.7, Tue 88.9, Wed 90.0, Thu 90.8, Fri 85.0, Sat 90.3, Sun 80.0). Additional rooms sold are simple arithmetic (“rooms × uplift in pt × 52 Fridays a year”) and do not indicate that the gain would be realized.
Source: MetroEngines Research; compiled by HotelBank Editorial Team
What deserves attention is that this +5.8pt is by no means a purely theoretical margin. On the booking curve, Friday has already built up to 74.5% at 14 days before the stay date. If the same final-two-week pickup as Thursday (+16.2pt) were to occur from there, Friday would land at 90.7%, almost the same level as Thursday’s day-of-week average of 90.8%. In other words, the Friday dip is not a matter of “insufficient pace up to 14 days out”; rather, the difference in the volume of demand arriving from 14 days out onward translates almost directly into the depth of the dip. This is also why the “early-stage securing” discussed in the previous section works.
Summary — three yardsticks for measuring the week in Hyogo
The day-of-week structure of Hyogo’s business hotels can be carried around in the following three numbers.
| Yardstick | Value | How to read it |
|---|---|---|
| Plateau-to-trough step | 7.4pt | The gap between the Tue/Wed/Thu/Sat average of 90.0% and the Mon/Fri/Sun average of 82.6%. If your property’s step is larger than this, there is room to improve how the trough days are run |
| Friday last-minute pickup | +10.5pt | Market growth from 14 days out to the final observation. About two-thirds of Thursday’s (+16.2pt). Friday is a day on which last-minute plays work poorly |
| Friday gap between hotel types | 12.6pt | The spread between the resort Fri − Thu (+6.8pt) and the business-hotel Fri − Thu (−5.8pt). Evidence that Friday demand is not missing but that its mix is shifting |
Source: MetroEngines Research; compiled by HotelBank Editorial Team
The 85.0% Friday figure itself is by no means a disastrous level. But Friday faces two overlapping conditions — it is sandwiched between days in the 90% range, and its late-stage room to grow is structurally small — which makes it “the day that will inevitably end as a trough if left alone.” Even among trough days, Sunday’s 80.0% tells a different story: an outflow after Saturday. Rather than lumping days together, separating them by who drives demand and by how much room to grow each stage offers is the starting point for weekly operations at Hyogo’s business hotels.
About the Data
- Definition of estimated OCC: occupancy based on OTA-listed inventory = 100 − 100 × OTA-listed remaining rooms ÷ total rooms. The sample is a fixed cohort of properties that list at least 30% of their total rooms on OTAs (the same set of properties for every stay date; see the breakdown below for property counts). It is an estimate based on how much of the inventory sold on OTAs has been taken, and its definition differs from actual room occupancy (it runs higher because unlisted rooms are counted as sold).
- Booking curves: based on observations from 45 days before the stay date to the most recent observation.
- Breakdown of N: the day-of-week aggregation (June–August 2026) covers Hyogo business hotels, N=70–76 properties / 8,165–9,090 rooms. September 1–17, 2026 covers N=74–78 properties / 9,000–9,130 rooms. The booking curves (September 3–5 and September 10–12) cover N=75–76 properties / 9,059–9,090 rooms. The October forward snapshot covers N=78 properties / 9,130 rooms. The hotel-type comparison covers city hotels N=20–25 properties / 3,224–3,759 rooms, resort hotels N=31–42 properties / 1,402–1,808 rooms, and all properties N=338–427 properties / 17,434–19,413 rooms. All are based on listings on major booking sites.
- Public holidays (July 20 and August 11, 2026) and the Obon period (August 12–16) are excluded from the day-of-week aggregation. The day-of-week ranking is the same with or without the exclusion.
- This article covers only the day-of-week structure of occupancy and does not cover price metrics.
- Data as of September 17, 2026. Booking status and inventory change daily, so the figures in this article are a snapshot at the time of retrieval.
■ Data Source
Published inventory and published price data from major booking sites, continuously tracked by MetroEngines Research (tracking approximately 168,000 properties in Japan, of which approximately 27,000 are confirmed to be in operation). For this article, accommodation properties in Hyogo were extracted by hotel type, using daily observations from June 1 to September 17, 2026, and, for each stay date in September and October 2026, observations from 45 days before the stay date onward.
■ Calculation Assumptions
Day-of-week values are simple averages by day of week of daily estimated OCC over the period (excluding the public holidays of July 20 and August 11, 2026 and the Obon period of August 12–16; 85 days). Booking-curve pickup by interval was calculated by averaging the two weeks of September 3–5 and September 10–12, 2026 by day of week and splitting at four points: 45 days out, 30 days out, 14 days out and the most recent observation. Additional rooms sold in the sensitivity table are simple arithmetic (“rooms × uplift in pt × 52 Fridays a year”) and do not indicate feasibility or revenue impact. Price and ADR are outside the scope of this article.
■ Limitations and Caveats
Estimated OCC is an estimate based on how much of the inventory listed on major booking sites has been taken, and its definition differs from actual room occupancy (it runs higher because unlisted rooms are counted as sold). The sample is a fixed cohort of properties listing at least 30% of their rooms, and the number of properties differs by aggregation unit (see the N figures in the text). Figures for upcoming stay dates are not final; they are a snapshot as of September 17, 2026. The day-of-week structure is a market-wide average and does not reflect differences due to individual properties’ location, guest mix or sales policies.