

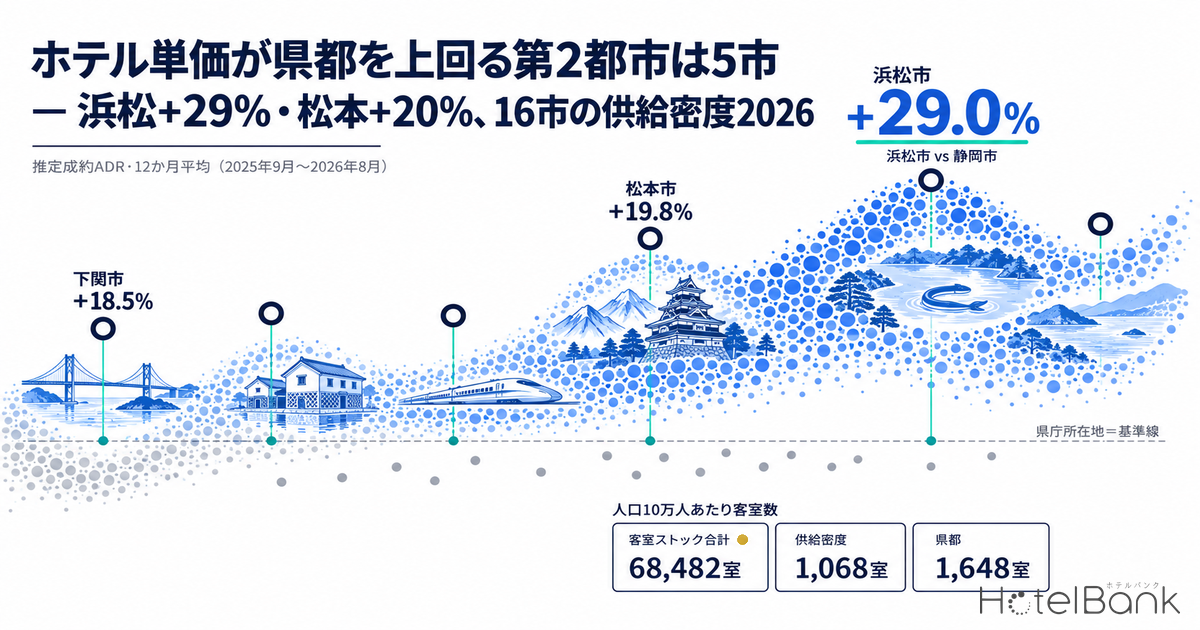
How far do hotel rates in a prefecture’s “second city” — the large city that is not the prefectural capital — diverge from those in the capital itself? We lined up the estimated settled ADR and room stock of 16 cities across 12 prefectures on identical terms for the latest 12 months (September 2025–August 2026). Five of these second cities out-priced their prefectural capital. The widest gap was Hamamatsu at +29.0%, followed by Matsumoto at +19.8% and Shimonoseki at +18.5%. What is more, 6 of the 16 cities actually have a larger population than their capital. This article maps where business and leisure demand hidden behind the capital really sits, using three lenses: rate, supply density and station catchment.
Metric Definitions Used in This Article
- ADR (Average Daily Rate): An estimated settled rate (tax-excluded equivalent), calculated by applying a property-type correction factor to the lowest-plan price level each property publishes on OTAs and similar channels (2 guests per room, per-room rate, tax-included). Cross-checked against property-level results disclosed by listed hotel REITs (91 properties, latest 3 months), the median error is about 7%. These are estimates and differ from each property’s actual transaction prices and accounting figures. Area-level ADR is the median of the covered properties (the level of a typical property in the area); this article uses the simple average of the latest 12 months (September 2025–August 2026).
- Room stock: Total rooms of properties confirmed as listed on major booking sites during the latest 3 months (June–August 2026). Properties whose listing could not be confirmed are excluded.
- Supply density: Rooms per 100,000 residents. Population is the city total from the Ministry of Internal Affairs and Communications’ Population Census (2020).
- Station ridership: FY2023 values from the MLIT Real Estate Information Library dataset “Passengers by Station”. For each city’s main station, the daily average sums the values of all operators recorded under the same station name.
- Data sources: MetroEngines Research & Consulting / MIC Population Census / MLIT Real Estate Information Library
- — On a 12-month average of estimated settled ADR (September 2025–August 2026), 5 of the 16 second cities out-priced their prefectural capital. The largest gap was Hamamatsu at +29.0%, followed by Matsumoto at +19.8% and Shimonoseki at +18.5%.
- — Combined supply density across the 16 cities is 1,068 rooms per 100,000 residents, 65% of the 1,648 rooms in the corresponding 12 capitals. City by city, the range spans 4.3x, from 588 rooms (Toyota) to 2,545 rooms (Matsumoto).
- — 6 of the 16 cities are more populous than their capital, and in 5 of the 12 prefectures covered, the capital is not the prefecture’s largest city.
- — The four cities whose rates hold close to the capital while supply density sits below the 16-city median (1,011 rooms) are Kurashiki, Hamamatsu, Takasaki and Yokkaichi — the clearest combination of room for new business-segment hotels.
- — A 100-room hotel in those four cities would generate annual room revenue of ¥196.5M–¥278.9M in the mid case (75.3% occupancy, 2025 full-year actual). Flexing ADR ±20% and occupancy 60–80% gives Kurashiki a range of ¥148.0M–¥296.1M (revenue side only).
Bottom Line — 68,000 Rooms Across 16 Second Cities, at 65% of the Capitals’ Supply Density
Taken together, the 16 cities hold 68,482 rooms for a population of 6.410 million, or 1,068 rooms per 100,000 residents. Applying the same calculation to the corresponding 12 prefectural capitals (Sapporo, Fukuoka, Nagoya, Kobe and others) gives 174,541 rooms for 10.592 million residents, or 1,648 rooms. Second-city supply density is only about 65% of the capitals’. Business travel, conferences and inbound demand tend to gather in the capitals, and room supply has built up there first as a result.
Look at rates, however, and the picture is less simple. On the 12-month average of estimated settled ADR, five second cities out-priced their capital: Hamamatsu (¥10,100, +29.0% vs Shizuoka City), Matsumoto (¥13,300, +19.8% vs Nagano City), Shimonoseki (¥9,600, +18.5% vs Yamaguchi City), Numazu (¥8,600, +9.0% vs Shizuoka City) and Kurashiki (¥8,500, +4.4% vs Okayama City). Takasaki (−1.6% vs Maebashi) and Yokkaichi (−7.2% vs Tsu) are nearly level. In at least half of the prefectures, rates are not concentrated in the capital.
How the Cities Were Selected — Non-Capitals Ranked Top 3 in Their Prefecture, 180,000+ Residents
We applied three criteria. First, the city is not the prefectural capital. Second, it ranks in the top three in its prefecture by population. Third, it has at least 180,000 residents. Population is the city total from the MIC Population Census (2020), compared on current post-merger city boundaries. Sixteen cities met these criteria.
Six of the 16 are more populous than their own prefectural capital: Hamamatsu (790,718 / Shizuoka City 693,389), Iwaki (332,931 / Fukushima City 282,693), Koriyama (327,692 / same), Takasaki (372,973 / Maebashi 332,149), Yokkaichi (305,424 / Tsu 274,537) and Shimonoseki (255,051 / Yamaguchi City 193,966). The assumption that “the capital is the prefecture’s largest city” fails in 5 of the 12 prefectures covered (Shizuoka, Fukushima, Gunma, Mie and Yamaguchi).
For the designated cities Hamamatsu and Kitakyushu, and for the comparison capitals Shizuoka City, Fukuoka, Nagoya, Kobe, Okayama City and Sapporo, municipal aggregates are split by ward. We rebuilt city-wide levels by weighting each ward series by its number of covered properties. All figures that follow are on this city-wide basis.
ADR Gap Between Second Cities and Capitals — Five Cities Out-Price the Capital, Led by Hamamatsu at +29.0%
Source: MetroEngines Research & Consulting (16 target cities, 12 comparison capitals)
The five cities on the plus side share a trait. In each case the capital is primarily a business-demand market, while the second city layers leisure and industrial lodging demand on top. Matsumoto is the gateway to Kamikochi and Utsukushigahara and holds the most properties of the 16 cities, at 195 properties and 6,138 rooms. In Shimonoseki, Kanmon Strait tourism and waterfront properties lift rates; Kurashiki has its Bikan Historical Quarter, and Numazu serves as a junction toward Izu and Hakone. Hamamatsu combines Lake Hamana resort demand with business travel tied to its manufacturing base in transport equipment and musical instruments.
The largest negative gaps are Himeji (−61.8% vs Kobe), Kurume (−53.8% vs Fukuoka), Kitakyushu (−48.8% vs Fukuoka) and Asahikawa (−43.2% vs Sapporo). Here the comparison is with the core of a major metropolitan area, where inbound and international-conference demand concentrates, so a wide gap is structurally natural. More noteworthy are Takasaki, Yokkaichi and Koriyama, whose gap to the capital is within 10% — markets where in-prefecture rates are not polarized.
| Second city | Prefecture | Population | Pref. rank | Est. ADR | Capital | Capital ADR | Gap |
|---|---|---|---|---|---|---|---|
| Hamamatsu | Shizuoka | 790,718 | 1st | ¥10,146 | Shizuoka City | ¥7,868 | +29.0% |
| Matsumoto | Nagano | 241,145 | 2nd | ¥13,252 | Nagano City | ¥11,058 | +19.8% |
| Shimonoseki | Yamaguchi | 255,051 | 1st | ¥9,590 | Yamaguchi City | ¥8,093 | +18.5% |
| Numazu | Shizuoka | 189,386 | 3rd | ¥8,574 | Shizuoka City | ¥7,868 | +9.0% |
| Kurashiki | Okayama | 474,592 | 2nd | ¥8,450 | Okayama City | ¥8,091 | +4.4% |
| Takasaki | Gunma | 372,973 | 1st | ¥7,350 | Maebashi | ¥7,472 | -1.6% |
| Yokkaichi | Mie | 305,424 | 1st | ¥7,148 | Tsu | ¥7,701 | -7.2% |
| Koriyama | Fukushima | 327,692 | 2nd | ¥7,458 | Fukushima City | ¥8,255 | -9.7% |
| Iwaki | Fukushima | 332,931 | 1st | ¥6,618 | Fukushima City | ¥8,255 | -19.8% |
| Toyota | Aichi | 422,330 | 2nd | ¥7,562 | Nagoya | ¥9,929 | -23.8% |
| Toyohashi | Aichi | 371,920 | 3rd | ¥7,554 | Nagoya | ¥9,929 | -23.9% |
| Hachinohe | Aomori | 223,415 | 2nd | ¥6,839 | Aomori City | ¥10,127 | -32.5% |
| Asahikawa | Hokkaido | 329,306 | 2nd | ¥8,605 | Sapporo | ¥15,146 | -43.2% |
| Kitakyushu | Fukuoka | 939,029 | 2nd | ¥7,672 | Fukuoka City | ¥14,993 | -48.8% |
| Kurume | Fukuoka | 303,316 | 3rd | ¥6,922 | Fukuoka City | ¥14,993 | -53.8% |
| Himeji | Hyogo | 530,495 | 2nd | ¥7,058 | Kobe | ¥18,498 | -61.8% |
Source: MetroEngines Research & Consulting (estimated settled ADR, monthly average Sep 2025–Aug 2026) / MIC Population Census (2020)
A note on sample sizes. The number of covered properties per month was stable for the 16 target cities; the only months falling below 60% of the series median were November 2025 for Himeji and Kobe. That month was excluded, so those two cities are compared on an 11-month average. All other 14 cities and 10 capitals use full 12-month averages.
Four Pairs Month by Month — Is the Gap Year-Round or Seasonal?
A 12-month average alone cannot tell whether a city beats its capital year-round or only thanks to a particular season. For four representative pairs among the five cities that out-priced their capital, we overlaid the monthly series for 2024, 2025 and 2026. The horizontal axis runs January to December so the same month can be compared across years.
Source: MetroEngines Research & Consulting (median covered properties: Hamamatsu 62 / Shizuoka City 74 / Matsumoto 102 / Nagano City 75)
Hamamatsu beat Shizuoka City in all 12 months, so the gap is not seasonal. It peaks in August — ¥12,500 in August 2025 and ¥12,200 in August 2026 — roughly 1.4–1.5 times Shizuoka City’s level in the same months (¥8,400 and ¥8,500 respectively). Resort properties around Lake Hamana lift rates in summer, but the fact that the gap persists in winter suggests that the city’s business hotels themselves are priced above Shizuoka City’s.
Matsumoto also out-prices Nagano City year-round, but the shape differs. It shows a clear mountain-resort curve, jumping to ¥17,200 (2025) and ¥16,000 (2026) in August and falling to ¥10,300–¥10,800 in February. Nagano City, which was in the ¥9,000 range in January–February 2025, stepped up to ¥12,200 and ¥10,800 in 2026. Across January–August 2026, Matsumoto was −1.3% year on year against Nagano City’s +11.8%, so the gap is narrowing — driven by Nagano City’s growth.
Source: MetroEngines Research & Consulting (median covered properties: Shimonoseki 40 / Yamaguchi City 29 / Kurashiki 42 / Okayama City 50)
Shimonoseki grew +9.6% year on year in January–August 2026, in sharp contrast to Yamaguchi City (−3.1%). In 2026 it recorded several months above ¥10,000 from the start of the year, including ¥10,200 in January and ¥10,400 in March. Kurashiki swings widely across the year, reaching ¥10,500 in August (2026) but dropping to ¥7,000 in June. Its gap with Okayama City is widest in August and only 4.4% for the full year. The most reasonable reading is that Kurashiki’s lead over the capital reflects heavy peak-season tourism demand lifting the average.
Supply Density — Toyota 588, Toyohashi 644: Cities Thin on Rooms for Their Size
We measure how many rooms are stacked against demand using rooms per 100,000 residents. The combined density of the 16 cities is 1,068 rooms and the city median is 1,011 rooms, both below the 1,648 rooms of the corresponding 12 capitals combined. The individual range is wide: the lowest is Toyota at 588 rooms, followed by Toyohashi at 644 and Kurume at 683. The highest is Matsumoto at 2,545 rooms, reflecting a city with mountain tourism destinations.
Source: MetroEngines Research & Consulting (listed-property basis, Jun–Aug 2026) / MIC Population Census (2020)
As a ratio to the capital, Kurume is 0.25x Fukuoka, Kitakyushu 0.32x, Toyota 0.37x and Toyohashi 0.41x — the closer a second city sits to a major metropolitan area, the lower its density. Overlapping commuting and day-trip zones have likely drawn overnight demand toward the core city. By contrast, Takasaki is 1.24x Maebashi, Numazu 1.61x Shizuoka City and Matsumoto 1.73x Nagano City, holding deeper room stock than their capitals.
| Second city | Listed properties | Rooms | Per 100k | Capital | Capital per 100k | Ratio |
|---|---|---|---|---|---|---|
| Toyota | 35 | 2,483 | 588 | Nagoya | 1,588 | 0.37 |
| Toyohashi | 22 | 2,397 | 644 | Nagoya | 1,588 | 0.41 |
| Kurume | 27 | 2,072 | 683 | Fukuoka City | 2,713 | 0.25 |
| Kitakyushu | 84 | 8,222 | 876 | Fukuoka City | 2,713 | 0.32 |
| Kurashiki | 86 | 4,205 | 886 | Okayama City | 1,202 | 0.74 |
| Takasaki | 50 | 3,340 | 896 | Maebashi | 724 | 1.24 |
| Yokkaichi | 46 | 2,822 | 924 | Tsu | 907 | 1.02 |
| Hamamatsu | 94 | 7,708 | 975 | Shizuoka City | 919 | 1.06 |
| Himeji | 69 | 5,550 | 1,046 | Kobe | 1,106 | 0.95 |
| Shimonoseki | 67 | 2,750 | 1,078 | Yamaguchi City | 1,471 | 0.73 |
| Hachinohe | 39 | 3,040 | 1,361 | Aomori City | 1,656 | 0.82 |
| Asahikawa | 102 | 4,765 | 1,447 | Sapporo | 2,007 | 0.72 |
| Koriyama | 73 | 4,823 | 1,472 | Fukushima City | 1,558 | 0.94 |
| Numazu | 87 | 2,807 | 1,482 | Shizuoka City | 919 | 1.61 |
| Iwaki | 102 | 5,360 | 1,610 | Fukushima City | 1,558 | 1.03 |
| Matsumoto | 195 | 6,138 | 2,545 | Nagano City | 1,475 | 1.73 |
Source: MetroEngines Research & Consulting (listed-property basis, Jun–Aug 2026, N=1,178 properties) / MIC Population Census (2020)
Re-Measuring by Station Catchment — Toyohashi Has 2,397 Rooms for 100,000 Daily Passengers
Population counts residents, not daytime visitors. So we used the MLIT Real Estate Information Library’s “Passengers by Station” (FY2023) and lined up each city’s main-station daily ridership as a proxy for demand scale. The figure is the city’s total rooms divided by main-station ridership in units of 10,000. Note that this is not a density cut around the station; it scales the whole city’s rooms by station catchment.
| Second city | Main station | Daily passengers | Rooms in city | Rooms per 10k passengers | ADR vs capital |
|---|---|---|---|---|---|
| Toyohashi | Toyohashi / Shin-Toyohashi | 100,040 | 2,397 | 240 | -23.9% |
| Takasaki | Takasaki | 63,608 | 3,340 | 525 | -1.6% |
| Himeji | Himeji | 97,078 | 5,550 | 572 | -61.8% |
| Toyota | Toyotashi / Shin-Toyota | 41,188 | 2,483 | 603 | -23.8% |
| Yokkaichi | Kintetsu-Yokkaichi / Yokkaichi | 44,001 | 2,822 | 641 | -7.2% |
| Numazu | Numazu | 37,007 | 2,807 | 759 | +9.0% |
| Kitakyushu | Kokura | 106,284 | 8,222 | 774 | -48.8% |
| Hamamatsu | Hamamatsu / Shin-Hamamatsu | 82,327 | 7,708 | 936 | +29.0% |
| Kurashiki | Kurashiki | 35,250 | 4,205 | 1,193 | +4.4% |
| Kurume | Kurume | 14,588 | 2,072 | 1,420 | -53.8% |
| Koriyama | Koriyama | 32,174 | 4,823 | 1,499 | -9.7% |
| Shimonoseki | Shimonoseki | 17,280 | 2,750 | 1,591 | +18.5% |
| Matsumoto | Matsumoto | 34,132 | 6,138 | 1,798 | +19.8% |
| Hachinohe | Hachinohe | 14,124 | 3,040 | 2,152 | -32.5% |
| Iwaki | Iwaki | 9,998 | 5,360 | 5,361 | -19.8% |
| Asahikawa | Asahikawa | 7,044 | 4,765 | 6,765 | -43.2% |
Source: MLIT Real Estate Information Library, “Passengers by Station” (FY2023) / MetroEngines Research & Consulting
The more a city’s demand runs on rail, the smaller this metric becomes. Toyohashi has 2,397 rooms against 100,000 daily passengers, and Takasaki 3,340 rooms against 63,608 — in both cases, rooms have not been built up in proportion to their large throughput as rail hubs. Conversely, Asahikawa and Iwaki are mainly reached by car, so station ridership does not represent demand scale and the figure comes out large. This metric is best read only for cities highly dependent on rail.
Note that density measured within a radius of each station — a different population from this article’s city-wide figures — is a separate analysis and is not directly comparable with the numbers here.
Rate and Density on One Plane — The Open Space in the Upper Left
Source: MetroEngines Research & Consulting / MIC Population Census (2020)
The zone where the y-axis is positive (rates above the capital) and the x-axis is to the left (few rooms relative to population) contains Kurashiki (886 rooms, +4.4%) and Hamamatsu (975 rooms, +29.0%). Rates are holding up while room stock is below the 16-city median of 1,011 rooms — a zone that can be read as having headroom to absorb additional business-segment rooms. Shimonoseki, at a density of 1,078 rooms, is slightly above the median, but at 0.73x its capital it points in the same direction.
Takasaki and Yokkaichi are nearly level with their capitals on ADR (−1.6% and −7.2%), and their densities of 896 and 924 rooms are below the median. With rates on par with the capital and low supply density, they share much of the character of the two cities above. Takasaki in particular, where the Joetsu and Hokuriku Shinkansen lines split, handles 63,608 daily passengers, yet room supply has built up only gradually relative to that pass-through demand.
Room Stock Distribution Across the 16 Cities
Source: MetroEngines Research & Consulting (listed-property basis, Jun–Aug 2026)
Circle size shows rooms and color shows estimated settled ADR relative to the capital: blue marks the five cities above their capital, pale gray the rest. Geographically, the five cities that beat their capital are in Shizuoka, Nagano, Yamaguchi and Okayama — all prefectures whose capital is inland or business-oriented.
Investment Implications — Three Readings
1. Rate-holding, low-density
Kurashiki, Hamamatsu, Takasaki and Yokkaichi. Rates stay close to the capital (−7.2% to +29.0%), while rooms per 100,000 residents are below the 16-city median (1,011 rooms). The clearest combination of room for new business-segment hotels.
2. Overflow for a core city
Kurume, Kitakyushu, Toyota and Toyohashi. Density is low at 0.25–0.41x the capital. While core-city rates keep rising, these locations can grow by catching demand spilling out to the periphery.
3. Deep seasonal peak
Matsumoto, Numazu and Shimonoseki. Tourism demand piles up in specific months and rates peak in August. Markets where peak-season revenue planning matters more than the annual average.
The four cities in group 1 keep rates close to their capital while holding relatively few rooms for their population. Kurashiki has 86 listed properties and 4,205 rooms, or 886 rooms per 100,000 residents; Yokkaichi has 46 properties and 2,822 rooms, or 924. Both have built up rooms more slowly than their capitals (Okayama City 1,202, Tsu 907), leaving headroom for new rooms to be absorbed as long as demand holds steady. In Yokkaichi, scheduled turnaround maintenance at the petrochemical complex also moves rates, a structural factor specific to that market.
Group 2 has the lowest density relative to the capital. Kurume is 0.25x Fukuoka and Kitakyushu 0.32x; while Fukuoka’s estimated settled ADR reaches ¥15,000 (12-month average), the two cities remain at ¥6,900 and ¥7,700. The higher core-city rates climb, the more overnight demand is likely to shift to surrounding cities on price, giving these cities potential as overflow destinations. Kitakyushu’s long-stay market is a further consideration for these cities.
As their monthly curves show, the three cities in group 3 see peak-month rates far above their annual average. Matsumoto records ¥16,000–¥17,200 in August, and Kurashiki ¥10,500 in August. Rather than basing investment assumptions on the annual average alone, it is more realistic to estimate absorption capacity in peak months and the floor in off-peak months separately.
As a macro backdrop, the Japan Tourism Agency’s Overnight Travel Statistics Survey puts 2025 nationwide room occupancy at 61.6%, with business hotels at 75.3% and city hotels at 74.1%. Business hotels are the mainstay of second-city business segments, and it is worth noting that they sit in the high-occupancy band nationally.
Revenue Range for the Four Group-1 Cities — Three Scenarios and ADR × Occupancy Sensitivity
Everything so far has been observed market data. For the four cities classified as group 1 (rate-holding, low-density), we now estimate the range of annual room revenue for a single 100-room business-segment hotel, using only observed ADR and published occupancy statistics. Land, construction, operating costs and financing are outside the scope of this article, and we do not address yields or investment decisions here. This is only a guide to the revenue-side range.
Occupancy is set at three levels. The mid case is the 2025 national business-hotel average of 75.3% from the Japan Tourism Agency’s Overnight Travel Statistics Survey; the pessimistic case is the same survey’s all-property-type average of 61.6% (a downside case for a business-focused hotel); and the optimistic case adds 5 points to the mid case for 80.3%. Only the optimistic case is our own assumption; the other two use published figures as-is. ADR uses each city’s 12-month average (September 2025–August 2026) as the mid case, with −10% for the pessimistic and +10% for the optimistic case.
| Second city | Observed ADR 12-month avg. | vs capital | Pessimistic (occ. 61.6%, 2025 full-year actual) | Mid (occ. 75.3%, 2025 full-year actual) | Optimistic (occ. 80.3%, assumption) | ||||||
|---|---|---|---|---|---|---|---|---|---|---|---|
| ADR | RevPAR | Revenue ¥M | ADR | RevPAR | Revenue ¥M | ADR | RevPAR | Revenue ¥M | |||
| Kurashiki | ¥8,450 | +4.4% | ¥7,605 | ¥4,685 | 171.0 | ¥8,450 | ¥6,363 | 232.2 | ¥9,295 | ¥7,464 | 272.4 |
| Hamamatsu | ¥10,146 | +29.0% | ¥9,131 | ¥5,625 | 205.3 | ¥10,146 | ¥7,640 | 278.9 | ¥11,161 | ¥8,962 | 327.1 |
| Takasaki | ¥7,350 | -1.6% | ¥6,615 | ¥4,075 | 148.7 | ¥7,350 | ¥5,535 | 202.0 | ¥8,085 | ¥6,492 | 237.0 |
| Yokkaichi | ¥7,148 | -7.2% | ¥6,433 | ¥3,963 | 144.6 | ¥7,148 | ¥5,382 | 196.5 | ¥7,863 | ¥6,314 | 230.5 |
Estimate: MetroEngines Research & Consulting (observed ADR = 12-month average of estimated settled ADR, Sep 2025–Aug 2026) / occupancy from the JTA Overnight Travel Statistics Survey, 2025 annual values. Revenue = ADR × occupancy × 100 rooms × 365 days.
Mid-case annual room revenue ranges from ¥196.5M in Yokkaichi to ¥278.9M in Hamamatsu, a spread of ¥82.4M across the four cities. In each city the optimistic case is roughly 1.6 times the pessimistic case, and the 18.7-point occupancy gap contributes more to that spread than the ±10% on ADR. Notably, Hamamatsu, whose rates far exceed its capital’s, beats the other three cities’ mid cases even in its pessimistic case (¥205.3M).
Next, taking Kurashiki — the city among the four that both beats its capital and has the lowest density — as an example, we show a two-axis sensitivity flexing ADR and occupancy independently. The center cell (observed ADR, 75% occupancy) is closest to the mid case.
| ADR (vs observed) | Occ. 60% | Occ. 65% | Occ. 70% | Occ. 75% | Occ. 80% |
|---|---|---|---|---|---|
| ¥6,760 (-20%) | 148.0 | 160.4 | 172.7 | 185.1 | 197.4 |
| ¥7,605 (-10%) | 166.5 | 180.4 | 194.3 | 208.2 | 222.1 |
| ¥8,450 (+0%) | 185.1 | 200.5 | 215.9 | 231.3 | 246.7 |
| ¥9,295 (+10%) | 203.6 | 220.5 | 237.5 | 254.5 | 271.4 |
| ¥10,140 (+20%) | 222.1 | 240.6 | 259.1 | 277.6 | 296.1 |
Estimate: MetroEngines Research & Consulting (based on Kurashiki’s observed estimated settled ADR of ¥8,450 = 12-month average, Sep 2025–Aug 2026). Revenue = ADR × occupancy × 100 rooms × 365 days.
The range spans ¥148.0M to ¥296.1M. In the row set at observed ADR (¥8,450), full-year occupancy of 60% yields ¥185.1M and 80% yields ¥246.7M, so the 20-point difference is worth ¥61.6M. Holding full-year occupancy at 75% and flexing ADR ±20% gives ¥185.1M to ¥277.6M, a ¥92.5M difference. In a market like Kurashiki, where rates rise sharply in peak season, bracketing where on this plane a hotel will land is more realistic than setting a single assumption from the annual average.
The estimates in this section cover the revenue side only and exclude cost of sales, operating expenses and capital costs. Actual project viability depends heavily on land acquisition cost, construction cost, operating agreement terms and financing, so please read these figures as a preliminary guide before those factors are examined.
Summary
Comparing 16 second cities on identical terms, five had higher estimated settled ADR than their prefectural capital and two were roughly level. In those seven cities — 44% of the sample — the assumption that “rates concentrate in the capital” does not hold. Moreover, 6 of the 16 cities are more populous than their capital, so a prefecture’s center of gravity does not necessarily lie in its capital.
On supply density, the 16 cities combined have 1,068 rooms per 100,000 residents, 65% of the 12 capitals’ 1,648 rooms. But the internal range spans 4.3x, from 588 rooms (Toyota) to 2,545 rooms (Matsumoto), so they cannot be lumped together. They split into three profiles: cities where rates hold and density is low (Kurashiki, Hamamatsu, Takasaki, Yokkaichi), cities with extremely low density relative to a core city (Kurume, Kitakyushu, Toyota, Toyohashi), and cities with deep seasonal peaks (Matsumoto, Numazu, Shimonoseki).
Judging a prefecture’s market by its capital alone misses all three of these profiles. A second city is not a “scaled-down capital”; it is more accurately treated as a market with its own demand structure.
Related Reading
References and Sources
■ Data sources
Estimated settled ADR is an estimated settled rate (tax-excluded equivalent), calculated by applying a property-type correction factor to the lowest-plan price level each property publishes on major booking sites (2 guests per room, per room, tax-included). At the municipal level we use the median of covered properties, averaged simply over the 12 months from September 2025 to August 2026. For designated cities (Hamamatsu, Kitakyushu, Shizuoka City, Nagoya, Sapporo, Fukuoka City, Okayama City and Kobe), ward-level series were weighted by the number of covered properties to rebuild city-wide levels. Room stock is the total rooms of properties confirmed as listed in June–August 2026 (16 cities: 1,178 properties, 68,482 rooms). Population is the city total from the MIC Population Census (2020); station ridership is the FY2023 value from the MLIT Real Estate Information Library’s “Passengers by Station”.
■ Modeling assumptions
The revenue ranges in Tables 4 and 5 are annual room revenue for a single 100-room business-segment hotel, calculated as ADR × occupancy × 100 rooms × 365 days (tax-excluded equivalent, excluding ancillary revenue). The mid-case occupancy is the 2025 national business-hotel average of 75.3% from the JTA Overnight Travel Statistics Survey, the pessimistic case is the same survey’s all-property-type average of 61.6%, and only the optimistic 80.3% (mid case plus 5 points) is our own assumption. ADR uses each city’s 12-month average as the mid case, with −10% pessimistic and +10% optimistic (−20% to +20% in Table 5). Supply density is rooms per 100,000 residents; the station-catchment metric is total city rooms divided by main-station daily ridership in units of 10,000.
■ Limitations
ADR is an estimate and differs from each property’s actual transaction prices and accounting figures (cross-checked against listed hotel REITs’ property-level disclosures for 91 properties over the latest 3 months, the median error is about 7%). Room stock is limited to properties whose listing could be confirmed; unlisted properties are excluded. Months in which the number of covered properties fell below 60% of the series median were excluded; this applies to November 2025 for Himeji and Kobe, so only those two cities use 11-month averages. Population is from the 2020 Census and station ridership from FY2023, so their reference dates differ from the ADR period. The station-catchment metric scales total city rooms by the main station and is not a density cut within a radius of the station; it overstates relative to actual demand in cities mainly reached by car. Tables 4 and 5 estimate the revenue side only, exclude land acquisition, construction, operating costs and financing, and do not indicate yields or investment decisions.
■ Market data
- MetroEngines Research & Consulting — municipal estimated settled ADR (Sep 2025–Aug 2026) and listed-property room stock (Jun–Aug 2026, N=1,178 properties)
■ Government statistics and public data
- MIC Population Census (2020), population by city — e-Stat System of Social and Demographic Statistics
- MLIT Real Estate Information Library, “Passengers by Station” (FY2023)
- Japan Tourism Agency, Overnight Travel Statistics Survey
- Japan Tourism Agency, Overnight Travel Statistics Survey, 2025 annual values (final)