

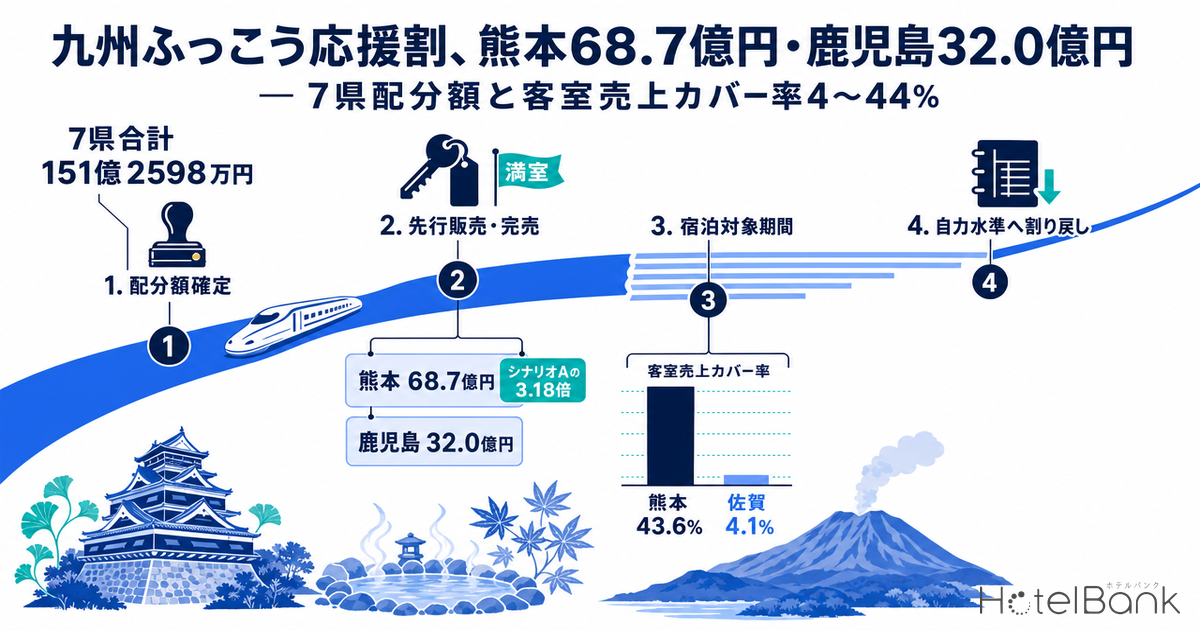
The prefecture-by-prefecture allocations for the Kyushu Fukko Ouenwari (Kyushu Recovery Travel Subsidy) are now all in. The project-cost caps for the seven prefectures total ¥15,125.98 million (about ¥15.13 billion), and they are heavily concentrated: Kumamoto receives ¥6,865.53 million (45.4% of the total) and Kagoshima ¥3,196.12 million (21.1%). The three pro-rata allocation scenarios our editorial team published on September 5 and 6 had all put Kumamoto at ¥2.16–2.78 billion. The actual figure is 2.5–3.2 times that. Taking these actual amounts as the starting point, this article re-expresses the subsidy pool as a share of hotels’ room revenue and sets out how to read back the October–December 2026 results.
Metric Definitions Used in This Article
- ADR (Average Daily Rate): An estimated settled rate (tax-exclusive equivalent), calculated by applying segment-specific adjustment factors to the lowest-priced plan each property publishes on major booking sites (per room, based on 2 guests per room, tax-inclusive). Checked against property-level results disclosed by listed hotel REITs (91 properties, most recent 3 months), the median error is about 7%. These are estimates and differ from each property’s actual transaction prices and accounting figures. Area-level ADR is the median of the properties covered (the level of a typical property in the area).
- Listed price (all-plan average, tax-inclusive): The average price of published plans ranging from room-only to meal-inclusive (per room, based on 2 guests per room). Its basis differs from the estimated settled ADR.
- Occupancy (estimated, based on inventory listed on major booking sites): Rooms sold as a share of total rooms in the area. It is an estimate based on the sell-through of inventory offered on major booking sites and is defined differently from a property’s actual overall occupancy.
- Room-night: A unit counting 1 room × 1 night. It differs from a “person-night,” which counts 1 person × 1 night.
- Data sources: MetroEngines Research; prefectural government releases and media reports
- — 7-prefecture project-cost caps total ¥15,125.98 million: Kumamoto ¥6,865.53M, Kagoshima ¥3,196.12M, Fukuoka ¥1,960.93M, Oita ¥1,076.21M, Nagasaki ¥1,001.49M, Miyazaki ¥791.99M, Saga ¥233.69M.
- — Our three allocation scenarios put Kumamoto at ¥2.16–2.78 billion. The actual amount is 3.18 times Scenario A. The allocation was weighted heavily toward damage severity, not supply size or actual person-nights.
- — Subsidy per room stands out in Kumamoto at about ¥318,000, versus about ¥153,000 in Kagoshima, ¥63,000 in Miyazaki and ¥34,000 in Saga — a 9.4x spread across the seven prefectures.
- — The subsidy as a share of room revenue over the eligible period (assuming 75% occupancy): Kumamoto 43.6%, Kagoshima 21.2%, Miyazaki 14.1%, Nagasaki 10.1%, Oita 5.6%, Fukuoka 5.0%, Saga 4.1%. Across 65–85% occupancy, Kumamoto ranges from 38.5% to 50.3%.
- — Kumamoto’s pool is large enough to fund discounts on 54.5% of the period’s room-night inventory. In Nagasaki, the advance-sale allotment on a major booking site sold out in about 20 minutes, and even in Kumamoto some sites sold out in about 30 minutes — the money lands heavily right after launch rather than spreading thinly over 86 days.
- — October–December 2026 results will be propped up by outside funding in proportion to these ratios. Lenders and investors setting 2027 debt-service capacity may want to scale results back to the pre-subsidy standalone level (measured occupancy for June–August 2026 and estimated settled ADR for October–December 2025).
Allocations by Prefecture — ¥15.13 Billion Across 7 Prefectures, 45.4% to Kumamoto
First, a note on how firmly each figure is confirmed. The Japan Tourism Agency has set, for each prefecture, a cap on the project costs that can be spent on discounts and administration, and each prefecture has submitted a supplementary budget funded from that cap to its September regular assembly session. Only a few prefectures have so far posted the amount on their official websites; for most, media reports of the proposal or passage in the prefectural assembly are the primary means of confirmation. The table below lists the basis of confirmation for each prefecture.
The seven-prefecture total is ¥15,125.98 million. The funding scale reported when the program was announced on August 28, 2026 was about ¥15.5 billion, a gap of about ¥370 million. Because the breakdown of that gap has not been disclosed, we do not speculate on it and use ¥15,125.98 million — the sum of the seven prefectures’ project-cost caps.
| Prefecture | Project-cost cap | Discount rate | Eligible stays | Basis of confirmation |
|---|---|---|---|---|
| Kumamoto | ¥6,865.53M | 60% | Oct 1–Dec 25 | Amount from media report (Nishinippon Shimbun, Sep 7). Discount rate, period and cap confirmed on prefecture’s official site |
| Kagoshima | ¥3,196.12M | 60% | Mid-Oct–Feb 28, 2027 (expected) | Reported as included in the supplementary budget proposal on Sep 17 (KTS, NHK). Period is an expectation based on media reports |
| Fukuoka | ¥1,960.93M | 50% | Oct 1–Dec 15 | Reported as announced by the prefecture on Sep 17 (KBC). Consistent with Nishinippon Shimbun’s 7-prefecture total |
| Oita | ¥1,076.21M | 50% | Oct 1–Dec 25 | Passed by prefectural assembly on Sep 3. Amount passed reported as ¥1,080M (OAB, OBS, TOS) |
| Nagasaki | ¥1,001.49M | 50% | Oct 1–Dec 25 | Submitted to prefectural assembly on Sep 7 (reported as “just over ¥1 billion”). Period confirmed on prefecture’s official site |
| Miyazaki | ¥791.99M | 50% | Oct 1–Dec 25 | Included in September supplementary budget (reported as about ¥791M). Period confirmed on prefecture’s official site |
| Saga | ¥233.69M | 50% | Oct 1–Dec 25 | Prefecture’s September supplementary budget proposal (No. 4), Tourism Division, “Kyushu Fukko Ouenwari project cost subsidy” |
| 7-prefecture total | ¥15,125.98M | — | — | Breakdown of gap vs. initially reported ~¥15.5bn not disclosed |
Source: Compiled by the HotelBank Editorial Team from prefectural government releases and media reports. Discount caps are per person per trip: ¥20,000 for stay-only and transport-inclusive 1-night trips; ¥30,000 for transport-inclusive trips of 2+ nights; ¥35,000 for multi-prefecture tours covering 2+ prefectures (Japan Tourism Agency)
The discount rate, cap amounts and start date are set uniformly by the Japan Tourism Agency, so differences between prefectures come down to two points: the discount rate (60% in Kumamoto and Kagoshima, 50% in the other five) and the end date. Fukuoka ends earliest, on December 15, while Kagoshima is reported to be planning to run until February 28, 2027 — a gap of two and a half months between the two extremes. As shown below, this difference in end dates moves the denominator of the room-revenue coverage ratio substantially.
Gap Between Our 3 Scenarios and the Actual Amounts — Kumamoto at 3.18x Scenario A
In our September 6 article, written before the allocation criteria were published, we set out three pro-rata rules. Scenario A allocated by room stock listed on major booking sites; Scenario B by total guest nights from the Japan Tourism Agency’s Overnight Travel Statistics Survey (2025 annual figures); and Scenario C started from the average of the A and B shares and applied a 1.5x weight to Kumamoto and Kagoshima, the two prefectures eligible for the 60% rate. Set against the actual amounts, all three missed in the same direction.
Source: Compiled by the HotelBank Editorial Team from MetroEngines Research and prefectural releases and media reports
| Prefecture | A: By room stock | B: By guest nights | C: Damage-weighted | Actual | Actual ÷ A |
|---|---|---|---|---|---|
| Kumamoto | 2.16 | 2.05 | 2.78 | 6.87 | 3.18x |
| Kagoshima | 2.10 | 2.05 | 2.74 | 3.20 | 1.52x |
| Fukuoka | 5.53 | 5.99 | 5.07 | 1.96 | 0.35x |
| Oita | 1.85 | 2.04 | 1.71 | 1.08 | 0.58x |
| Nagasaki | 1.91 | 1.83 | 1.65 | 1.00 | 0.52x |
| Miyazaki | 1.26 | 0.96 | 0.98 | 0.79 | 0.63x |
| Saga | 0.70 | 0.58 | 0.56 | 0.23 | 0.33x |
| 7-prefecture total | 15.50 | 15.50 | 15.50 | 15.13 | — |
Source: Scenarios A–C are estimates published by our editorial team on September 6, 2026 (MetroEngines Research; Japan Tourism Agency, Overnight Travel Statistics Survey, 2025 annual figures). Actual amounts from prefectural releases and media reports
Kumamoto’s actual share is 45.4%, 27.5 percentage points above the 17.9% in Scenario C, which weighted damage severity most heavily. Kagoshima’s 21.1% is close to its 17.7% in Scenario C. Conversely, Fukuoka came in at 13.0% versus 35.7% in Scenario A, and Saga at 1.5% versus 4.5% in Scenario A — both settling at about one-third of the level implied by their supply size.
What this shows is that the allocation was determined almost entirely by how concentrated the cancellation damage was — not by the size of the receiving capacity or the size of actual demand. The two prefectures affected by the suspension of the Kyushu Shinkansen between Kumamoto and Shin-Minamata take 66.5% of the total, leaving the remaining five to share 33.5%. Pro-rata allocations based on supply size or actual person-nights struggle to produce accurate estimates for damage-linked allocations like this one. When estimating similar programs in future, there is a case for making the geographic concentration of damage the main axis.
Subsidy per Room — ¥318,000 in Kumamoto vs. ¥34,000 in Saga, a 9.4x Spread
Because the allocation amounts themselves track the size of each prefecture, per-room figures are more comparable for lending and investment decisions. As the denominator we used the total number of rooms in each prefecture listed on major booking sites: Kumamoto 524 properties / 21,560 rooms; Kagoshima 535 / 20,917; Nagasaki 403 / 18,940; Oita 605 / 18,372; Miyazaki 236 / 12,502; Saga 179 / 6,879; and Fukuoka 632 / 54,891 (all based on listings on major booking sites).
Kumamoto stands out at about ¥318,000 per room. It is followed by Kagoshima at about ¥153,000, Miyazaki about ¥63,000, Oita about ¥59,000 and Nagasaki about ¥53,000, with Fukuoka (about ¥36,000) and Saga (about ¥34,000) the thinnest. The highest and lowest differ by a factor of 9.4.
Source: Compiled by the HotelBank Editorial Team from MetroEngines Research (total rooms based on listings on major booking sites; 7-prefecture total 3,114 properties / 154,061 rooms) and prefectural releases and media reports
What Share of Room Revenue Does the Subsidy Represent? — Kumamoto 43.6%, Saga 4.1%
This is the core of the article. The size of the subsidy only becomes meaningful when compared with the room revenue it sits on top of. We set the denominator using the following formula.
Period room revenue (estimate) = total rooms × nights in eligible period × occupancy × estimated settled ADR
Coverage ratio = allocation ÷ period room revenue
Nights are taken directly from each prefecture’s eligible stay period: 86 nights for Kumamoto, Saga, Nagasaki, Oita and Miyazaki (October 1–December 25); 76 nights for Fukuoka (October 1–December 15); and 136 nights for Kagoshima, assuming an October 16 start running through February 28, 2027. For estimated settled ADR, to align seasonality we used the average of finalized months in the same period of the prior year (October–December 2025). Only for Kagoshima, whose eligible period runs into February, did we use the five-month average from October 2025 to February 2026.
Rather than assume a single occupancy figure, we used three levels — 65%, 75% and 85% — to show a range. The band is grounded in recent measurements. Estimated occupancy based on inventory listed on major booking sites for June–August 2026 was highest in Fukuoka at 87.8–89.6%, followed by Kumamoto 77.5–89.6%, Saga 76.7–82.5%, Miyazaki 69.9–80.8%, Oita 75.5–79.8%, Kagoshima 75.4–79.6% and Nagasaki 74.3–78.3%. Most of the seven prefectures fall within a 70–85% band.
| Prefecture | Jun 2026 | Jul | Aug | Properties covered (Aug avg.) | Rooms covered (Aug avg.) |
|---|---|---|---|---|---|
| Fukuoka | 87.8% | 88.4% | 89.6% | 388 | 28,985 |
| Kumamoto | 77.5% | 80.7% | 89.6% | 298 | 12,788 |
| Saga | 76.7% | 80.0% | 82.5% | 110 | 3,906 |
| Miyazaki | 69.9% | 77.7% | 80.8% | 120 | 6,187 |
| Oita | 75.5% | 76.0% | 79.8% | 368 | 10,279 |
| Nagasaki | 74.3% | 75.6% | 78.3% | 212 | 11,153 |
| Kagoshima | 75.4% | 79.6% | 76.8% | 297 | 11,221 |
Source: MetroEngines Research. Estimates based on inventory listed on major booking sites; defined differently from a property’s actual overall occupancy. Properties and rooms covered are averages of daily observations in each month. Kagoshima excludes one property whose listed inventory was observed to far exceed its own room count
| Prefecture | Eligible nights | Est. settled ADR (prior-year period) |
65% occ. | 75% occ. | 85% occ. | Period room revenue (75% occ., ¥bn) |
|---|---|---|---|---|---|---|
| Kumamoto | 86 | ¥11,327 | 50.3% | 43.6% | 38.5% | 15.75 |
| Kagoshima | 136 | ¥7,059 | 24.5% | 21.2% | 18.7% | 15.06 |
| Miyazaki | 86 | ¥6,980 | 16.2% | 14.1% | 12.4% | 5.63 |
| Nagasaki | 86 | ¥8,085 | 11.7% | 10.1% | 8.9% | 9.88 |
| Oita | 86 | ¥16,114 | 6.5% | 5.6% | 5.0% | 19.10 |
| Fukuoka | 76 | ¥12,453 | 5.8% | 5.0% | 4.4% | 38.96 |
| Saga | 86 | ¥12,825 | 4.7% | 4.1% | 3.6% | 5.69 |
Source: Compiled by the HotelBank Editorial Team from MetroEngines Research (estimated settled ADR is the average of finalized months for October–December 2025; Kagoshima only, October 2025–February 2026; sample N=145–469 properties by prefecture) and prefectural releases and media reports. Occupancy figures are assumptions, not measurements
Source: Compiled by the HotelBank Editorial Team from MetroEngines Research and prefectural releases and media reports
Kumamoto comes to 43.6% assuming 75% occupancy, and 50.3% at 65%. In other words, an amount equivalent to roughly 40–50% of the prefecture’s October–December 2026 room revenue is layered on once, as outside funding. Kagoshima settles at 21.2% because its 136-night eligible period inflates the denominator, but recalculated on the same 86 nights as the other prefectures it comes to 34.2% (at 75% occupancy), second only to Kumamoto. How the picture shifts with the length of the period is worth keeping in mind when comparing prefectures.
The coverage ratio is just as sensitive to the rate assumption. Table 4-2 shows the sensitivity for Kumamoto, moving estimated settled ADR ±10% and ±20% from the prior-year level (¥11,327) and combining it with 65–85% occupancy. Even with a rate 20% above the prior year and occupancy rising to 85%, coverage is 32.0%; with a rate 20% lower and occupancy staying at 65%, it reaches 62.9%. In no combination does Kumamoto’s coverage fall below 30%.
| Est. settled ADR | 65% occ. | 70% occ. | 75% occ. | 80% occ. | 85% occ. |
|---|---|---|---|---|---|
| ¥9,062 (−20%) | 62.9% | 58.4% | 54.5% | 51.1% | 48.1% |
| ¥10,194 (−10%) | 55.9% | 51.9% | 48.4% | 45.4% | 42.7% |
| ¥11,327 (prior-year period) | 50.3% | 46.7% | 43.6% | 40.9% | 38.5% |
| ¥12,460 (+10%) | 45.7% | 42.5% | 39.6% | 37.1% | 35.0% |
| ¥13,592 (+20%) | 41.9% | 38.9% | 36.3% | 34.1% | 32.0% |
Source: Compiled by the HotelBank Editorial Team from MetroEngines Research (estimated settled ADR is the average of finalized months for October–December 2025) and prefectural releases and media reports. Bold marks the mid case in Table 4. Occupancy and rate are both assumptions
By contrast, Oita at 5.6%, Fukuoka at 5.0% and Saga at 4.1% represent only a few percent on top of Q4 revenue. In these three prefectures, carrying October–December 2026 results straight into 2027 plans introduces little program-driven distortion. Put the other way, in Kumamoto, Kagoshima and Miyazaki, scaling results back is essential.
How Many Room-Nights Can the Subsidy Fund? — 54.5% of Kumamoto’s Period Inventory
Alongside the revenue ratio, what matters in practice is how many room-nights of discounts the pool can fund. We set the outlay per room-night as “estimated settled ADR × discount rate.” The cap is ¥20,000 per person, so a room for two could receive up to ¥40,000 per room-night, but estimated settled ADR in all seven Kyushu prefectures is below that cap, so in practice the outlay is simply the rate multiplied by the discount rate.
| Prefecture | Total rooms | Subsidy per room | Discount per room-night | Room-nights funded | Period inventory (room-nights) | Share of inventory |
|---|---|---|---|---|---|---|
| Kumamoto | 21,560 | ¥318,400 | ¥6,800 | 1,010,172 | 1,854,160 | 54.5% |
| Kagoshima | 20,917 | ¥152,800 | ¥4,200 | 754,578 | 2,844,712 | 26.5% |
| Miyazaki | 12,502 | ¥63,300 | ¥3,500 | 226,920 | 1,075,172 | 21.1% |
| Nagasaki | 18,940 | ¥52,900 | ¥4,000 | 247,730 | 1,628,840 | 15.2% |
| Oita | 18,372 | ¥58,600 | ¥8,100 | 133,572 | 1,579,992 | 8.5% |
| Fukuoka | 54,891 | ¥35,700 | ¥6,200 | 314,941 | 4,171,716 | 7.5% |
| Saga | 6,879 | ¥34,000 | ¥6,400 | 36,444 | 591,594 | 6.2% |
Source: Compiled by the HotelBank Editorial Team from MetroEngines Research and prefectural releases and media reports. Period inventory is “total rooms × eligible nights,” an upper bound not multiplied by occupancy. Discount per room-night assumes stay-only products; for transport-inclusive travel products the discount can rise to the per-person cap
Source: Compiled by the HotelBank Editorial Team from MetroEngines Research and prefectural releases and media reports
Kumamoto’s pool is large enough to discount 54.5% of all room-nights that could be sold during the period. Since that exceeds half even on an upper-bound basis not multiplied by occupancy, restating it at realistic occupancy levels (75–85%) means discounts would reach 64–73% of the room-nights actually sold. Kagoshima reaches 31–35% on the same basis. This scale explains what happened right after sales opened on September 15.
The Money Does Not Spread Over 86 Days — Nagasaki Sold Out in ~20 Minutes, Parts of Kumamoto in ~30
The estimates so far assume the subsidy is distributed evenly across the whole eligible period. In reality, that is not how it lands. Nagasaki, which began advance sales at 10:00 on September 15, sold out its advance-sale allotment on a major booking site in about 20 minutes, and the prefecture’s official website posted a notice that “acceptance has been suspended because the budget limit has been reached.” In Kumamoto, which also began sales that day, some booking sites exhausted their inventory in about 30 minutes.
Nagasaki’s advance-sale allotment covered stays from October 1 check-in to December 1 check-out, with a sales window set to run until 23:59 on November 29. An allotment designed to be sold over two and a half months filled in 20 minutes. The prefecture has announced that sales for stays from December 1 onward will reopen from mid-November, so the pool is being released in several tranches.
This adds one condition to how the coverage ratio should be read. Even if the subsidy is equivalent to 10% of room revenue, that 10% does not land evenly across 86 days; it concentrates on the specific dates booked right after sales opened. When looking at monthly revenue for October–December 2026, therefore, it is worth separating out which dates subsidized bookings piled up on, rather than relying on the monthly average.
Cross-Checking Against the Prefecture’s Estimate — Oita Projects 54,000 Nights, We Estimate 133,000 Room-Nights
When you build your own estimate, it helps to cross-check it against official ones to expose differences in assumptions. When the Oita Prefectural Assembly passed the supplementary budget on September 3, the prefecture projected that stays in the prefecture using the subsidy would exceed at least 54,000 nights, with an economic ripple effect of ¥2.77 billion. That is a ripple-effect multiple of about 2.6x on project costs of ¥1,076.21 million.
Here the difference in assumptions becomes clear. Dividing ¥1,076.21 million by 54,000 nights gives about ¥19,900 per night, almost exactly the ¥20,000 per-person discount cap. The prefecture is estimating person-nights on the assumption that the full capped discount is applied, mainly on transport-inclusive travel products. This article, by contrast, applies the discount rate to estimated settled ADR on the assumption of stay-only products, giving ¥8,100 per room-night and 133,572 room-nights.
The same pool can fund more than twice as many nights depending on the assumed product mix. When reading someone else’s estimate in a credit review, first check “what outlay per night is being assumed.” A property selling mainly stay-only products will get room-night counts close to this article’s, while one handling many transport-inclusive packages will come closer to the prefecture’s assumption. Swap in just this one variable to match your own product mix and the numbers can be recalculated.
Rates Won’t Fall in January — the Step Change Is in Net Cost and Guest Volume
How should the period after the subsidy runs out be viewed? The first point to confirm is that rates themselves do not drop at the turn of the year. Comparing estimated settled ADR for October–December 2025 with January–February 2026, the difference is within 3% in five of the seven prefectures. Kagoshima rose +4.9% and Miyazaki +15.4% (Miyazaki’s February was higher than usual; N=163 properties).
Source: Compiled by the HotelBank Editorial Team from MetroEngines Research (estimated settled ADR, finalized months; sample N=145–469 properties per prefecture)
What changes when the program ends, therefore, is not the displayed price but the net cost travelers actually pay and the number of guests who move at that price. In prefectures with a 50% discount, the net cost doubles; in those with 60%, it rises 2.5x.
Prefectures have begun taking steps with this step change in mind. Miyazaki Prefecture pushed back the second phase of its own accommodation campaign, “Hinatabi,” from the originally planned December to a start on January 4, 2027. The restructuring avoids overlap with the subsidy’s eligible period and is designed to bridge the demand stimulus ending on December 25 into January. Kagoshima is reported to be setting the subsidy’s eligible period itself to run until February 28, 2027, positioning it to absorb the post-New Year lull within the program.
How Lenders and Investors Should Read This — Scale Q4 Results Back to Standalone Levels
Here we pull the figures together into a form usable for credit review and investment decisions. The share of October–December 2026 room revenue supported by outside funding ranges from 4.1% to 43.6% depending on the prefecture. This share is one-off and will not recur the following year. In other words, 2026 Q4 results cannot, as they stand, serve as a yardstick for earning power from 2027 onward.
In practice, results can be read back in three steps. First, subtract the coverage-ratio portion from Table 4 from actual revenue for the period to set a “standalone Q4 revenue.” In Kumamoto, 56.4% of actual revenue (assuming 75% occupancy) is standalone; in Kagoshima, 78.8%; in Oita, Fukuoka and Saga, around 95%. Second, set the most recent pre-subsidy measurements alongside as reference values. Estimated occupancy for June–August 2026 (Table 3) and estimated settled ADR for October–December 2025 (Table 4) both come from periods unaffected by the program and serve as a guide to standalone levels. Third, for the January–March 2027 outlook, decide how to factor in any post-program pullback.
On the third point, the 2016 Kyushu Fukko-wari offers a precedent. In our editorial team’s analysis, accommodation demand in January–June 2017, immediately after that program ended, came in at +8.7% year on year; demand did not fall below its original level after the program ended. First visits drawn in by the program may convert into repeat visits in later years, and the higher a prefecture’s coverage ratio, the larger that base.
From this angle, a high coverage ratio can also be read positively. Kumamoto properties can secure cash in 2026 Q4 that is more than 40% thicker than usual and direct it toward working capital for the January–March 2027 off-season or toward funding renovations of guest rooms and large public baths. From the lender’s side, debt-service capacity can be estimated on a standalone basis while the on-hand liquidity built up in Q4 is valued as a cash-flow safety margin. For prefectural budget officials, the coverage ratio becomes a common metric for comparing the “depth” of the program across prefectures.
Finally, here is how to rework this article’s estimates with your own property’s or prefecture’s figures. Only four inputs are needed: (1) your prefecture’s allocation, (2) your property’s room count, (3) assumed occupancy, and (4) your property’s average room rate and product mix (mainly stay-only or mainly transport-inclusive packages). The coverage ratio is “allocation ÷ (total rooms × eligible nights × occupancy × ADR),” and room-nights funded is “allocation ÷ (ADR × discount rate).” Prefectural allocations and eligible nights can be taken from Table 1, and rate levels from the estimated settled ADR in Table 4.
⚠ Note on rates for future dates: The estimated settled ADR used in this article’s coverage estimates is the finalized value for the same period of the prior year (October–December 2025; for Kagoshima, October 2025–February 2026), to align seasonality. Rates from October 2026 onward are estimates based on selling prices published on major booking sites at the time of research and will change as check-in dates approach. For reference, listed price levels (all-plan average, tax-inclusive) for October 2026 are Oita ¥35,500, Saga ¥31,200, Fukuoka ¥28,100 and Kumamoto ¥26,300; for January 2027, Oita ¥40,000, Saga ¥34,300, Fukuoka ¥27,900 and Kumamoto ¥26,200 — no drop at the start of the year. These are, however, current listed levels, not finalized figures.
Assumptions and limitations: Room revenue in this article is an estimate based on “total rooms × eligible nights × occupancy × estimated settled ADR” and differs from each property’s accounting figures and from official prefectural estimates. Total rooms cover only properties listed on major booking sites and exclude unlisted ryokan, minshuku (guesthouses) and simple lodging facilities. Discount amounts assume stay-only products; for transport-inclusive travel products the discount can reach the per-person cap (¥20,000–35,000), so actual depletion may be faster than estimated here. In addition, some prefectures’ allocations include administrative costs as well as discount funds, so the amount actually available for discounts may be lower than the figures in Table 1.
Summary
The prefectural allocations for the Kyushu Fukko Ouenwari have been finalized, with 45.4% of the seven-prefecture total of ¥15,125.98 million going to Kumamoto and 21.1% to Kagoshima. That skew cannot be reached by allocation based on supply size or actual person-nights; the allocation tracks the geographic concentration of damage almost exactly.
Restated against room revenue, the subsidy represents 43.6% in Kumamoto, 21.2% in Kagoshima, 14.1% in Miyazaki, 10.1% in Nagasaki, 5.6% in Oita, 5.0% in Fukuoka and 4.1% in Saga (all assuming 75% occupancy). In the three high-coverage prefectures, program-driven volume weighs heavily on October–December 2026 results, so gauging 2027 earning power requires scaling results back to standalone levels. In the four prefectures where coverage is only a few percent, that work is light.
And as Nagasaki’s roughly 20-minute sellout shows, the money lands heavily right after launch rather than being spread across the whole period. By looking at the build-up by date rather than monthly averages, you can separate demand moved by the program from demand that moved on its own. With that separation in hand, plans from January 2027 onward can be set close to actual underlying levels.
References and Sources
■ Data sources
Prefectural allocations (project-cost caps) are from prefectural releases and media reports; 7-prefecture total ¥15,125.98 million. Total rooms and property counts are from MetroEngines Research (based on listings on major booking sites; 7-prefecture total 3,114 properties / 154,061 rooms). Estimated settled ADR is from the same source (finalized months October 2025–February 2026; N=145–469 properties by prefecture). Estimated occupancy is from the same source (based on inventory listed on major booking sites; monthly averages of daily observations for June–August 2026).
■ Estimation assumptions
Period room revenue = total rooms × eligible nights × occupancy (three levels: 65%, 75%, 85%) × prior-year-period estimated settled ADR. Eligible nights: 86 for Kumamoto, Nagasaki, Oita, Miyazaki and Saga (Oct 1–Dec 25); 76 for Fukuoka (Oct 1–Dec 15); 136 for Kagoshima (Oct 16–Feb 28, 2027, an expectation based on media reports; ADR is the October 2025–February 2026 average). Discount per room-night = estimated settled ADR × discount rate (assuming stay-only products).
■ Limitations
Allocations are caps on project costs that may include administrative expenses, so the amount actually used for discounts may be lower. Total rooms cover only properties listed on major booking sites and exclude unlisted ryokan, minshuku and simple lodging facilities. Occupancy is an estimate defined differently from a property’s actual overall occupancy. The subsidy is assumed to be consumed evenly, but in practice it has been consumed in a concentrated burst right after sales opened.
■ Primary program information (national and prefectural governments, in Japanese)
- Japan Tourism Agency, “Kyushu Fukko Ouenwari” (disaster-related information) — discount rates, caps and start date
- Kumamoto Prefecture, “About the Kumamoto Fukko Ouenwari” (updated September 15, 2026)
- Nagasaki Prefecture, “About the Kyushu Fukko Ouenwari Nagasaki Campaign” (updated September 17, 2026; notice of suspension of advance-sale acceptance)
- Oita Prefecture, “Kyushu Fukko Ouenwari” (updated September 3, 2026)
- Miyazaki Prefecture, “Implementation of the Kyushu Fukko Ouenwari – Miyazaki-wari Campaign – and Phase 2 of Hinatabi” (updated September 16, 2026)
- Kyushu Fukko Ouenwari information site — booking start dates and eligible periods for the seven prefectures
■ Media reports on allocations (in Japanese)
- “Kyushu Fukko Ouenwari” project costs for 7 prefectures revealed: over ¥6.8 billion for Kumamoto, about ¥1.9 billion for Fukuoka (Nishinippon Shimbun, September 7, 2026) — project-cost caps by prefecture and ¥15,125.98 million total
- “Kyushu Fukko Ouenwari”: Kumamoto goes on sale on the 15th, subsidy of up to ¥20,000 per night (Nikkei, September 11, 2026)
- Kyushu Fukko Ouenwari: Oita begins booking sales on the 25th; parts of Kumamoto and Nagasaki sold out (Nikkei, September 15, 2026)
- Bookings open for Nagasaki’s Kyushu Fukko Ouenwari: major travel site’s advance allotment sold out in about 20 minutes (Nagasaki International Television, September 15, 2026)
- Up to 60% off: “Kumamoto Fukko Ouenwari” goes on sale, some booking sites sell out in 30 minutes (KAB Kumamoto Asahi Broadcasting, September 15, 2026)
- [Kyushu Fukko Ouenwari] Kagoshima allocation about ¥3.2 billion (KTS Kagoshima Television, September 17, 2026)
- Details of Fukuoka’s “Kyushu Fukko Ouenwari” tourism support revealed (KBC Kyushu Asahi Broadcasting, September 17, 2026) — Fukuoka ¥1,960.93 million, October 1–December 15
- Supporting tourism hit by cancellations after the Kumamoto earthquake: Oita’s “Kyushu Fukko Ouenwari” discounts worth ¥1 billion, ¥2.77 billion ripple effect expected (TOS TV Oita / FNN Prime Online, September 7, 2026) — Oita’s 54,000 nights and ¥2.77 billion economic ripple effect
- “Kyushu Fukko Ouenwari”: just over ¥1 billion budgeted for project costs (Nagasaki International Television, September 7, 2026)
- “Kyushu Fukko Ouenwari” in Miyazaki to start with October 1 stays; ¥791 million in project costs in supplementary budget proposal (Yomiuri Shimbun Online, September 11, 2026)
- Saga’s “Kyushu Fukko Ouenwari”: online bookings open September 24 (Saga Shimbun, September 11, 2026)
- Miyazaki to sell Kyushu Fukko Ouenwari from the 25th, with its own support in January 2027 (Nikkei, September 15, 2026)
■ Market data
- MetroEngines Research — estimated settled ADR (monthly by prefecture, N=145–469 properties per prefecture), total rooms and property counts (based on listings on major booking sites; 7-prefecture total 3,114 properties / 154,061 rooms), estimated occupancy (based on inventory listed on major booking sites, June–August 2026)
- Japan Tourism Agency, Overnight Travel Statistics Survey, 2025 annual figures — allocation basis for Scenario B (used in our editorial team’s estimate published September 6, 2026)