

Halloween 2026 — October 31 — falls on a Saturday. It is a standalone Saturday rather than the eve of a public holiday, and the following day, November 1, is a Sunday before a regular workday. How much hotel inventory does this kind of “one-night, after-dark demand” actually absorb in urban markets? We compared room-availability trends and observed prices for seven city wards — Shibuya, Toshima and Shinjuku in Tokyo; Chuo and Kita in Osaka City; Naka in Nagoya City; and Chuo in Fukuoka City — against every other Saturday in October.
Metric Definitions Used in This Article
- ADR (Average Daily Rate): An estimated settled rate (tax-excluded equivalent), calculated by applying a property-type adjustment factor to the lowest published plan level on OTAs and similar channels (per room, 2 guests per room, tax included). Checked against property-level results disclosed by listed hotel REITs (91 properties, most recent 3 months), the median error is about 7%. These are estimates and differ from each property’s actual settled prices and accounting figures. Area-level ADR is the median of the properties covered (the level of a typical property in the area).
- OCC (Occupancy): The share of rooms sold out of total rooms in the area (an estimate based on OTA sales inventory). In this article it is labeled “occupancy (OTA-listed inventory basis, estimated)”. It is an estimate based on how inventory sold on OTAs is being absorbed and differs from a property’s actual overall occupancy.
- LT (Lead Time): Days until check-in. LT0 = the day of stay. The curves in this article use only LT45 and closer.
- Rooms-remaining rate: Rooms still available on OTAs as a share of a property’s total rooms.
- Listed price: The per-room price averaged across all plans published on OTAs and similar channels at the time of the survey (2 guests per room, tax included). It is on a different basis from the estimated settled ADR.
- Data source: MetroEngines Research
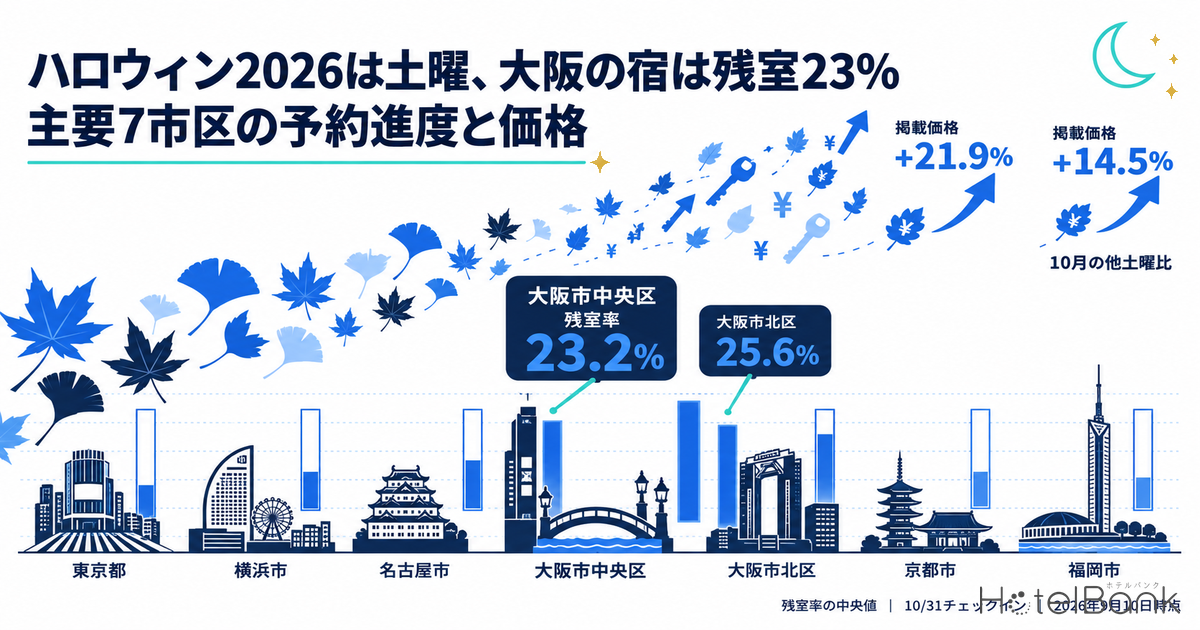
- — Osaka’s Chuo Ward has a median rooms-remaining rate of 23.2%, with Kita Ward at 25.6% — the furthest booked-ahead of the seven wards (as of September 10, 2026; 248 properties / 35,167 rooms covered).
- — Only the two Osaka wards list October 31 above October’s other Saturdays (Chuo +21.9%, Kita +14.5%). The three Tokyo wards, Nagoya and Fukuoka are flat to negative.
- — Estimated settled ADR for October 2026 is up 19.9% to 23.9% YoY in the three Tokyo wards, while the two Osaka wards are down 18.7% to 19.1% as the Expo effect unwinds.
- — The October 10–12 three-day weekend is a two-night pattern in which inventory keeps moving through Sunday night; October 31 is a single-night pattern concentrated on Saturday night. Products built around single nights, late-night check-in and room-only stays fit this date.
- — Since October 2024, Shibuya has banned nighttime drinking in public places year-round. With the restriction no longer specific to Halloween, demand is more likely to spread to other areas.
A Saturday Halloween, and Crowds Reshaped by Regulation
In years when Halloween lands on a Saturday, crowds tend to linger late into the night, and more people stay out without worrying about the last train. At the same time, street-level rules in major cities have changed markedly in recent years. Shibuya City amended its ordinance on securing a safe and secure environment around Shibuya Station, and since October 1, 2024 it has banned drinking in public places from 6 p.m. to 5 a.m. year-round. Before the amendment, the restriction applied only during the Halloween period and the New Year holidays; it has now been switched from a fixed period to permanent application (Shibuya City portal, “Ordinances and Reports”). The ordinance carries no penalties, and compliance is ensured through patrols by security staff.
In other words, October 31 is no longer a specially regulated day in Shibuya. Put the other way, the “it’s Halloween, so go to Shibuya” motivation is weaker for visitors, and demand is more likely to spread to other areas. In Toshima Ward, for example, the “Ikebukuro Halloween Cosplay Fes 2026” will run for three days from Friday, October 30 to Sunday, November 1 — the first time in five years that the schedule includes Halloween itself. The program includes a main-stage lineup at Naka-Ikebukuro Park and a cosplay parade of about 400 participants; from a lodging-demand perspective, it gives visitors a clear reason to stay (DWANGO Co., Ltd. release). In Osaka’s Minami district, the prefectural police have in past years deployed large-scale security around Ebisubashi Bridge and put up screens on Dotonboribashi Bridge, among other crowd-control measures.
From here, we use observed data to see how each city’s circumstances show up in hotel inventory.
October Saturdays Fill Up Faster Week by Week
As an overview, we first compare how far each October Saturday had been absorbed at the same lead time. The chart below shows occupancy (OTA-listed inventory basis, estimated) at LT45 — 45 days before the stay date. To compare the same set of properties for the same dates, each ward uses a fixed cohort of properties that list at least 30% of their total rooms on OTAs.
Source: Compiled by HotelBank Editorial Team from MetroEngines Research data
In six of the seven wards — all but Nagoya’s Naka Ward — the later Saturdays of October 17 and 24 are at or above the early-month Saturday of October 3. Osaka’s Chuo Ward rose from 49.8% on October 3 to 66.1% on October 24, and Fukuoka’s Chuo Ward from 66.8% to 81.7% — 15 to 16 points higher on the same 45-days-out yardstick. Toshima also moved from 47.2% to 63.8%, showing that inventory for late-October Saturdays is moving earlier. Nagoya’s Naka Ward alone stands out with 85.1% on October 3, its furthest booked-ahead date of the month.
One note on how the data is handled. At the time of writing, October 31 is still more than 45 days away, so the area-level booking curve has not yet entered its reliable observation window (LT45 and closer). Observations more than 45 days out include periods before properties add inventory, and may not accurately reflect booking progress. We therefore do not compare curves for October 31; instead, we treat it as “current booking pace” using the property-level rooms-remaining snapshot described below.
Three-Day Weekends and Single-Night Saturdays Produce Different Curves
Saturday, October 10 to Monday, October 12 (Sports Day) is a three-day weekend. Halloween on October 31 is a single-night pattern, followed by Sunday, November 1. The two carry different kinds of demand, and the difference shows most clearly in the gap between Saturday and the following Sunday.
Source: Compiled by HotelBank Editorial Team from MetroEngines Research data
Looking at Osaka’s Chuo Ward from LT45 to LT31, the five lines climb almost in parallel while keeping the same order: the first day of the three-day weekend (10/10) on top, the middle day (10/11) nearly overlapping the regular Saturday (10/3), and the last day (10/12) at the bottom. On the middle day of a holiday weekend, Sunday night — normally a weak night — is lifted to Saturday levels. In other words, two-night stays are providing support.
Source: Compiled by HotelBank Editorial Team from MetroEngines Research data
Lining up the change in occupancy from Saturday to the following Sunday makes this structure clearer. On a regular weekend (10/3→10/4), Nagoya’s Naka Ward drops 10.5 points and Fukuoka’s Chuo Ward 6.3 points; over the three-day weekend (10/10→10/11), the changes are −4.6 points and −6.9 points respectively. In Nagoya, the holiday weekend cuts the Sunday-night drop to less than half. Shibuya goes further: from −1.4 points on a regular weekend to +1.9 points on the middle day of the holiday weekend, actually exceeding Saturday.
Halloween on October 31 falls into the “single-night” type, not the “holiday weekend” type. Demand is likely to concentrate on Saturday night, with Sunday, November 1 following the usual Sunday decline. Properties that can handle single-night stays, late-night check-in and room-only bookings are best positioned to capture this night. For how holiday-weekend demand in Osaka peaks day by day, see Osaka Sep 2026 Holiday: Demand Peaks First 2 Nights, which breaks it down at three snapshots: T-45, T-30 and T-14.
October 31 Booking Pace — A Current Property-Level Snapshot
From here we use property-level data. Across the seven wards, we limited the sample to properties listing at least 30% of their total rooms on OTAs and tallied the rooms-remaining rate for October 31 check-in. The seven wards contain 2,865 properties in scope; after excluding those with less than 30% of rooms listed on OTAs from the properties with observation data, 248 properties (35,167 rooms in total) were included.
| Ward | Properties in scope | Covered | Rooms covered | Median rooms-remaining rate | Share of properties with ≤20% rooms left |
|---|---|---|---|---|---|
| Shibuya, Tokyo | 202 | 16 | 2,214 | 51.3% | 12.5% |
| Toshima, Tokyo | 316 | 28 | 4,198 | 53.7% | 14.3% |
| Shinjuku, Tokyo | 548 | 52 | 7,188 | 40.6% | 23.1% |
| Chuo, Osaka City | 800 | 52 | 9,074 | 23.2% | 42.3% |
| Kita, Osaka City | 296 | 9 | 2,929 | 25.6% | 44.4% |
| Naka, Nagoya City | 333 | 33 | 6,385 | 37.3% | 15.2% |
| Chuo, Fukuoka City | 370 | 58 | 3,179 | 60.9% | 12.1% |
Source: Compiled by HotelBank Editorial Team from MetroEngines Research data
Source: Compiled by HotelBank Editorial Team from MetroEngines Research data
Osaka’s Chuo Ward has the lowest median rooms-remaining rate at 23.2%, followed by Osaka’s Kita Ward at 25.6%. The share of properties down to 20% or fewer rooms remaining is also far higher in Osaka — 42.3% in Chuo and 44.4% in Kita — than in the other five wards (12–23%). On the Tokyo side, Shibuya is at 51.3%, Toshima 53.7% and Shinjuku 40.6%, meaning roughly half of inventory is still listed. Fukuoka’s Chuo Ward has the most headroom at 60.9%.
At the property level, the most advanced booking pace is concentrated almost entirely in business hotels with 50–300 rooms. The table below lists covered properties with 50 or more rooms in ascending order of rooms-remaining rate (excerpt).
| # | Ward | Property | Rooms | Rooms-remaining rate | Share of rooms on OTAs |
|---|---|---|---|---|---|
| 1 | Kita, Osaka City | Second Inn Umeda (セカンド・イン梅田) | 128 | 0.0% | 47.7% |
| 2 | Shinjuku | Hotel Shena (ホテルシェーナ) | 83 | 2.4% | 69.9% |
| 3 | Chuo, Osaka City | Kuromon Crystal Hotel (黒門クリスタルホテル) | 69 | 2.9% | 40.6% |
| 4 | Shinjuku | Nishitetsu Inn Shinjuku (西鉄イン新宿) | 300 | 3.3% | 65.3% |
| 5 | Chuo, Osaka City | Hotel MyStays Midosuji Honmachi (ホテルマイステイズ御堂筋本町) | 108 | 3.7% | 57.4% |
| 6 | Shinjuku | Super Hotel Shinjuku Kabukicho (スーパーホテル 新宿歌舞伎町) | 117 | 4.3% | 32.5% |
| 7 | Chuo, Osaka City | Hotel Livemax Osaka Yodoyabashi (ホテルリブマックス大阪淀屋橋) | 184 | 6.0% | 41.8% |
| 8 | Chuo, Osaka City | APA Hotel Yodoyabashi Kitahama-Ekimae (アパホテル〈淀屋橋 北浜駅前〉) | 193 | 6.2% | 30.6% |
| 9 | Naka, Nagoya City | Sanco Inn Nagoya Fushimi (三交イン名古屋伏見) | 138 | 6.5% | 46.4% |
| 10 | Chuo, Osaka City | APA Hotel Midosuji Hommachi-Ekimae (アパホテル〈御堂筋本町駅前〉) | 194 | 6.7% | 87.6% |
| 11 | Chuo, Fukuoka City | Life Tenjin Fukuoka (ライフ天神福岡) | 131 | 6.9% | 82.4% |
| 12 | Naka, Nagoya City | Princess Garden Hotel (プリンセスガーデンホテル) | 197 | 7.1% | 47.2% |
Coverage: properties with 50 or more rooms among the 248 properties in the 7 wards. Observed as of September 10, 2026. Source: Compiled by HotelBank Editorial Team from MetroEngines Research data
How to read this (3 caveats)
- This shows bookings in progress, not confirmed sell-outs. With more than 45 days to the stay date, inventory additions and price changes will alter the picture.
- Some properties with low rooms-remaining rates may be deliberately limiting their OTA allocation. Possible reasons include channel strategies centered on direct website sales or travel-agency and corporate contracts, inventory control that releases rooms gradually as check-in approaches, and small contractual allotments — which cannot be distinguished from public OTA data alone. Limiting the sample to properties with at least 30% of rooms on OTAs reduces these false positives but cannot eliminate them.
- Figures are based on OTA listings as of September 10, 2026. Inventory can change during the day due to property-side actions.
Only Osaka Prices October 31 Above Other Saturdays
Demand strength also shows up in prices. For the covered properties, we compared median listed prices (all-plan average, 2 guests per room, tax included) for October 31 against the other Saturdays in the month (10/3, 10/10, 10/17 and 10/24).
Source: Compiled by HotelBank Editorial Team from MetroEngines Research data
| Ward | 10/31 listed price | Median of other Oct. Saturdays | Difference |
|---|---|---|---|
| Shibuya, Tokyo | ¥62,626 | ¥66,478 | -5.8% |
| Toshima, Tokyo | ¥39,244 | ¥42,565 | -7.8% |
| Shinjuku, Tokyo | ¥57,777 | ¥58,716 | -1.6% |
| Chuo, Osaka City | ¥35,449 | ¥29,074 | +21.9% |
| Kita, Osaka City | ¥54,886 | ¥47,917 | +14.5% |
| Naka, Nagoya City | ¥34,966 | ¥39,944 | -12.5% |
| Chuo, Fukuoka City | ¥52,288 | ¥52,756 | -0.9% |
Coverage: median listed price of 9–25 properties per ward (as of the September 10, 2026 survey). Source: Compiled by HotelBank Editorial Team from MetroEngines Research data
October 31 is clearly higher only in Osaka’s Chuo Ward (+21.9%) and Kita Ward (+14.5%). Shinjuku (−1.6%) and Fukuoka’s Chuo Ward (−0.9%) are roughly level, while Shibuya (−5.8%), Toshima (−7.8%) and Nagoya’s Naka Ward (−12.5%) are actually priced higher on October’s other Saturdays. Osaka’s Halloween-season demand also shapes pricing in the Bay Area around Universal Studios Japan, where park-front hotels and alternative areas show distinct price structures during the park’s 25th-anniversary Halloween events.
This suggests Halloween is no longer a nationwide, uniform lodging-demand event. In Minami and Kita, inventory absorption (median rooms-remaining rates of 23.2% and 25.6%) and prices point in the same direction, with rates set to reflect October 31. The three Tokyo wards, by contrast, show little difference from the other October Saturdays used for comparison (10/3, 10/10, 10/17 and 10/24) and treat the date on par with the rest of the month. Given Shibuya’s year-round restriction on nighttime street drinking and the Ikebukuro event running from October 30 to November 1, Tokyo demand may be spread across the whole weekend rather than concentrated on October 31 alone. Note that listed prices are a snapshot at the time of the survey and will change as the stay date approaches.
October Estimated Settled ADR — Tokyo Up 20%, Osaka in a Post-Expo Correction
Shifting from daily listed prices to monthly levels, the year-over-year differences between wards become even clearer.
Source: Compiled by HotelBank Editorial Team from MetroEngines Research data
For October 2026, estimated settled ADR is up 23.9% YoY in Shinjuku (¥17,000→¥21,100, N=91→96 properties), 22.4% in Shibuya (¥27,800→¥34,100, N=32→31 properties) and 19.9% in Toshima (¥13,000→¥15,600, N=60→59 properties) — all three Tokyo wards up around 20%. Fukuoka’s Chuo Ward shows a more modest rise of 5.1% (¥16,400→¥17,300, N=81→82 properties).
In contrast, Osaka’s Chuo Ward is down 18.7% (¥16,500→¥13,500, N=188→189 properties) and Kita Ward down 19.1% (¥15,000→¥12,100, N=73→72 properties) from a year earlier. October 2025 was the final stretch of Expo 2025 Osaka, Kansai, so the prior-year baseline itself is elevated. This decline is therefore better read as a return to post-event levels than as a retreat in demand. The earlier finding that October 31 prices are about 20% above other Saturdays occurs within this structure of “below last year for the month as a whole, but spiking on specific dates.” Nagoya’s Naka Ward shows a large 59.2% increase (¥9,300→¥14,800, N=89→85 properties), but because this partly reflects a rebound from the lowest prior-year level of the seven wards, the absolute level (¥14,800) is a better guide to the actual situation. For weekday-level differences across these four cities, see also Weekday ADR in Tokyo, Nagoya, Osaka & Fukuoka.
The Opportunity for Operators — Single Nights, Late Arrivals, Room-Only
From the data so far, we draw three practical implications for urban properties.
First, there is room to design October 31 as a “one-night-only” stay. The middle day of a three-day weekend lifts demand through Sunday night, but the day after October 31 is a regular Sunday, so the normal weekend Sunday decline — −10.5 points in Nagoya’s Naka Ward and −6.3 points in Fukuoka’s Chuo Ward — is likely to apply. Reliably capturing single-night stays at a high rate fits this date’s demand shape better than imposing a two-night minimum stay.
Second, accommodating late-night check-in is a differentiator. A Saturday Halloween tends to keep crowds out late. Staffed front-desk hours, self-check-in kiosks, and housekeeping and key-handover operations that can accept late arrivals become clear booking criteria on this particular night. In areas like Shibuya, where drinking in public places is restricted by time of day, the people who stay out longest are the ones who most need “a room just to come back and sleep in.”
Third, a room-only inventory mix works in a property’s favor. The properties furthest ahead in booking pace were concentrated almost entirely among business hotels with 50–300 rooms. This is a segment chosen on price, location and check-in convenience rather than breakfast or meal-inclusive packages. The upside lies in how finely a property can tier its prices for this single-night demand. While the two Osaka wards already list about 20% above other Saturdays, the three Tokyo wards are nearly level with the month’s other Saturdays. In Tokyo, there is still room to price Friday, October 30 through Sunday, November 1 as a single three-day block, taking event schedules and local crowd patterns into account.
Summary
October 31, 2026 falls on a Saturday, but it is not a uniform nationwide peak for lodging demand. The area-level booking curve becomes reliable only from 45 days before the stay date, so for now booking pace is measured with a property-level rooms-remaining snapshot. At this point, the clear leaders are Osaka’s Chuo Ward (median rooms-remaining rate of 23.2%) and Kita Ward (25.6%), whose listed prices are also 21.9% and 14.5% above October’s other Saturdays. The three Tokyo wards, Nagoya’s Naka Ward and Fukuoka’s Chuo Ward are at or below the month’s other Saturdays on both price and inventory.
In terms of demand type, the October 10–12 three-day weekend is a two-night pattern that absorbs inventory through Sunday night, whereas October 31 is likely to be a single-night pattern concentrated on Saturday night. For urban properties strong on all three conditions — single nights, late-night check-in and room-only stays — this shape is exactly the demand they can capture. How the curves rise once the stay date is within 45 days will determine where each ward finally lands.
⚠ Note on data for future dates: Listed prices, rooms-remaining rates and estimated settled ADR for future dates in this article are estimates based on information published on OTAs and similar channels at the time of the survey (September 10, 2026), and will change as check-in approaches. Because inventory can change during the day due to property-side actions, properties that appear far ahead now will not necessarily sell out, and properties with availability now may fill up at the last minute.
Related Articles
- Osaka Sep 2026 Holiday: Demand Peaks First 2 Nights, Sep 23 at 58.0%
- Weekday ADR in Tokyo, Nagoya, Osaka & Fukuoka: Business Demand Recovery 2026
References and Sources
- Shibuya City, “Partial Amendment to the Ordinance on Securing a Safe and Secure Environment around Shibuya Station (effective October 2024)” (Japanese)
- DWANGO Co., Ltd., “Ikebukuro Halloween Cosplay Fes 2026 to Be Held for Three Days, October 30–November 1” (August 2026, Japanese)
- Ikebukuro Halloween Cosplay Fes 2026 official website (Japanese)
- Tokyo Shimbun, “Not Just Halloween: Shibuya Bans Nighttime Street Drinking Year-Round as Ordinance Amendment Passes, Effective October” (Japanese)
- Japan Tourism Agency, “Overnight Travel Statistics Survey” (Japanese)
- MetroEngines Research — rooms-remaining trends (7 wards, 248 properties / 35,167 rooms covered), listed prices, estimated settled ADR
■ Data Sources
Rooms-remaining rates and booking pace are tallied from listed inventory as of September 10, 2026 for properties in the seven wards (Shibuya, Toshima and Shinjuku in Tokyo; Chuo and Kita in Osaka City; Naka in Nagoya City; Chuo in Fukuoka City) that list at least 30% of their total rooms on OTAs (248 properties / 35,167 rooms covered out of 2,865 properties in scope). Occupancy (OTA-listed inventory basis, estimated) curves use only observations within a 45-day lead time. Listed prices are the median of the all-plan average per-room price (2 guests per room, tax included); estimated settled ADR is the monthly median by ward. All data from MetroEngines Research.
■ Estimation Assumptions
Estimated settled ADR is an estimate (tax-excluded equivalent) calculated by applying a property-type adjustment factor to each property’s lowest published plan level; checked against property-level results disclosed by listed hotel REITs (91 properties, most recent 3 months), the median error is about 7%. YoY figures compare October 2025 and October 2026 using the same aggregation method; because the number of properties (N) varies by month, it is shown alongside each figure. As October 31 was more than 45 days out at the time of writing, it is excluded from area-level booking-curve comparisons and its booking pace is assessed only with the property-level rooms-remaining snapshot.
■ Limitations
(1) The rooms-remaining rate is based on inventory listed on OTAs and does not match a property’s actual overall occupancy. Channel strategies centered on direct and corporate sales, or gradual release of inventory, leave false positives that make booking pace look more advanced than it is (limiting the sample to properties with at least 30% of rooms on OTAs mitigates but cannot eliminate this). (2) Rooms-remaining rates, listed prices and estimated settled ADR for future dates are snapshots at the time of the survey and will change as the stay date approaches. (3) In wards with a single-digit number of covered properties (Osaka’s Kita Ward, 9 properties), the median is easily swayed by individual properties. (4) Regulations and event schedules are based on materials published by the relevant municipalities and organizers, as of September 10, 2026.