

When you screen land in mountain areas, on remote islands or in hot-spring towns, some projects die before the feasibility discussion even starts: the site has no public water main. On land outside a water-supply service area, however cheap the land and however fine the view, you cannot fix the room count or the construction schedule until you decide where the water will come from. And the choice of water source is also the entry point to a separate body of regulation, the Waterworks Act. This article looks at the water-source decision for sites without a mains connection on three levels: regulation, geography and cost.
HotelBank’s water series has so far compared costs on the assumption that a public water main reaches the site. An earlier article covered the one-off contribution charged for connecting to the mains (up to ¥5.11M apart between municipalities), and Hotel Water & Sewer Costs Vary 2.1x by Municipality covered the volume-based charges paid after connection. This article steps back to the question that comes first: does a water main reach the site at all, and if not, what do you build? It is the first layer of site screening, and it has to be settled before any line item of the business plan.
Note that drilling for hot-spring water requires a prefectural governor’s permit under Article 3 of the Hot Springs Act, while drinking-water supply falls under the Waterworks Act. Both involve “drilling”, but the governing law, the permitting authority and the review criteria all differ. Drilling a hot-spring well does not give you drinking water, and a drinking-water well cannot be labelled or used as a hot spring without going through the Hot Springs Act. This article deals only with the Waterworks Act side.
Terms and Metric Definitions Used in This Article
- Private waterworks (専用水道, sen’yo suido): under Article 3(6) of the Waterworks Act, a waterworks for private use that supplies water needed for daily living to more than 100 people, or whose facilities have a maximum daily supply exceeding 20 cubic meters. Even when the only source is water received from another waterworks, it qualifies if the total length of conduits with a bore of 25 mm or more exceeds 1,500 m, or the combined effective capacity of its tanks exceeds 100 cubic meters.
- Simplified private waterworks (簡易専用水道): a system whose only source is water supplied by a water utility and whose receiving tanks have a combined effective capacity exceeding 10 cubic meters.
- Mountain / low-density location: a location category defined for this article — a property with fewer than 500 residents within a 1 km radius and an elevation of 300 m or more. It does not directly determine whether a site is inside or outside a water-supply service area; it is a proxy for the terrain and population conditions under which water mains are rarely laid.
- ADR (Average Daily Rate): an estimated contracted rate (tax-exclusive equivalent), calculated by applying segment-specific adjustment factors to the lowest-priced plan level each property publishes on OTAs and elsewhere (per room, 2 guests, tax-inclusive). Checked against property-level results disclosed by listed hotel REITs (91 properties, most recent 3 months), the median error is about 7%. These are estimates and differ from each property’s actual contracted rates and accounting figures. Area-level ADR is the median across the properties covered (the level of a typical property in the area).
- Data sources: Ministry of Land, Infrastructure, Transport and Tourism (MLIT), “FY2024 Population Served and Water Supply Coverage”; MLIT National Land Numerical Information (future population estimates by 250 m mesh); Geospatial Information Authority of Japan (GSI) Elevation API; MetroEngines Research & Consulting
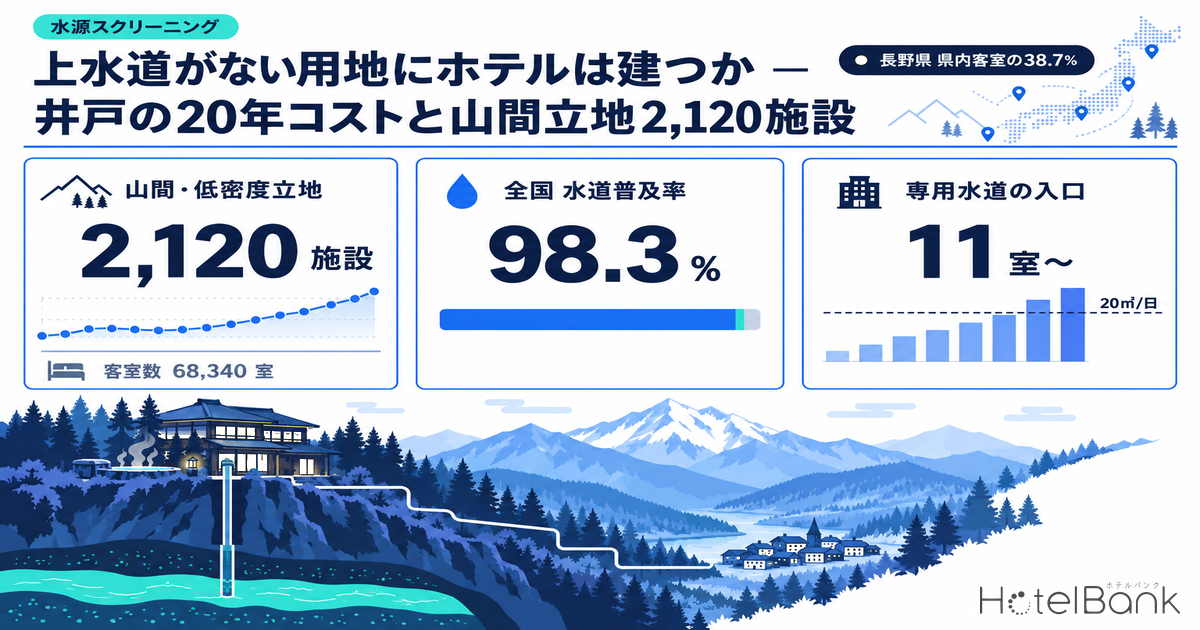
- Japan’s water supply coverage is 98.3%, yet 2.11 million people are still not served by it. Another 1.52 million get their water from small-scale municipal systems and 360,000 from private waterworks rather than from the main public supply (end of FY2024).
- Of the 18,105 operating accommodation properties (10+ rooms, 1.22 million rooms) tracked by MetroEngines Research, 2,120 properties and 68,340 rooms are in mountain / low-density locations. Nagano alone has 500 properties and 15,693 rooms, 38.7% of the prefecture’s room stock.
- A hotel running on its own water source becomes a private waterworks from 11 rooms using the design unit for supply equipment (2.0 m³ per hotel room per day), or from 16 rooms based on actual use at full occupancy. Of the mountain / low-density properties, 86.6% have 11+ rooms and 58.1% have 16+ rooms.
- A 150 m deep well with treatment and disinfection costs ¥11.35M–¥13.6M upfront for 20 rooms. Per room, that is ¥568k–¥680k at 20 rooms versus ¥208k–¥230k at 100 rooms, a gap of nearly 3x. 54% of the qualifying properties have 10–19 rooms, the size band where economies of scale help least.
- Over 20 years, a private water source is cheaper because there are no volume charges. For 100 rooms with a 1 km connection, the private source costs ¥62.51M–¥68.73M against ¥272.54M–¥475.82M for a mains connection. Owning your water source is not a cost; it is a choice to take on the risk yourself in exchange for turning a variable cost into a fixed one.
Regulation — Once the Water Source Is Your Own, the Property Starts to Look Like a Water Utility
The moment you decide to drill a well or draw spring or stream water on a site without mains water, the property becomes subject to the Waterworks Act. Discovering this late in the business plan leads straight to a redone confirmation application and a delayed schedule. It is worth getting the categories right first.
Article 3(6) of the Waterworks Act defines a private waterworks as a waterworks other than one used for a water utility business, such as a private system at a dormitory, company housing or sanatorium, that either (1) supplies water needed for daily living to more than 100 people, or (2) has facilities whose maximum daily supply exceeds the threshold set by Cabinet Order (20 cubic meters). For accommodation, hotel guests are normally not treated as “residents”, so in practice the test that matters is (2), the 20-cubic-meter maximum daily supply.
If, on the other hand, the property connects to the mains and simply installs a receiving tank, it is a simplified private waterworks. That status depends on whether the tanks’ combined effective capacity exceeds 10 cubic meters, and the obligations are far lighter than for a private waterworks. The same “hotel water system” moves up a regulatory tier depending on whether the water source is your own.
| Item | Private waterworks | Simplified private waterworks | Drinking-water well (small scale) |
|---|---|---|---|
| Typical case | Supplied from own source (well, spring) | Mains water + receiving tank | No mains, small scale |
| Threshold | More than 101 people served, or maximum daily supply above 20 m³ | Combined effective tank capacity above 10 m³ | Below both thresholds |
| Pre-construction procedure | Confirmation application under Article 32 of the Waterworks Act (confirming the design meets facility standards) | Installation notification, etc. (varies by municipality) | Notification, etc. under local guidelines |
| Water quality testing | At least daily (color, turbidity, residual chlorine) / at least monthly (9 basic items) / all items every 3 months | Annual statutory inspection (by a registered inspection body) | Periodic testing under hygiene guidelines |
| Waterworks technical manager | Must be appointed (1 person) | Not required | Not required |
| PFOS / PFOA | Added as water quality standard items by the amendment effective April 2026 (combined 50 ng/L). Private waterworks and small-scale municipal systems must, as a rule, test once every 3 months | Also added to periodic test items under hygiene guidelines | |
In practice, the burden comes down to three things. The first is the pre-construction confirmation application. Article 32 of the Waterworks Act requires anyone who plans to build a private waterworks to obtain, in advance, the prefectural governor’s confirmation that the design meets the facility standards in Article 5. Preparing the design documents and waiting for the review have to be built into the schedule, and this runs on a separate track from building confirmation. It is easy to overlook that the same procedure applies when expanding or modifying an existing facility.
The second is ongoing water quality testing. The three-tier regime — color, turbidity and residual chlorine at least daily, the 9 basic items at least monthly, and all items every 3 months — effectively asks a hotel to operate like a small water utility. On top of that, the water quality standards amendment that took effect in April 2026 added PFOS and PFOA as standard items (combined value 50 ng/L), and private waterworks and small-scale municipal systems are now, as a rule, required to test for them once every 3 months. Items that used to be measured voluntarily against provisional target values are now mandatory. For anyone screening sites in 2026, this is a running cost that has only just been added.
The third is appointing a waterworks technical manager. A private waterworks must have one waterworks technical manager to handle the technical side of water management. At a small property, the choice is between having the general manager or facilities staff meet the qualification requirements and take on the role, or outsourcing it.
To prevent land subsidence from excessive groundwater extraction, 17 areas in 10 prefectures are designated under the Industrial Water Act and the Act on Regulation of Groundwater Extraction for Buildings (the Building Water Act). Inside these areas, pumping groundwater with a new pump whose discharge outlet has a cross-section larger than 6 square centimeters requires the governor’s permission. Many prefectures and municipalities also have their own restrictions by ordinance. In site screening, the right order is to check first whether you can drill at all; estimating drilling costs comes after that.
Geography — A “Market With Different Infrastructure Assumptions” of 2,120 Properties and 68,000 Rooms
With the rules in place, the next question is where such sites actually are and how many there are. Start with the national statistics. According to MLIT’s basic waterworks statistics, national water supply coverage at the end of FY2024 (as of March 31, 2025) was 98.3%, with 121.50 million people served. That breaks down into 119.63 million served by the main public supply, 1.52 million by small-scale municipal systems and 360,000 by private waterworks. Put the other way round, 2.11 million people out of a total population of 123.61 million are not served by any waterworks.
The differences between prefectures are significant. Coverage is lowest in Kumamoto at 89.8%, followed by Akita at 92.1%, Oita at 92.4%, Toyama at 93.9% and Ehime at 94.0%. Tokyo, Aichi, Osaka, Nara and Okinawa are at 100.0%. Kumamoto is known for its heavy reliance on groundwater, and sources other than the public supply are well established there for household use. Low coverage does not automatically mean an area is “behind”. Some areas show these figures because abundant high-quality groundwater makes laying water mains less necessary.
Service area boundaries are published individually by each water utility (in principle, each municipality), and no public dataset allows property-level matching across the whole country. The “mountain / low-density location” used here is a proxy defined by two conditions, fewer than 500 residents within a 1 km radius and an elevation of 300 m or more, and does not show that any individual property is outside a service area. Because water mains follow settlements, the thinner the nearby population and the higher the elevation, the more likely a site is at the edge of or outside a service area; the proxy goes no further than that. Filtering on resident population alone would pull in many sites with few residents but full mains water, such as areas around airports or large resorts on reclaimed land. That is why the elevation condition is added.
Remote islands are not captured by the elevation condition and are therefore not included. Their water supply involves separate issues such as desalination and undersea pipelines, which we hope to cover in a separate article.
On that basis, we analyzed location conditions for a population of 18,105 properties and 1,221,815 rooms — operating accommodation properties tracked by MetroEngines Research with 10 or more rooms and known coordinates. 2,120 properties (11.7%) and 68,340 rooms (5.6%) fell into the mountain / low-density category. The group’s medians are 18 rooms, an elevation of 761 m and 147 residents within 1 km. The comparison group (the remaining 15,984 properties) has medians of 37 rooms, 17 m and 8,181 residents — clearly a completely different set of market conditions.
The distribution is extremely uneven. Nagano stands out with 500 properties and 15,693 rooms, 38.7% of its room stock. Its median elevation is 1,025 m, a direct reflection of how mountain resorts at around 1,000 m — Shiga Kogen, Hakuba, Yatsugatake, Kamikochi — form the core of the prefecture’s accommodation supply. Next come Niigata with 5,925 rooms, Gunma with 5,538, Fukushima with 5,080 and Hokkaido with 4,970. By share of prefectural room stock, the order is Nagano 38.7%, Gunma 29.1%, Niigata 22.1%, Yamanashi 21.9% and Fukushima 21.7% — all prefectures whose main tourism assets are hot springs and ski resorts.
Overlaying water supply coverage reveals two different patterns. Kumamoto (89.8% coverage), Oita (92.4%), Iwate (94.7%) and Gifu (95.0%) are prefectures where sources other than the public supply are common across the board, with large populations served by small-scale municipal systems and private waterworks. Nagano (99.0%), Gunma (99.6%) and Niigata (99.5%), by contrast, have high coverage but some of the largest populations served by small-scale municipal systems in the country: 82,001 people in Nagano, 78,826 in Niigata, 64,279 in Gunma and 68,301 in Yamanashi. In these prefectures, small-scale systems have historically covered mountain villages across wide areas, and many accommodation properties are probably connected to them. The situation is not “no water main” but “a water system other than the main public supply”, so land due diligence must always confirm whether the connection is to the main public supply or to a small-scale system. Small-scale systems operate at a small scale and are more exposed to consolidation and tariff revisions.
| Prefecture | Population (10+ rooms) | Mountain / low-density locations | Water infrastructure (FY2024) | |||||||
|---|---|---|---|---|---|---|---|---|---|---|
| Properties | Rooms | Properties | Rooms | Share of pref. rooms | Median elev. | Est. ADR | Coverage | Pop. served by small-scale systems | Pop. served by private waterworks | |
| Nagano | 1,154 | 40,569 | 500 | 15,693 | 38.7% | 1025m | ¥13,998 | 99.0% | 82,001 | 1,515 |
| Niigata | 577 | 26,863 | 170 | 5,925 | 22.1% | 745m | ¥14,150 | 99.5% | 78,826 | 2,632 |
| Gunma | 444 | 19,010 | 193 | 5,538 | 29.1% | 832m | ¥13,973 | 99.6% | 64,279 | 1,906 |
| Fukushima | 420 | 23,439 | 134 | 5,080 | 21.7% | 580m | ¥14,325 | 94.3% | 51,290 | 4,468 |
| Hokkaido | 1,012 | 80,821 | 65 | 4,970 | 6.1% | 442m | ¥16,120 | 98.4% | 280,280 | 14,984 |
| Tochigi | 371 | 19,213 | 131 | 3,868 | 20.1% | 738m | ¥17,198 | 96.1% | 3,482 | 17,937 |
| Yamanashi | 380 | 14,869 | 102 | 3,254 | 21.9% | 923m | ¥14,924 | 98.7% | 68,301 | 4,854 |
| Gifu | 362 | 16,211 | 112 | 2,511 | 15.5% | 905m | ¥18,889 | 95.0% | 49,398 | 3,851 |
| Iwate | 274 | 15,807 | 50 | 2,133 | 13.5% | 498m | ¥10,496 | 94.7% | 15,744 | 5,617 |
| Kumamoto | 321 | 17,455 | 61 | 1,707 | 9.8% | 666m | ¥27,832 | 89.8% | 65,494 | 16,676 |
| Yamagata | 320 | 13,442 | 71 | 1,608 | 12.0% | 865m | ¥14,498 | 99.1% | 18,419 | 181 |
| Kanagawa | 548 | 41,807 | 48 | 1,534 | 3.7% | 746m | ¥21,197 | 99.9% | 11,392 | 5,366 |
| Hyogo | 573 | 34,124 | 67 | 1,396 | 4.1% | 565m | ¥10,368 | 99.9% | 16,674 | 2,257 |
| Oita | 338 | 16,417 | 54 | 1,241 | 7.6% | 656m | ¥16,682 | 92.4% | 13,966 | 7,697 |
| Aomori | 204 | 14,205 | 20 | 1,110 | 7.8% | 457m | ¥13,991 | 98.3% | 24,414 | 4,254 |
The estimated ADR column is worth a closer look. The median estimated contracted ADR for mountain / low-density locations is ¥14,900, well above ¥9,000 for the comparison group. The group is dominated by ryokan and resort hotels, where high-priced packages with meals are the main product. The less favorable the infrastructure assumptions, the higher the rate — the relationship is visible here. This is not a coincidence: being deep enough in the mountains that the mains do not reach is itself the source of scarcity value — scenery, quiet, hot springs — and that matters for the investment decision discussed later.
Slicing by elevation makes the relationship even clearer. In the 0–100 m band, only 8% of properties are in low-density locations, but the share rises to 33% at 100–300 m, 47% at 300–500 m, 49% at 500–800 m, 68% at 800–1,200 m and 96% at 1,200 m and above. Of the 325 properties and 11,084 rooms above 1,200 m, 311 properties and 10,559 rooms have fewer than 500 residents within 1 km. In other words, virtually all high-altitude accommodation supply sits away from settlements. Japan’s mountain resorts, one could say, are an industry built on conditions where public water mains are hard to extend.
On the map, the distribution stretches in bands along the Chubu highlands, the mountains of northern Kanto, the Ou Mountains running down the spine of Tohoku, and inland Hokkaido. The points near the coast are hot-spring towns on high ground or basins between mountains; almost none appear on the plains. The cost of laying water mains scales with the inverse of population density — an obvious structure that shows up directly on the map of accommodation supply.
Scale — How Many Rooms Make a “Private Waterworks”?
Next, we work backward from water volume to find the size at which a property with its own water source becomes subject to the private waterworks rules. The threshold is a maximum daily supply of 20 cubic meters.
There are two ways to set the unit water consumption. One is the maximum daily use used to design water supply equipment: public waterworks design standards set it at 2.0 cubic meters per day per hotel room and 1.0 cubic meter per day per business hotel room. On this design unit, a full-service hotel exceeds 20 cubic meters at 11 rooms and a business hotel at 21 rooms.
The other is building up from actual use. The Japan Association of Tourism Facilities reported, from a survey of about 100 properties nationwide, water use of 630 liters per guest (the average for a sample that includes many ryokan with large communal baths). At 2 guests per room and full occupancy, that is 1.26 cubic meters per room per day, which exceeds 20 cubic meters at 16 rooms. On an average day at an assumed 70% occupancy, it works out to 0.88 cubic meters per room per day, equivalent to 23 rooms. Because the test is based on maximum daily supply, it is applied on peak days, so in practice 16 rooms is a reasonable rule of thumb. Room count acting directly as a regulatory threshold is not unique to water; under the Fire Service Act, for example, sprinklers become mandatory at a total floor area of 6,000 m², which works out to roughly 103–240 hotel rooms.
Of the 2,120 properties identified in this article, 1,835 properties and 65,490 rooms (86.6%) have 11 or more rooms, and 1,232 properties and 57,702 rooms (58.1%) have 16 or more. If they ran on their own water source, virtually all of them would be private waterworks, with a confirmation application, monthly water quality testing and a waterworks technical manager. Including smaller properties with fewer than 10 rooms would widen the base further. The assumption that “a small inn only needs simple paperwork” stops holding the moment the water source is your own.
Capex Estimate — A 150 m Deep Well Costs ¥11.35M for 20 Rooms and ¥20.75M for 100 Rooms
Now to the costs. Given the nature of the estimate, please read it with all assumptions disclosed. Well drilling and pumps can use published price ranges, but treatment and disinfection equipment, receiving tanks and the preparation of design and confirmation application documents vary widely with scale, water quality and terrain, and have no published market prices. Those items are values set by this article; real projects always need individual quotes.
| Item | Value | Basis / nature |
|---|---|---|
| Property type | Ryokan / resort with a large communal bath | The main property types in mountain / low-density locations (1,115 ryokan + 273 resort hotels account for 77% of rooms) |
| Water use per guest | 630 liters per guest-night | Figure reported by the Japan Association of Tourism Facilities from a survey of about 100 properties nationwide |
| Occupancy / guests | Occupancy (assumed) 70%, 2 guests per room | Value set by this article |
| Well depth / bore | 150 m, bore equivalent to 150 mm | Value set by this article (assumes stable extraction in mountain areas) |
| Drilling unit cost | ¥45,000–¥60,000 per m | Based on published ranges: ¥30,000–¥40,000 per m for a deep well with a 100 mm finished bore, about 1.5x for 150 mm |
| Submersible pump / control panel | ¥0.6M / ¥1.2M / ¥2.0M (20 / 50 / 100 rooms) | Scaled within the published range of ¥0.6M to over ¥2.0M depending on pumping capacity |
| Receiving tank, iron/manganese removal, filtration, disinfection, design / application documents | ¥4M / ¥7M / ¥12M (20 / 50 / 100 rooms) | No published market price, so these are values set by this article. Subject to sensitivity analysis |
| Water quality testing (annual) | ¥591,000 | Full 52-item test ¥99,000 × 4 + monthly 9-item test ¥12,000 × 8 + full test of raw water × 1. The full-test price is a published price; the 9-item price is a value set by this article |
| Waterworks technical manager | ¥300,000 per year | Value set by this article, assuming a combined role with partial outsourcing |
| Pumping electricity | 160 m pumping head, 55% pump efficiency, ¥27/kWh | Value set by this article |
| Water and sewer charges (connection case) | ¥400–¥700 per m³ | Set by this article at a level consistent with our earlier 7-municipality comparison (¥6.99M–¥14.85M per year for a 100-room model) |
| Connection contribution (75 mm bore) | ¥0–¥5,115,000 | Actual range confirmed in our earlier article, from ¥0 in Tokyo’s 23 wards to ¥5,115,000 in Yokohama |
| Service pipe connection work | ¥15,000–¥20,000 per m | Published unit price for service pipe connection. Laying distribution mains costs more, so this is treated as a lower bound |
On these assumptions, annual water use is 6,439 cubic meters for 20 rooms (25.2 cubic meters on a full day), 16,096 cubic meters for 50 rooms (63.0 on a full day) and 32,193 cubic meters for 100 rooms (126.0 on a full day). All of them exceed the 20-cubic-meter maximum daily supply.
| Item | 20 rooms | 50 rooms | 100 rooms |
|---|---|---|---|
| Drilling (150 m × ¥45,000–¥60,000 per m) | ¥6.75M–¥9.0M | ¥6.75M–¥9.0M | ¥6.75M–¥9.0M |
| Submersible pump / control panel | ¥0.6M | ¥1.2M | ¥2.0M |
| Receiving tank, treatment, disinfection, design / application | ¥4.0M | ¥7.0M | ¥12.0M |
| Total initial cost | ¥11.35M–¥13.6M | ¥14.95M–¥17.2M | ¥20.75M–¥23.0M |
| Initial cost per room | ¥568k–¥680k | ¥299k–¥344k | ¥208k–¥230k |
| Water quality testing | ¥591k | ¥591k | ¥591k |
| Waterworks technical manager | ¥300k | ¥300k | ¥300k |
| Pumping electricity | ¥138k (5,104 kWh) | ¥345k (12,760 kWh) | ¥689k (25,520 kWh) |
| Maintenance (filter media replacement, inspection; 1.5–2.0% of initial cost) | ¥170k–¥270k | ¥220k–¥340k | ¥310k–¥460k |
| Chemicals (sodium hypochlorite etc., ¥3 per m³) | ¥19k | ¥48k | ¥97k |
| Total annual cost | ¥1.22M–¥1.32M | ¥1.51M–¥1.63M | ¥1.99M–¥2.14M |
Initial cost per room is ¥568k–¥680k at 20 rooms and ¥208k–¥230k at 100 rooms, a gap of nearly 3x, because drilling one well is a fixed cost largely independent of size (Figure 3). Herein lies the structural difficulty. Of the 2,120 mountain / low-density properties, 1,144 (54%) have 10–19 rooms, so supply is concentrated in the band where economies of scale help least. Moreover, estimated ADR by size band is almost flat — ¥15,200 for 10–19 rooms and ¥16,000 for 100+ rooms — so smaller properties do not command higher rates. The per-room burden of the water source weighs most heavily on small properties.
Over 20 years, the ranking reverses. For 100 rooms with a 1 km connection, the private source costs ¥62.51M–¥68.73M, while the mains connection costs ¥272.54M–¥475.82M. For 50 rooms it is ¥46.31M–¥51.56M for the private source against ¥143.77M–¥250.47M for the mains; for 20 rooms, ¥36.32M–¥40.9M against ¥66.51M–¥115.26M.
The reason is simple: a private water source has no volume charges. Mains water is billed by use, so costs rise in proportion as occupancy and guest numbers grow. A private source replaces that with an upfront investment and largely fixed annual costs for testing, the technical manager and maintenance. Only pumping electricity varies with volume, and even at 100 rooms it is ¥689k a year, about a third of the total.
Per occupied room-night, the picture is easier to grasp. Dividing by 20 years of occupied room-nights at an assumed 70% occupancy, the private source costs ¥122–¥135 at 100 rooms, ¥181–¥202 at 50 rooms and ¥355–¥400 at 20 rooms. A mains connection (1 km) costs ¥533–¥931 at 100 rooms, ¥563–¥980 at 50 rooms and ¥651–¥1,128 at 20 rooms. Against the median estimated ADR of ¥14,900 for mountain / low-density locations, the private source accounts for 0.8–0.9% at 100 rooms and only 2.4–2.7% even at 20 rooms.
| Scenario | 20 rooms | 50 rooms | 100 rooms |
|---|---|---|---|
| Pessimistic (unfavorable to private source) Private source = high end, mains = low end | ¥25.61M | ¥92.21M | ¥203.81M |
| Base Both at the midpoint of the assumed ranges | ¥52.27M | ¥148.18M | ¥308.56M |
| Optimistic (favorable to private source) Private source = low end, mains = high end | ¥78.94M | ¥204.16M | ¥413.31M |
The sign does not change in any of the three scenarios. Even in the combination least favorable to the private source (private source at the high end, mains at the low end), a gap of ¥25.61M remains at 20 rooms and ¥203.81M at 100 rooms. Over a 20-year horizon, the conclusion of this comparison holds up against the range of assumptions. That said, it assumes a 1 km connection; for a site next to a water main, the upfront cost on the mains side falls sharply, so the robustness of the conclusion does not carry over as is.
| Rooms | ¥200/m³ | ¥300/m³ | ¥400/m³ | ¥550/m³ | ¥700/m³ |
|---|---|---|---|---|---|
| 20 rooms Annual use 6,439 m³ | ¥7.2M | ¥20.08M | ¥32.96M | ¥52.27M | ¥71.59M |
| 50 rooms Annual use 16,096 m³ | ¥35.5M | ¥67.7M | ¥99.89M | ¥148.18M | ¥196.46M |
| 100 rooms Annual use 32,193 m³ | ¥83.21M | ¥147.59M | ¥211.98M | ¥308.56M | ¥405.14M |
Even at a rate as low as ¥200 per m³, the private source is cheaper in all 15 cells. The reversal comes not from the rate but from a lower upfront cost on the mains side — that is, from a site next to a water main. Under the Table 3 base assumptions, once the connection distance falls below about 1.1 km for 100 rooms, about 0.8 km for 50 rooms and about 0.6 km for 20 rooms, the upfront cost of a mains connection drops below that of a private source, and from there the length of the holding period decides. In site screening, check the distance to the main before worrying about rate differences.
The 1 km connection distance in the mains case assumes a site 1 km beyond the edge of the service area. Where a distribution main actually has to be extended, many municipalities have rules making the developer pay a substantial share of the cost. Gifu City’s rules on the allocation of waterworks construction costs, for example, state that when a developer applies for distribution mains as part of a development, the applicant bears the cost of the connecting pipe from the existing main to the development area, the work inside the development area and water source development. The ¥15,000–¥20,000 per m used here is the unit price for a service pipe connection; laying a main costs more. The mains-side figures are therefore estimates at the low end, and the real gap could be even larger.
This estimate is also undiscounted. The private source’s cash flow is concentrated upfront while mains charges accrue evenly, so the time value of money affects them differently; for investment decisions, please recalculate with a DCF.
Risk — The Savings Come From Carrying the Risk Yourself
Over 20 years, a private water source is cheaper. But the difference is the price of taking on risks that a water utility would otherwise carry. Reading it as a pure cost difference leads to the wrong decision.
Quantity risk (drought). According to MLIT, droughts requiring intake restrictions occurred on 21 rivers nationwide in 2023. Droughts are spreading across wider areas regardless of season, and the Japan Water Agency notes that “water supply cuts and suspensions still occur nationwide in recent years, and in parts of Shikoku they have occurred in 8 or more of the last 30 years.” Changing rainfall patterns, with about 9.3 fewer rainy days per year than 100 years ago, are also part of the background. With a private source, a falling water table directly reduces the volume you can draw, feeding through to revenue in the form of restrictions on the communal bath or fewer rooms sold. With mains water, some of an intake restriction is absorbed by the utility’s adjustments; with a private source, there is no buffer.
Quality risk. Private waterworks must check residual chlorine daily and test monthly and every 3 months — which also means that if a test exceeds the standards, use must stop immediately and an alternative supply must be found. One case cited in Ministry of Health, Labour and Welfare materials involved spring water used at a hotel in which enterohemorrhagic E. coli O121 was detected; 37 people were infected and 16 developed mild food poisoning symptoms. Chlorine was normally added, but not on the day of the incident. Chlorine disinfection is not finished once the equipment is installed; the risk materializes the moment daily operation lapses. In addition, from April 2026 PFOS and PFOA were added to the water quality standards (combined 50 ng/L), with testing required every 3 months. PFAS levels in groundwater are hard to predict in advance, and adding treatment equipment after drilling reveals an exceedance is a risk that cannot be priced at the time of land acquisition.
And the flip side — self-sufficiency in a disaster. For all these risks, a private water source has a strength the mains lack. Unlike water pipes buried parallel to the ground, a well drilled vertically is less likely to break in an earthquake. One survey found that 95% of deep wells 30–300 m deep remained usable after the Great East Japan Earthquake. In the 2024 Noto Peninsula Earthquake, damage to water facilities caused prolonged outages, and in some affected areas well and spring water was voluntarily opened up for household use. In response, the Cabinet Secretariat’s Headquarters for Water Cycle Policy and MLIT issued “Guidelines for Groundwater Use in Disasters” in March 2025, recommending registration systems for disaster wells. The ability to keep operating during a water outage, or to serve as a local water point, is a clear asset from a BCP perspective. Known examples include Hotel New Otani (ホテルニューオータニ), which made its disaster-cooperation well drinkable, and Higo Bank (肥後銀行), which installed wells at 10 of its branches in Kumamoto that anyone can use in a disaster under an agreement. Hazard conditions and disaster-prevention Capex can also be quantified as a separate axis of site evaluation.
Investment Decision — Is Your Own Water Source a Cost, or Irreplaceable Backing?
Let us split the analysis so far by holding period. For the same asset, the meaning of a private water source flips depending on how long you expect to hold it.
Short term Hold 3–5 years
A private water source is mainly a cost. An initial investment of ¥11.35M–¥23.0M has to be recovered over a short period, and the volume-charge savings that build up over 20 years are barely realized. The buyer bears the quantity and quality risks of the well, so acquisition due diligence should always check pumping test records, the last 3 years of water quality test results, whether confirmation application documents exist, and whether a waterworks technical manager has been appointed. A deal with incomplete paperwork may carry off-balance-sheet remediation costs.
Medium term Hold 7–10 years
Breakeven comes into view. At 50 rooms or more, the cumulative cost of a private source generally overtakes a mains connection within this period. However, this overlaps with the pump replacement cycle (10–15 years), so in practice it makes sense to deduct a replacement reserve from NOI every period. This is also long enough to be hit at least once by a change in water quality standards; the April 2026 addition of PFOS and PFOA was the latest example.
Long term Hold 20+ years / owner-operators
A private water source becomes backing for the location. A structure with no volume charges becomes relatively more advantageous as occupancy and ADR rise. Moreover, being a location the mains do not reach is itself the source of scarcity value — scenery, quiet, hot springs — and indeed the median estimated ADR for mountain / low-density locations is ¥14,900, well above ¥9,000 for the comparison group. Owning the water source should be read as part of the conditions that create that scarcity.
In practical site screening, sticking to the right order is the most efficient approach. (1) Can you drill? (check whether the site is in a designated groundwater pumping restriction area or covered by an ordinance) → (2) Can you connect? (check whether the site is inside the service area, whether the supply is a small-scale system or the main public supply, the distance to the main and the municipality’s cost-allocation rules) → (3) How many rooms? (above 16 rooms, plan the schedule and organization on the assumption of a private waterworks) → (4) How much? (quotes for drilling and treatment equipment, and a 20-year comparison with the connection case). Working through the questions in this order avoids pushing ahead on land price and scenery alone, only to see the schedule collapse at the confirmation application stage. Before step (2), note that development permits and farmland conversion can add significant lead time, and that forest land has its own development permit requirements.
Finally, a word on the phrase “disadvantaged areas”. A site without mains water is not an “area left behind in development” but a market with different infrastructure assumptions. 68,340 rooms, 5.6% of the country’s accommodation supply, operate under those conditions, and many of them sell at higher rates than properties on the plains. Owning your water source is a choice to take on regulation, testing and equipment renewal in exchange for turning variable costs into fixed costs and gaining the self-sufficiency to keep operating during a water outage. Whether you deduct it as a cost or value it as backing for an irreplaceable location depends on your holding period and operating policy.
Summary
Sites without mains water are not an exception in Japan’s accommodation market. Behind the 98.3% water supply coverage figure, 2.11 million people use water from sources other than the main public supply, and on the supply side, 2,120 properties and 68,340 rooms are in mountain / low-density locations. In Nagano, 38.7% of the prefecture’s rooms are under these conditions.
With your own water source, a property becomes a private waterworks from 16 rooms (11 rooms on the design unit) and must file a confirmation application before construction, test water quality daily, monthly and every 3 months, and appoint a waterworks technical manager. In April 2026, PFOS and PFOA were added to the water quality standards, increasing the testing obligations. Assuming a 150 m deep well, the initial cost is ¥11.35M–¥13.6M for 20 rooms and ¥20.75M–¥23.0M for 100 rooms. Per room the gap is nearly 3x, and 54% of the qualifying properties are concentrated in the 10–19 room band, where economies of scale help least.
Even so, over 20 years a private source is cheaper, because volume charges drop to zero. For 100 rooms with a 1 km connection, the private source costs ¥62.51M–¥68.73M against ¥272.54M–¥475.82M for a mains connection. Those savings are the price of taking on drought and water-quality risk yourself — and also the price of the self-sufficiency to keep operating during a water outage. In site screening, work through the questions in order: can you drill, can you connect, how many rooms, and how much.
Related Articles
- Hotel Water & Sewer Costs Vary 2.1x by Municipality: ¥7.85mn NOI Gap
- Who Owns the Hot Spring? Water Rights and Ryokan Valuation
References and Sources
■ Data sources
Location categories were compiled by attaching, to a master list of 18,105 operating accommodation properties with 10+ rooms (1,221,815 rooms), the resident population within a 1 km radius of each property’s coordinates (National Land Numerical Information, future population estimates by 250 m mesh) and the elevation of each location (GSI Elevation API). Water infrastructure indicators are from MLIT, “FY2024 Population Served and Water Supply Coverage”. Estimated ADR is the median for the valid sample of 11,032 properties in the same master list, August 2025–July 2026. Regulatory requirements are based on the Waterworks Act and prefectural private-waterworks administrative manuals; unit prices and unit consumption figures are from the published materials cited in the text.
■ Estimate assumptions
All assumptions for the Capex estimate are disclosed in Table 3. The main settings are: property type — ryokan / resort with a large communal bath; water use of 630 liters per guest-night; occupancy (assumed) 70% with 2 guests per room; well depth 150 m with a bore equivalent to 150 mm; drilling at ¥45,000–¥60,000 per m; water and sewer rates of ¥400–¥700 per m³; connection contribution of ¥0–¥5,115,000; and service pipe connection work at ¥15,000–¥20,000 per m (1 km connection). The base case in Tables 5 and 6 assumes a contribution of ¥2.555M, a connection unit cost of ¥17,500 per m and a water and sewer rate of ¥550 per m³. All amounts exclude tax and are undiscounted nominal totals.
■ Limitations
“Mountain / low-density location” does not directly determine whether a site is inside or outside a water-supply service area; it is a proxy defined by two conditions, fewer than 500 residents within a 1 km radius and an elevation of 300 m or more. Service area boundaries are published individually by each water utility, and no public dataset allows property-level matching nationwide. Remote islands are not captured by the elevation condition and are not included. Costs for receiving tanks, treatment and disinfection equipment and design / confirmation application documents have no published market price and are values set by this article; real projects need individual quotes. The connection unit cost on the mains side is for service pipes; where distribution mains must be laid, costs are higher, so the mains-side figures lean toward the low end. The estimate is undiscounted; for investment decisions, please recalculate with a DCF. Estimated ADR figures are estimates and differ from each property’s actual contracted rates and accounting figures.
■ Market data
- MetroEngines Research & Consulting — accommodation master list (operating, 10+ rooms, N=18,105 properties / 1,221,815 rooms); estimated contracted ADR (valid sample n=11,032 properties, August 2025–July 2026)
■ Government statistics and public data
- MLIT, “Basic Waterworks Statistics” — FY2024 Population Served and Water Supply Coverage (in Japanese)
- MLIT National Land Numerical Information (future population estimates by 250 m mesh, based on the 2024 estimates of the National Institute of Population and Social Security Research) — resident population around each property
- Geospatial Information Authority of Japan, Elevation API (in Japanese) — elevation of each property
- Waterworks Act (Act No. 177 of 1957) (in Japanese) — Article 3 (definitions), Article 19 (waterworks technical manager), Article 20 (water quality testing), Article 32 (confirmation of construction)
- Kanagawa Prefecture, “Private Waterworks Administrative Manual” (in Japanese)
- Chiba Prefecture, “[Waterworks Act] Confirmation Before Starting Construction of a Private Waterworks” (in Japanese)
- Tokyo Metropolitan Government Bureau of Environment, “Overview of Groundwater Pumping Regulations” (in Japanese) (restrictions under the Industrial Water Act, the Building Water Act and ordinances)
- Ministry of the Environment, “Drilling Permits Under Article 3 of the Hot Springs Act” (in Japanese)
- Kanagawa Prefectural Institute of Public Health, “Revision of Drinking Water Quality Standards: Standards Adding PFOS and PFOA Take Effect in April 2026” (in Japanese)
- MLIT, “Drought Information Portal” / Drought conditions in FY2023 (in Japanese)
- Cabinet Secretariat Headquarters for Water Cycle Policy and MLIT, “Guidelines for Groundwater Use in Disasters” (March 2025) (in Japanese)
- Japan Water Agency, “Current State of Droughts” (in Japanese)
- Ministry of Health, Labour and Welfare, “Ensuring the Hygiene of Drinking-Water Wells and Receiving Tanks” (in Japanese)
- Gifu City, “Rules on the Allocation of Waterworks Construction Costs” (in Japanese)
■ Sources for unit prices and consumption
- Kanko Keizai Shimbun, “Decarbonized Smart Ryokan 1: Why Do Ryokan Use So Much Water?” (Japan Association of Tourism Facilities, Eco Subcommittee) (in Japanese) — 630 liters of water per guest
- Maximum daily water use table for water supply equipment design (in Japanese) — 2.0 m³ per hotel room, 1.0 m³ per business hotel room
- Price range for deep-well drilling (¥30,000–¥40,000 per m for a 100 mm finished bore, about 1.5x for 150 mm) (in Japanese)
- Ichihara Kogyo, “Well Construction Costs: Sample Estimates” (in Japanese)
- Suishitsu Kensa.com, “52 Water Quality Standard Items” test price (¥99,000 incl. tax) (in Japanese)
- Typical cost of service pipe connection work (¥15,000–¥20,000 per m) (in Japanese)