

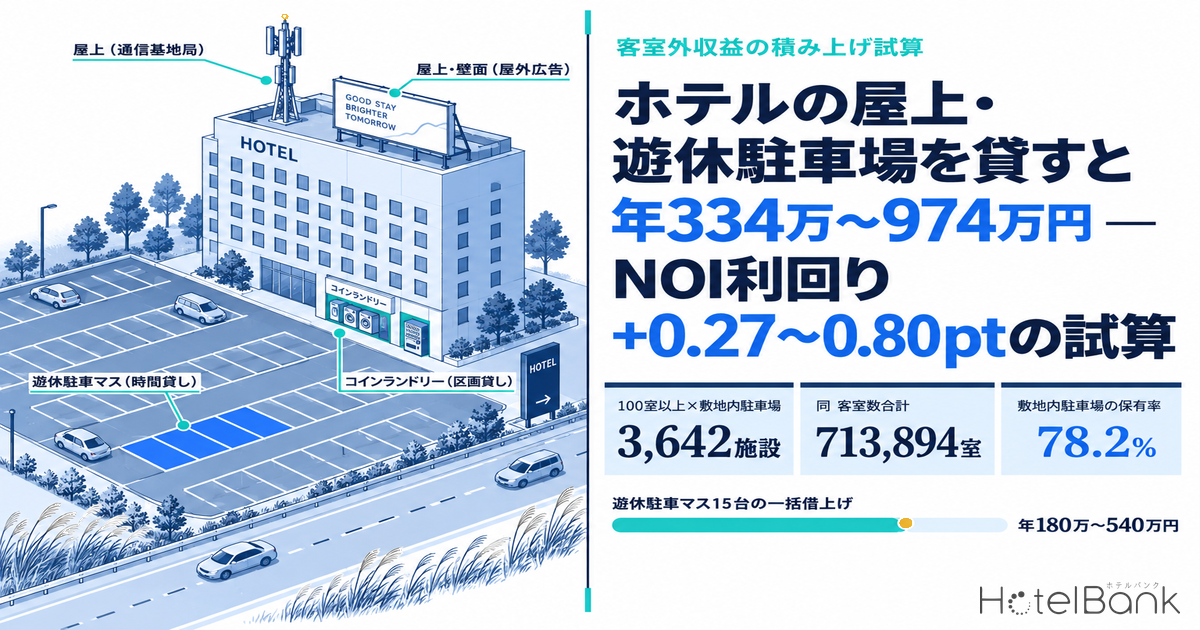
The routes to lifting a hotel’s NOI usually come down to raising ADR, raising occupancy, or squeezing operating costs. Yet every building keeps floor area that is never sold as guest rooms. The roof, the exterior walls, parking bays that empty out during the day, a few square metres beside the lobby — lease these to third parties and the numerator of NOI rises without adding a single room to the denominator. This article builds up, from a property master, catchment data and publicly quoted market ranges, how much income that “floor area you have not yet leased” is worth and how many points it adds to yield.
Metric Definitions Used in This Article
- ADR (average daily rate) = an estimated transacted rate (tax-exclusive equivalent) derived by applying a property-type correction factor to the lowest published plan level each property lists on OTAs and similar channels (two guests per room, per-room price, tax-included). Cross-checked against per-property results disclosed by listed hotel REITs (91 properties, most recent three months), the median error is roughly 7%. These are estimates and differ from each property’s actual transacted prices and accounting figures. Area-level ADR is the median of the properties covered (the level of a typical property in that area).
- OCC (occupancy) = sold rooms as a share of total rooms in the area (an estimate based on OTA sales inventory; consistency checks against monthly REIT disclosures confirm accuracy to within roughly a few points). The OCC used in this article’s models is an assumption.
- Ancillary leasing income = income in the form of rent or installation fees arising from leasing part of the building or site to a third party — not revenue from the lodging business itself such as rooms, food and beverage, or banquets.
- NOI yield contribution (pt) = the incremental NOI left after deducting assumed operating costs from ancillary leasing income, divided by the assumed acquisition price (in percentage points).
- Data sources: MetroEngines Research & Consulting / Ministry of Land, Infrastructure, Transport and Tourism National Land Numerical Information / Ministry of Internal Affairs and Communications and Ministry of Economy, Trade and Industry Economic Census
- — Properties with 100 or more rooms and on-site parking number 3,642 nationwide, with 713,894 rooms. They are only 21.7% of the properties covered, but 61.9% of the rooms — the leasable floor area is concentrated in this band.
- — Stacking five sources — rooftop cell sites, wall advertising, idle parking bays, a laundromat unit and vending machines — gives ¥3.34–9.74 million a year for a 100-room roadside model and ¥1.90–9.00 million for an 80-room urban model.
- — Dividing incremental NOI (80% of the income) by the acquisition price gives +0.27–0.80pt for the roadside model and +0.06–0.28pt for the urban model. Yield points favour the former; absolute value creation (up to ¥180 million) favours the latter — the effect reverses.
- — Whether hourly parking works is decided by the daytime catchment, not by lodging demand. Employment within a 1km radius ranges from 429,309 in Shimbashi to 28,239 in suburban Yokkaichi — more than an order of magnitude — and above 100,000 weekday daytime demand alone can carry it.
- — Four regulatory gates come first: mandatory parking provision, outdoor advertising ordinances, change-of-use approval above 200m², and depreciable asset tax. All are administered differently by each municipality, and because they shape the contract terms, enquiries to the relevant department should run in parallel with design.
Scope — only income from leasing to third parties
Hotel parking has come up on this site from two other angles: the cost side, where mandatory provision ordinances add to the per-room development cost, and the guest-satisfaction side, where parking is valued in some cities and ignored in others. Revenue mix including food, beverage and banquets is a separate subject again.
This article overlaps with none of them. The subject here is income from leasing to a third party. Not parking fees charged to guests, and not F&B revenue from running a restaurant in-house, but the rent received when the roof, the walls, idle parking bays or a few square metres beside the lobby are leased as real estate to a carrier, an advertising company, a parking operator or a laundromat operator. In accounting terms it lands in miscellaneous income or property rental income, and it is close to uncorrelated with swings in lodging demand. That lack of correlation is what makes it worth considering as a post-acquisition value-add measure.
An inventory of the five leasable spaces and their published market ranges
Start by sorting what can be carved out of a hotel building into five leasable spaces. Rates for all of them swing widely with location, area and contract form, so each is shown as a range rather than a single figure. Every range below is quoted from levels published by operators and trade media; none is a quotation for a specific property.
| Leasable space | Market range (per year, owner receipts) | Contract form | Assumptions and caveats |
|---|---|---|---|
| Roof (cell site) |
¥360,000–1.80M (¥30,000–150,000/month per carrier) |
Partial-building lease 10–20 years |
Around ¥100,000 a month is the quoted level for apartment-block roofs in urban areas. It moves with land values, radio-coverage demand, installed area, building height and contract length, and tends toward the lower bound outside the major cities. Where several carriers install equipment, income scales with the number of carriers. |
| Roof and walls (outdoor advertising) |
¥120,000–6.00M (¥10,000–500,000/month) |
Lease for sign installation (annual terms) |
Freestanding and small rental signs typically run ¥10,000–100,000 a month. Large wall displays on arterial roads or in central commercial districts can far exceed that upper bound, while sites with poor visibility do not work at all. Approval under the outdoor advertising ordinance is a prerequisite. |
| Idle parking bays (hourly parking) |
¥120,000–360,000 per bay (¥10,000–30,000/month, regional suburbs) |
Master lease (sublease) |
Master-lease rent is generally 1.5–2x the monthly-contract market level. Quoted levels run ¥10,000–30,000 a month in regional cities and suburban residential areas, ¥20,000–50,000 on urban arterial roads, and around ¥50,000–75,000 near major central stations. |
| Laundromat (tenant lease) |
¥960,000–1.44M (10 tsubo x ¥8,000–12,000/tsubo/month) |
Building lease (operator supplies the machines) |
Laundromats in Tokyo occupy 8–15 tsubo (about 26–50m²) at roughly ¥8,000–12,000 per tsubo per month. The assumption here is that the hotel leases only the unit and does not own the machines. This must be kept separate, in accounting and in operation, from in-house laundry facilities provided for guests. |
| Vending machines and parcel lockers |
¥100,000–600,000 | Installation agreement (revenue share or fixed fee) |
Varies with who pays for electricity, the commission rate and the number of units. The busier the central-city lobby, the larger the take on a revenue-share basis. |
Of the five, outdoor advertising and hourly parking swing the most in order of magnitude. The former rests almost entirely on visibility: in the same building, a change in which road it faces can decide whether the deal works at all. The latter multiplies by the number of bays, so it stacks up fastest at suburban properties with large car parks. Cell sites, laundromats and vending machines, by contrast, vary relatively little by location, and the lower bound is achievable at almost any property.
Which properties still have space to lease — 3,642 with 100+ rooms and on-site parking
Whether leasable space exists can first be measured through parking. From the MetroEngines Research & Consulting property master, we extracted operating properties with a known room count across six types — ryokan, resort, business, city, deluxe and capsule (N=16,804 properties, 1,154,165 rooms) — and tabulated on-site parking by room-count band. The overall share with parking is 78.2%, and it rises with size: 62.9% below 20 rooms, reaching 96.2% at 200 rooms and above.
The territory this article is concerned with sits on the right of that distribution. Properties with 100 or more rooms and on-site parking number 3,642 nationwide with 713,894 rooms — only 21.7% of the 16,804 properties covered, but 61.9% of the 1,154,165 rooms. Hourly parking, where bay count multiplies; a laundromat unit, which needs floor area; and the building height that earns visibility are all concentrated in this band.
| Prefecture | 100+ rooms with on-site parking | Rooms | Character of the locations |
|---|---|---|---|
| Tokyo | 524 | 118,009 | Top rates for wall advertising and cell sites. Leasing parking bays externally requires ordinance checks first |
| Osaka | 281 | 66,354 | Central-city advertising demand mixed with roadside stock on the periphery |
| Hokkaido | 256 | 53,223 | Generous site areas and large bay counts. Winter operating conditions need checking |
| Aichi | 170 | 33,811 | A deep stock of car-oriented locations along arterial roads |
| Fukuoka | 165 | 34,250 | Strong central hourly-parking demand, so idle bays command higher rates |
| Shizuoka | 135 | 20,818 | Mostly car-borne guests from a wide catchment; many stretches where signage visibility pays |
| Kanagawa | 132 | 26,063 | A two-layer structure of central-adjacent and suburban roadside |
| Okinawa | 116 | 25,566 | High rental-car usage, so guest parking demand is strong at the same time |
| Chiba | 112 | 31,349 | Many large car parks around the airport and the bay area |
| Hyogo | 106 | 19,976 | Stock dispersed in the band between central city and tourist destinations |
Reading the catchment for hourly parking — 28,239 to 429,309 employees within 1km
Whether idle bays can be turned over to hourly parking is decided by daytime demand in the surrounding area, not by lodging demand. From the 10:00 checkout to the 15:00 check-in, a hotel car park is close to empty for five hours. Filling those hours for a fee requires nearby commuting, business or shopping car demand. We therefore tabulated establishments and employees within a 1km radius for six representative catchments from the Economic Census.
The gap is more than tenfold. The 1km radius around Shimbashi (near Minato-ku, Tokyo) holds 16,478 establishments and 429,309 employees, of which office-sector work accounts for 39.3%. Fushimi in Nagoya follows with 14,140 establishments and 263,919 employees, then the area in front of Sendai Station with 8,451 and 139,779, central Kumamoto with 4,469 and 51,810, and suburban Yokkaichi with 2,338 and 28,239. The office share differs too — 39.3% at Shimbashi against 20.0% in suburban Yokkaichi — so the character of demand is not the same.
The operational split that follows is clear. Where employment exceeds 100,000, in central Tokyo and the major prefectural capitals, weekday daytime hourly parking stands on its own. Where employment is in the tens of thousands, at suburban roadside properties, a design that combines nearby residents’ monthly contracts and weekend demand from retail facilities fills the bays more reliably than relying on weekday daytime alone. Note that Economic Census small-area tabulations are not available for every location, even in built-up areas, and where coverage cannot be confirmed employment data should not be used as evidence of demand. All six locations here are confirmed as covered.
Viewed on a 250m mesh, resident population within 1.5km of that Yokkaichi catchment was 30,755 in 2020, an estimated 30,261 in 2025 and a projected 27,488 in 2040 — a 10.6% decline from 2020 to 2040. The working-age population is 19,339 (63.9%) and the elderly population 7,999 (26.4%). Because this resident population is the base for evening and weekend hourly-parking demand, looking at the long-term projection alongside it makes the contract-term decision easier when signing a long lease.
Two modelled build-ups — ¥3.34–9.74M for 100 roadside rooms, ¥1.90–9.00M for 80 urban rooms
The ranges and catchment conditions above are now applied to two typical models. Model A is a suburban roadside property with 100 rooms and 50 on-site parking bays; Model B is an urban property with 80 rooms and no on-site parking. Room revenue assumptions use measured estimated transacted ADR: for Model A, the ¥6,900 average for business-hotel properties in Mie Prefecture over the most recent 12 months (September 2025 to August 2026, N=93–96 properties); for Model B, the ¥14,200 average for the same type and period in Tokyo (N=894–924 properties). Occupancy is an assumption — 75% for Model A and 85% for Model B.
| Item | Model A: suburban roadside 100 rooms, 50 bays | Model B: urban 80 rooms, no parking | Assumption |
|---|---|---|---|
| Estimated transacted ADR | ¥6,900 | ¥14,200 | Mie / Tokyo business-hotel type, 12-month average |
| Occupancy (assumed) | 75% | 85% | Model assumption |
| Room revenue (per year) | approx. ¥188M | approx. ¥352M | Rooms x ADR x occupancy x 365 days |
| Assumed acquisition price | approx. ¥980M (¥9.77M per room) | approx. ¥2.61bn (¥32.57M per room) | First and third quartiles of per-room acquisition price among listed hotel REIT holdings in the 80–250 room band (N=180 properties) |
| Breakdown of ancillary leasing income (per year, owner receipts) | |||
| Roof (cell site) | ¥360,000–1.20M | ¥600,000–1.80M | One carrier assumed. Coverage demand is deeper in central cities, so rates are higher |
| Roof and walls (outdoor advertising) | ¥120,000–1.20M | ¥1.20M–6.00M | Central commercial-district walls have high visibility and a much higher ceiling |
| Idle parking bays (hourly) | ¥1.80M–5.40M | — | The 15 of 50 bays that sit empty during the day, on a master lease (¥10,000–30,000 per bay per month) |
| Laundromat (unit lease) | ¥960,000–1.44M | ¥0–600,000 | Securing a unit is harder in central locations, so the lower bound is set at zero |
| Vending machines and parcel lockers | ¥100,000–500,000 | ¥100,000–600,000 | Depends on unit count and commission rate |
| Total ancillary leasing income | ¥3.34M–9.74M | ¥1.90M–9.00M | — |
| As a share of room revenue | 1.8%–5.2% | 0.5%–2.6% | — |
The difference in composition is the difference in strategy. In Model A, hourly parking accounts for 54% of the lower bound and 55% of the upper bound. Simply putting the 15 of 50 bays that empty out during the day on a master lease produces ¥1.80–5.40 million a year. Translated into rooms, that is the same money a 100-room hotel would earn by selling an extra 261 to 783 room-nights a year — equivalent to 0.7–2.2 points of occupancy. There are not many routes to that level of additional revenue without touching ADR.
In Model B, by contrast, outdoor advertising makes up 67% of the upper bound. Central-city walls command a premium on visibility alone, and the upper bound reaches ¥6.00 million a year. But the spread against the lower bound is fivefold, and the outcome turns on traffic volume on the road the building faces, its position relative to neighbouring buildings, and the outdoor advertising ordinance discussed below. For an urban property, the logical order is to have an advertising agency assess the media value of the wall first.
Contribution to NOI and yield — +0.27–0.80pt roadside, +0.06–0.28pt urban
Ancillary leasing income carries almost no cost of sales, but it does bring some burden in contract administration, electricity and reserves for restoration. Here we assume 80% of the income remains as NOI, and divide the incremental NOI by the assumed acquisition price to obtain the yield contribution in points. Value creation, capitalised at a cap rate, is shown alongside — 5.0% for Model A and 4.0% for Model B.
| Item | Model A lower | Model A upper | Model B lower | Model B upper |
|---|---|---|---|---|
| Ancillary leasing income (per year) | ¥3.34M | ¥9.74M | ¥1.90M | ¥9.00M |
| Incremental NOI (income x 80%) | ¥2.67M | ¥7.79M | ¥1.52M | ¥7.20M |
| NOI yield contribution | +0.27pt | +0.80pt | +0.06pt | +0.28pt |
| Value creation (capitalised) | ¥53.4M | ¥155.8M | ¥38.0M | ¥180.0M |
| Value creation per room | ¥530,000 | ¥1.56M | ¥480,000 | ¥2.25M |
There is a structural asymmetry here. Yield points favour the regional roadside model; absolute value favours the urban model. Model A has a small denominator, so ¥7.79 million of incremental NOI shows up as a visible +0.80pt. A deal acquired at a 5.5% yield becomes 6.3% — not a small number to take to an investment committee. Model B, with a ¥2.61 billion denominator, contributes only +0.28pt, but its value creation reaches ¥180 million at the upper bound, above Model A, and ¥2.25 million per room.
Cap-rate sensitivity is worth checking too. Capitalising mid-range incremental NOI (¥5.23 million for Model A, ¥4.36 million for Model B) at 4.0% to 5.5% gives ¥95.1–130.8 million for Model A and ¥79.3–109.0 million for Model B. A 50bp move in the cap rate changes value creation by roughly 10%, so when the exit yield is hard to read, the practical course is to take a conservative view of ancillary leasing income as well.
How far value creation moves with the assumptions is set out below on two axes — the level of ancillary leasing income (conservative / mid / aggressive) and the cap rate (4.0% to 5.5%). For the same property, those two choices alone spread the answer from ¥30.4 million to ¥194.8 million, more than sixfold.
| Assumption | Incremental NOI (per year) | Cap 4.0% | Cap 4.5% | Cap 5.0% | Cap 5.5% |
|---|---|---|---|---|---|
| Model A conservative (lower) | ¥2.67M | ¥66.8M | ¥59.4M | ¥53.4M | ¥48.6M |
| Model A mid | ¥5.23M | ¥130.8M | ¥116.3M | ¥104.6M | ¥95.1M |
| Model A aggressive (upper) | ¥7.79M | ¥194.8M | ¥173.2M | ¥155.8M | ¥141.7M |
| Model B conservative (lower) | ¥1.52M | ¥38.0M | ¥33.8M | ¥30.4M | ¥27.6M |
| Model B mid | ¥4.36M | ¥109.0M | ¥96.9M | ¥87.2M | ¥79.3M |
| Model B aggressive (upper) | ¥7.20M | ¥180.0M | ¥160.0M | ¥144.0M | ¥130.9M |
Four regulatory gates — mandatory parking, advertising ordinances, change of use and tax
Ancillary leasing income does not simply arrive once a contract is signed. Four regulatory gates need checking before execution, and because each municipality administers them differently, any specific deal starts from confirmation with the relevant department and the design professional.
| Gate | What to check | Practical points |
|---|---|---|
| Mandatory parking provision |
Whether bays installed to satisfy a mandatory provision requirement can be turned over to third-party hourly parking. The Tokyo Metropolitan Parking Ordinance contains provisions that relax the required number of spaces for buildings below 6,000m². | Where relaxation removes the requirement for a bay, leasing it externally is in some cases subject to a condition that the parking area be physically separated from the rest and managed separately under the building rules. Whether the mandated bays themselves can be used for external leasing depends on the ordinance and its administration, so the first step is an enquiry to the relevant department. |
| Outdoor advertising ordinance |
Whether the site falls within a prohibited zone or counts as a prohibited structure. In Tokyo, advertising is not to be displayed or installed on rooftop sections 20m or more above ground level within regulated zones. Wall advertising is limited to three-tenths of the wall area in total, and in the 23 wards to 100m² per face inside commercial districts and 50m² outside them. | Permission is required, permits run for a fixed term and must be renewed. Where landscape planning zones or scenic districts overlap, further restrictions apply. Because media size is fixed at the design stage, running discussions with the agency in parallel with confirming the permit requirements is the faster route. |
| Change of use and lodging business law |
Where part of the building is leased to a third-party tenant, a change-of-use confirmation application under the Building Standards Act is required if the total floor area put to the new special-building use exceeds 200m². | The 200m² test applies to the total of the changed-use portion, not the whole building, and existing areas in the same use are aggregated. Even below the threshold requiring an application, compliance with the related provisions is still required separately. Consistency with the scope of structures and facilities under the lodging business licence should be confirmed at the same time. |
| Tax | Parking is subject to consumption tax where “land is used in conjunction with the use of a facility” — for example where the ground is paved with asphalt, where fencing or marked bays are provided, or where vehicles are managed. Income from installing signs and cell sites is in principle also a taxable transaction. | Payment machines, wheel stops, paving, lighting, fencing and similar equipment at a coin parking site are subject to depreciable asset tax. Whether the operator or the hotel bears the installation cost changes who owns the depreciable assets and who carries the tax. Settle this in the cost-allocation clause of the contract up front. |
At exit — how an appraiser reads a property that comes with leases attached
How is ancillary leasing income built up after acquisition valued on sale? Under the income capitalisation approach, gross income generally includes other income such as parking revenue alongside rent and common-area charges. Ancillary leasing income therefore feeds into price in principle. How it feeds in, though, depends on what the contracts say.
Three points are where appraisal views most often diverge. First, remaining contract term. Cell sites are typically on 10–20 year contracts, and the longer the remaining term, the easier the stability of the income is to credit. A sign contract renewed annually, by contrast, has to be assessed on an assumption about renewal. Second, termination clauses. Where the carrier can terminate early at its own convenience, the valuation has to factor in that possibility. Cell sites are sometimes removed as carriers consolidate equipment, so the notice period and restoration-cost clauses are passages every buyer reads. Third, who the income belongs to. Where hotel operations are outsourced under a lease (fixed or variable rent), whether ancillary leasing income accrues to the owner or the operator determines whose NOI it lands in at all. Sorting this out when the management contract comes up for review makes the exit story much simpler to tell.
The practical implication is straightforward. Ancillary leasing income is best positioned as a measure to start immediately after acquisition and stabilise contractually one to two years before sale. Sell straight after signing and there is little track record, and the appraiser will take a conservative view. With several years of receipts and renewals behind it, it is far easier to have the income taken straight into gross income as other income.
Conclusion — three ways to add to the numerator without touching the denominator
1. Start with the properties that have the bays
Properties with 100 or more rooms and on-site parking number 3,642 nationwide with 713,894 rooms. Hourly parking multiplies by bay count, so the shortest route is to start with an inventory of idle bays in this band. Fifteen of 50 bays put the income in the ¥1.80–5.40 million a year range.
2. Use yield points and absolute value for different cases
The roadside model, with its small acquisition-price denominator, moves yield by +0.27–0.80pt; the urban model, with a large denominator, contributes +0.06–0.28pt but creates up to ¥180 million of value. Which metric goes to the investment committee changes which properties you target.
3. Run the regulatory checks alongside design
Treatment of mandated parking bays, permitted zones and area caps under the outdoor advertising ordinance, change of use for tenant units above 200m², and cost allocation for depreciable assets. All shape the contract terms, so raising enquiries with the relevant department in parallel with negotiating terms with agencies and operators avoids rework.
Improving room rates and occupancy depends on market conditions. Income from leasing floor area, once the contract is signed, keeps arriving largely independently of the swings in lodging demand. The sums are small next to room revenue — 1.8% to 5.2% of it in Model A, 0.5% to 2.6% in Model B. Even so, as incremental NOI it adds 0.06 to 0.80 points of yield, and in value terms ¥480,000 to ¥2.25 million per room. As one of the few routes that adds to the numerator of NOI without enlarging the denominator, it earns its place in the value-add plan drawn up straight after acquisition. Every property still has floor area it has not yet leased.
Related reading
References and Sources
■ Data sources
On the property side, operating properties with a known room count were extracted from the MetroEngines Research & Consulting property master across six types — ryokan, resort, business, city, deluxe and capsule (N=16,804 properties, 1,154,165 rooms) — and on-site parking was tabulated by room-count band and by prefecture. The estimated transacted ADR used for room revenue is the monthly average for business-hotel properties in Mie and Tokyo from September 2025 to August 2026 (Mie N=93–96 properties; Tokyo N=894–924 properties). The assumed acquisition price is the first and third quartiles of per-room acquisition price for N=180 properties in the 80–250 room band among the domestic holdings of seven listed hotel REITs (ownership master, as of 7 September 2026). On the catchment side, Economic Census for Business Activity (2021) small-area tabulations were aggregated over a 1km radius, and resident population from National Land Numerical Information 250m-mesh future population projections over a 1.5km radius. Market ranges for leasable space are quoted from levels published by operators and trade media.
■ Modelling assumptions
Model A is a suburban roadside property with 100 rooms and 50 on-site bays; Model B is an urban property with 80 rooms and no on-site parking. Occupancy of 75% for Model A and 85% for Model B are assumptions, not actuals. Ancillary leasing income is converted to incremental NOI on the assumption that 80% of income remains as NOI; that figure is divided by the assumed acquisition price for the yield contribution and capitalised at a cap rate (5.0% for Model A, 4.0% for Model B) for value creation. The mid case in the two-axis sensitivity table is the simple average of the lower and upper bounds, not a probability-weighted expected value. Model A’s hourly parking assumes the 15 of 50 bays that empty out during the day are put on a master lease at ¥10,000–30,000 per bay per month.
■ Limitations and caveats
Every figure here is built up from published market ranges and is neither an appraisal nor a quotation for any specific property. Outdoor advertising rests almost entirely on visibility and hourly parking on the daytime catchment, so two properties of the same size can land at opposite ends of the range depending on location. Estimated transacted ADR is an estimate (tax-exclusive equivalent) derived by applying a property-type correction factor to the lowest published plan level on OTAs (two guests per room, per-room price, tax-included) and differs from actual transacted prices and accounting figures. Economic Census small-area tabulations are not available for every location, even in built-up areas, and where coverage cannot be confirmed employment data should not be used as evidence of demand. The regulatory section cites examples from Tokyo, Shinjuku City and Shibuya City, but whether mandated parking bays may be leased externally, which zones permit outdoor advertising, and how the change-of-use test is applied are all administered differently by each municipality, so an enquiry to the relevant department is required before execution.
■ Market data
- MetroEngines Research & Consulting — property master (N=16,804 properties, 1,154,165 rooms), estimated transacted ADR (N=93–924 properties), listed hotel REIT ownership master (300 domestic properties, as of 7 September 2026)
■ Government statistics and public data
- Ministry of Internal Affairs and Communications / Ministry of Economy, Trade and Industry, “Economic Census for Business Activity (2021)”; boundaries = 2020 Population Census small areas (e-Stat Statistical GIS)
- Ministry of Land, Infrastructure, Transport and Tourism, National Land Numerical Information, “Future population projections by 250m mesh (2024 National Spatial Planning Bureau estimates)”
- Tokyo Metropolitan Government Bureau of Urban Development, “Outdoor Advertising Guide” (July 2024)
- Tokyo Metropolitan Government Bureau of Urban Development, “Mandatory Provision of Parking Facilities”
- Shinjuku City, “On Change of Use” (effective 1 October 2020)
- National Tax Agency, Tax Answer No.6213 “Parking Fees and Similar Charges”
- Ministry of Land, Infrastructure, Transport and Tourism, “On the Income Capitalisation Approach”
- Shibuya City, “Mandatory Provision of Parking Facilities under the Tokyo Metropolitan Parking Ordinance”
■ Sources for the market ranges
- MIJ, “Market rents and installation guide for apartment rooftop mobile base stations”
- Please Park, “Comparing master-lease parking rents by region”
- Time Parking, “Market rates for coin-parking master leases”
- Meiku Advertising, “What is a freestanding rental sign? Monthly costs and landowner income”
- HOME4U Land Use, “The basics of rental signage: advantages and disadvantages”
- Ieul Land Use, “Installing signage as a land use: market rents”
- HOME4U, “Revenue simulation for laundromat operation”
- Kase Real Estate Utilisation, “Taxes on parking operation”
- Architect Referral Center, “No confirmation application is required where the changed-use area is 200m² or less”