

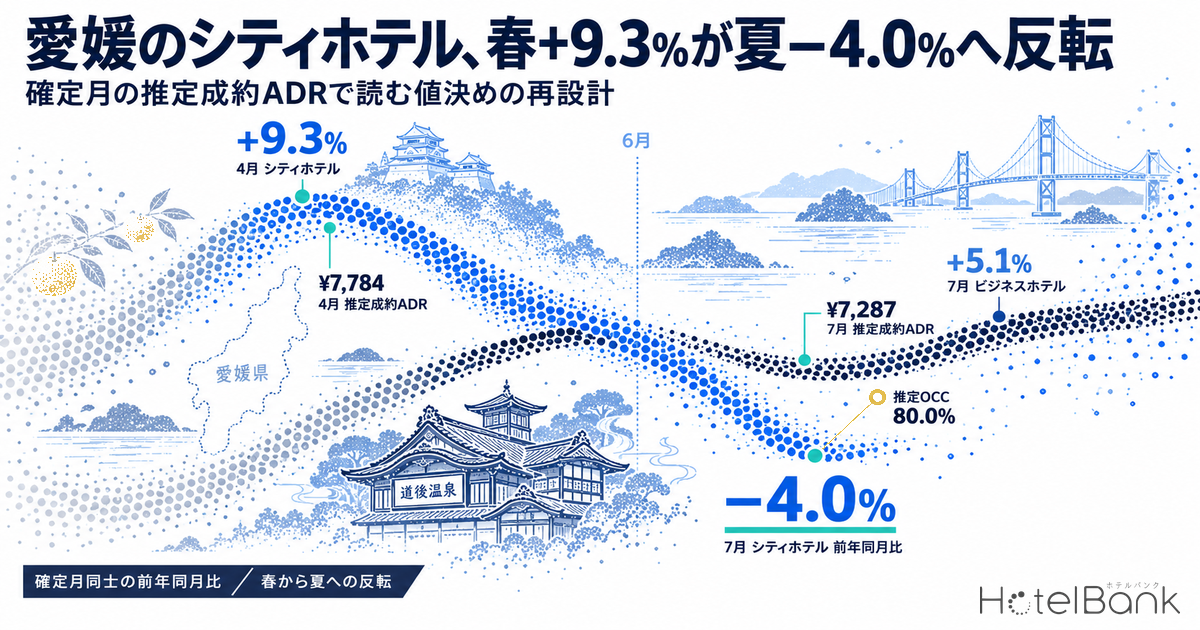
In Ehime Prefecture, the settled ADR estimate for city hotels reached ¥7,784 in April 2026 (¥7,122 a year earlier), a year-on-year gain of +9.3%. By July, however, it had flipped to ¥7,287 against ¥7,591 a year earlier — −4.0%. Within the same prefecture, business hotels went the other way: July came in at ¥5,871 versus ¥5,584, or +5.1%, holding positive in every finalized month from January through August. Why did the confident pricing that worked in the first half stop working in summer, and how should pricing be rebuilt from autumn onward? This article reads the answer from year-on-year comparisons between finalized months and from current booking pace.
Scope: Ehime Prefecture city hotels N=23 properties / business hotels N=103 properties (both as of the August 2026 finalized month). Price figures in this article are settled ADR estimates (the transacted price level estimated from OTA and related sales data, tax-exclusive equivalent); occupancy figures are estimates based on OTA-listed inventory. Both definitions appear at the end of the article. Data as of September 14, 2026.
- — The settled ADR estimate for Ehime city hotels flipped from +9.3% in April to −4.0% in July, with June through August posting three straight months below the prior year (summer average −2.7%, N=23 properties).
- — Business hotels stayed positive in all eight finalized months (July +5.1%, N=103 properties). The gap between the two segments narrowed in July from ¥2,007 to ¥1,416.
- — Estimated OCC for city hotels in July 2026 was a high 80.0% — the classic “high occupancy with rates below last year” pattern. For Saturdays in October, booking pace at 45 days out differed by 15 to 21 points between dates, which argues for separating rates date by date.
The gap that opened in spring closed in summer — finalized month vs finalized month
First, the ground rules. Every comparison here is a year-on-year comparison between months that were both calculated as finalized values. For 2026, January through August are finalized months, so the comparison is limited to those eight months. September onward consists of estimates based on current sales conditions; those months are kept out of any direct comparison with finalized values and are handled separately in the booking-pace section later.
For Ehime city hotels (N=23 properties), the settled ADR estimate opened the year strongly at ¥8,297 in January 2026 against ¥7,395 a year earlier (N=21), or +12.2%. February dipped below the prior year at ¥7,231 (−3.3%), but positives lined up again into spring: March ¥7,478 (+6.7%), April ¥7,784 (+9.3%), May ¥8,332 (+4.3%). Averaged across March to May, the level rose from ¥7,374 to ¥7,865, or +6.6%.
Then June turned negative at ¥6,987 (¥7,129 a year earlier, −2.0%), followed by July at ¥7,287 (−4.0%) and August at ¥7,939 (−2.0%) — three consecutive months in the red. The June-to-August average fell from ¥7,606 to ¥7,404, or −2.7%. From +6.6% in spring to −2.7% in summer is a swing of more than nine points.
Business hotels (N=103 properties) went the opposite way, staying positive in all eight finalized months: January +12.2%, February +4.7%, March +8.2%, April +3.8%, May +4.8%, June +2.6%, July +5.1%, August +2.2%. Growth did decelerate — spring (March-May) +5.6%, summer (June-August) +3.3% — but the sign never changed. Averaged over January to August, city hotels were +2.5% against business hotels at +5.4%, so the full-year lift was in fact larger on the business-hotel side.
Source: MetroEngines Research; compiled by the HotelBank Editorial Team
Overlaying the years, the 2026 line for city hotels clearly separates above the 2025 line in the first half, then crosses over and slips below from June. The 2026 line for business hotels, by contrast, runs in parallel above the 2025 line across all eight months. Only city hotels flipped — that is the defining feature of this phase. The pattern of the upper segment being the first to fall below the prior year is not unique to Ehime: the same directional move appeared in Nagano Prefecture in the same month of June, where city hotels alone reversed to −9.2% on the settled ADR estimate.
Source: MetroEngines Research; compiled by the HotelBank Editorial Team
| Stay month | City 2025 | City 2026 | YoY | Business 2025 | Business 2026 | YoY |
|---|---|---|---|---|---|---|
| January | ¥7,395 | ¥8,297 | +12.2% | ¥5,606 | ¥6,292 | +12.2% |
| February | ¥7,481 | ¥7,231 | −3.3% | ¥5,654 | ¥5,919 | +4.7% |
| March | ¥7,009 | ¥7,478 | +6.7% | ¥5,466 | ¥5,916 | +8.2% |
| April | ¥7,122 | ¥7,784 | +9.3% | ¥5,612 | ¥5,825 | +3.8% |
| May | ¥7,992 | ¥8,332 | +4.3% | ¥5,899 | ¥6,182 | +4.8% |
| June | ¥7,129 | ¥6,987 | −2.0% | ¥5,502 | ¥5,644 | +2.6% |
| July | ¥7,591 | ¥7,287 | −4.0% | ¥5,584 | ¥5,871 | +5.1% |
| August | ¥8,098 | ¥7,939 | −2.0% | ¥6,064 | ¥6,196 | +2.2% |
Settled ADR estimate (tax-exclusive equivalent). All comparisons are between finalized values (past months). N = city hotels 21 properties in 2025 / 21-23 in 2026; business hotels 98-102 properties in 2025 / 101-103 in 2026. Source: MetroEngines Research; compiled by the HotelBank Editorial Team
The narrowing segment premium — how to read what happened
To dig one layer into the reversal, the quickest route is the gap in settled ADR estimates between city and business hotels. Within the same prefecture and the same month, it measures how much of a premium the upper segment was able to command.
In July 2025 that gap was ¥2,007 (city ¥7,591 minus business ¥5,584). In July 2026 it was ¥1,416 (¥7,287 minus ¥5,871) — ¥591 narrower in a single year. As a multiple, it fell from 1.36x to 1.24x. In April, by contrast, the gap widened by ¥449, from ¥1,510 in 2025 to ¥1,959 in 2026. In other words, within the same year the segment premium widened in spring and narrowed again in summer — a round trip. For a sense of how far the segment spread can compress before pricing needs a rethink, the case of Shimane July ADR: City Hotels −8.2%, Business +1.5%, Spread Halves, where the spread went from ¥1,817 to ¥965, is a useful reference.
What matters here is that city hotels in summer probably did not decline because rooms went unsold. Estimated OCC for Ehime city hotels in July 2026 (based on OTA-listed inventory) averaged 80.0% for the month (fixed cohort of 10-11 properties, roughly 1,300 rooms, 27 observed days), and August was 85.4% (same cohort, 24 observed days) — both high. Business hotels tracked at 78.7% in July (48-50 properties, roughly 5,200 rooms, 31 days) and 82.0% in August (same, 31 days). Volume was stacking up; only the price side fell below the prior year.
That combination — high occupancy alongside ADR below last year — is the pattern that demands the most attention in revenue management. Because rooms are filling, the feel on the ground does not deteriorate, and monthly RevPAR does not look conspicuously weak because occupancy props it up. Yet the rate per night is quietly being shaved. In a market that supported +9.3% in spring and fell to −4.0% in summer, the likely issue is not the level of demand itself but that pricing decisions failed to track the shape of the demand calendar.
How far occupancy can mask the erosion in rate can be checked mechanically from the identity RevPAR = ADR x occupancy. The table below is an illustrative calculation combining year-on-year change in ADR with year-on-year change in occupancy (relative change). Even with ADR at −4.0% — the same level as the July 2026 city-hotel market — a 4% year-on-year rise in occupancy leaves RevPAR at −0.2%, essentially flat. Offsetting a 4.0% ADR decline through occupancy alone requires a 4.2% year-on-year gain in occupancy, so watching RevPAR alone makes the rate decline hard to see.
| ADR \ Occupancy | Occ −2% | Occ ±0% | Occ +2% | Occ +4% | Occ +6% |
|---|---|---|---|---|---|
| ADR YoY −6% | −7.9% | −6.0% | −4.1% | −2.2% | −0.4% |
| ADR YoY −4% | −5.9% | −4.0% | −2.1% | −0.2% | +1.8% |
| ADR YoY −2% | −4.0% | −2.0% | −0.0% | +1.9% | +3.9% |
| ADR YoY ±0% | −2.0% | +0.0% | +2.0% | +4.0% | +6.0% |
| ADR YoY +2% | −0.0% | +2.0% | +4.0% | +6.1% | +8.1% |
Illustrative calculation. RevPAR YoY = (1 + ADR YoY) x (1 + occupancy YoY) − 1. Occupancy YoY is a relative change, not an observed market figure. The shaded cell is the combination of ADR −4.0% (the same level as the finalized July 2026 city-hotel market) and occupancy +4%. Compiled by the HotelBank Editorial Team
| Day | City estimated OCC | Business estimated OCC | Gap (pt) |
|---|---|---|---|
| Mon | 80.0% | 76.3% | +3.7 |
| Tue | 82.6% | 85.0% | −2.4 |
| Wed | 84.8% | 85.3% | −0.5 |
| Thu | 85.3% | 83.6% | +1.7 |
| Fri | 81.9% | 77.2% | +4.7 |
| Sat | 87.7% | 85.0% | +2.7 |
| Sun | 77.9% | 70.6% | +7.3 |
Estimated OCC (based on OTA-listed inventory), aggregated by day of week for stay dates in July-August 2026. City hotels N=10-11 properties, roughly 1,300 rooms; business hotels N=48-50 properties, roughly 5,200 rooms. Source: MetroEngines Research; compiled by the HotelBank Editorial Team
By day of week, summer in Ehime stacked up to around 85% on Wednesday, Thursday and Saturday in both segments, while Sunday dropped sharply to 77.9% for city hotels and 70.6% for business hotels. Business hotels reaching the mid-80s on weekdays (Tuesday to Thursday) shows that this market is supported not only by leisure demand but also by solid weekday corporate demand. On the city-hotel side, Saturday at 87.7% is the peak, so the weekend character is relatively stronger.
This shape feeds directly into pricing design. The Sunday drop (−9.8pt against Saturday for city hotels, −14.4pt for business hotels) recurs as a structural feature of the week, so applying a flat rate across the whole week produces a double loss: leaving money on the table on Wednesday, Thursday and Saturday, and carrying excess inventory on Sunday.
Current booking pace — October Saturdays are splitting in two
Next, the pace for the window where action is still possible. The booking curves below are based on observations from 45 days before the stay date up to the latest reading, comparing Saturday October 3 with Saturday October 10. October 10 is the first day of a three-day weekend. For reading the differences in pattern between individual dates, Ehime Saturday Booking Curves: Aug +14.7pt, Sep Flat at +1.2pt, which lines up several Saturdays in the same prefecture and tracks how each one builds, is worth reading alongside this.
Estimated OCC (based on OTA-listed inventory). City hotels N=11 properties, 1,334 rooms; business hotels N=50 properties, 5,232 rooms. Source: MetroEngines Research; compiled by the HotelBank Editorial Team
| Stay date | Segment | 45 days out | 30 days out | Latest observation | 45 days out to latest |
|---|---|---|---|---|---|
| Sat, October 3 | City | 62.7% | 64.3% | 69.6% (20 days out) | +6.9pt |
| Business | 58.1% | 62.2% | 69.0% (20 days out) | +10.9pt | |
| Sat, October 10 (first day of a three-day weekend) | City | 77.7% | 84.8% | 87.9% (27 days out) | +10.2pt |
| Business | 79.6% | 82.3% | 84.5% (27 days out) | +4.9pt |
Estimated OCC (based on OTA-listed inventory), from observations running from 45 days before the stay date to the latest reading. Source: MetroEngines Research; compiled by the HotelBank Editorial Team
Two Saturdays in the same month, and the levels are entirely different. October 10 had already reached 77.7% for city hotels and 79.6% for business hotels at 45 days out, and by 27 days out had built to 87.9% and 84.5%. October 3, by contrast, stood at 62.7% and 58.1% at 45 days out and was still only in the 69% range at 20 days out. That is a 15 to 21 point difference at the 45-day mark, and the gap did not close over the period.
October 10 is the “thickness arrives early” type, already near 80% at 45 days out; October 3 is the ordinary Saturday that grinds upward from 45 days out to the present. Applying the same rate design to both repeats exactly the structure behind the rate erosion seen in summer.
For revenue managers running city and business hotels in Ehime — implications and an action plan
(a) Operational insights
1. Re-set the assumption that “year-on-year gains are continuing” on a month-by-month basis. The Ehime city-hotel market rose clearly in the first half — January +12.2%, April +9.3% — then fell below the prior year for three consecutive months: June −2.0%, July −4.0%, August −2.0%. If the annual budget is still drawn from the growth rate set at the start of the year, it is easy to misread the summer shortfall as “demand was weak.” Start by lining up your own monthly figures on a finalized-month basis and identifying the month in which the sign changed.
2. Make the “high occupancy, falling rate” pattern explicitly detectable. In July 2026 the market ran at an estimated OCC of 80.0% (city hotels) while the settled ADR estimate was −4.0% year on year. With occupancy alone as the monitoring metric, this pattern never raises an alarm. There is a case for always reviewing occupancy and rate as a pair, and treating “a month where occupancy is level or better but rate is below the prior year” as an alert condition in its own right.
3. A narrowing segment premium is a signal to suspect overlapping price bands. The gap in settled ADR estimates between city and business hotels narrowed from ¥2,007 in July 2025 to ¥1,416 in July 2026. On the city side, check whether your own rates are drifting toward the band of the segment below; on the business side, check the reverse — whether you are reaching into the band above — using these two market levels as the yardstick.
4. Handle day-of-week structure and date-specific build speed on the same calendar. The summer market showed a clear step by day of week: around 85% on Wednesday, Thursday and Saturday, against 77.9% (city) and 70.6% (business) on Sunday. In October, even among Saturdays, pace at 45 days out split between 77.7% (October 10, city) and 62.7% (October 3, city). Day of week and date-specific demand are separate axes, and there is room to build a rate calendar that reflects both.
(b) Action plan
| Time frame | Action | Decision trigger | Purpose |
|---|---|---|---|
| Today to this week | Sort October Saturdays into “early-build dates” and “ordinary Saturdays,” and separate the rates | Flag as early-build any date where your own pace at 45 days out is close to the market’s 77.7% (city) / 79.6% (business) | Avoid leaving rate on the table on early-build dates |
| Review Sunday inventory allocation and selling conditions | If your Sunday occupancy falls against Saturday by as much as the market or more (city −9.8pt / business −14.4pt) | Fill the mid-week trough and protect the weekly average rate | |
| Within two weeks | Line up your own January-August 2026 ADR against the prior year on a finalized-month basis and identify the month it flipped | If the market (city) swung from +6.6% in spring to −2.7% in summer while your own plan still assumes the same growth rate all year | Align second-half planning assumptions with actual market conditions |
| Build a monthly “high occupancy, rate below prior year” alert into operations | When occupancy is level or better and rate is below the prior year for two consecutive months | Detect quiet rate erosion early | |
| Looking to next month | Reposition your own price band against the market’s two levels (city ¥7,287 / business ¥5,871, finalized July 2026) | If your segment gap is smaller than the market’s ¥1,416, or you have unintentionally drifted toward the lower band | Return to a price band consistent with your segment position |
| Design next summer’s (June-August) pricing calendar in advance, day-of-week steps included | If your own results this summer fell below the prior year as the market did, revisit an operating model premised on last-minute adjustment | Break the structure that shaves rate during peak season |
Note: none of the above guarantees a result; each is offered as material for consideration in light of your own catchment, guest mix and contract terms.
Summary — three yardsticks to hold onto in a reversal
Yardstick 1: can you name the month the sign changed? On a finalized-month basis, Ehime city hotels were positive year on year from March to May (February alone at −3.3%), then turned negative for three straight months from June. Turning points invisible in an annual average or a first-half cumulative total are always recorded in the monthly series. Being able to answer instantly which month your own property flipped is the starting point for second-half pricing.
Yardstick 2: always read occupancy and rate as a pair. In July 2026 the market combined a high estimated OCC of 80.0% (city hotels) with an ADR of −4.0% year on year. The months that look healthy on occupancy alone are exactly the ones where rate needs checking.
Yardstick 3: the same day of week can behave differently by date. October 3 and October 10 are both Saturdays, yet pace at 45 days out differed by 15 points — 62.7% against 77.7% (city hotels). Whether you can treat the day-of-week pattern and date-specific demand as separate axes determines whether you can protect rate on peak dates.
That spring’s upside reversed in summer does not mean the Ehime market has weakened. Business hotels beat the prior year in all eight finalized months, and summer occupancy held around 80% in both segments. What changed is not the volume of demand but the shape of how far you can push in which month. Capturing that shape across three layers — month, day of week and individual date — is what rebuilding pricing for the next peak season actually consists of.
About the data
– Definition of estimated OCC (based on OTA-listed inventory): OTA-listed-inventory occupancy = 100 − 100 x rooms still listed on OTAs / total rooms. Coverage is a fixed cohort (the same set of properties for each stay date) of properties listing at least 30% of their total rooms on OTAs. It is an estimate based on how listed inventory is being absorbed on OTAs, and its definition differs from actual room occupancy (it runs higher because rooms not listed are counted as already sold). The months covered in this article are July and August 2026 (day-of-week aggregation and monthly averages), plus October 3 and October 10, 2026 (booking pace).
– Booking curves: based on observations from 45 days before the stay date to the latest reading.
– Definition of the settled ADR estimate: the transacted price level (tax-exclusive equivalent) estimated from OTA and related sales data (lowest-plan level x segment coefficient, ensembled across multiple channels). Past months are finalized values; the current and future months are estimates based on current sales conditions. Cross-checks against disclosed operating results show a median error of 6.6%. Every year-on-year comparison in this article is made only between months calculated as finalized values; months that are estimates based on current sales conditions (September 2026 onward) are excluded from year-on-year comparison.
– Breakdown of N: Settled ADR estimate — Ehime city hotels N=21 properties (each month of 2025) / 21-23 properties (January-August 2026); Ehime business hotels N=98-102 properties (each month of 2025) / 101-103 properties (January-August 2026). Estimated OCC — Ehime city hotels, fixed cohort of 10-11 properties, roughly 1,300 rooms; Ehime business hotels, fixed cohort of 48-50 properties, roughly 5,200 rooms (both based on listings on major booking sites). Observed days for the day-of-week aggregation: city hotels 27 days in July 2026 and 24 days in August; business hotels 31 days and 31 days.
– Data as of September 14, 2026. Sales conditions and inventory change daily, so the figures in this article are a snapshot as of the retrieval date.