

How many square metres of building does it take to create one hotel room? Plenty of tables circulate quoting construction cost per tsubo, but to turn that into a cost per key you have to supply one coefficient yourself: gross floor area ÷ number of rooms = floor area per room (m²/room). And when you actually measure it, that coefficient swings from 13 m² to 196 m² inside the single use class called “hotel” (up to 437 m² at the extreme of an individual project). You can refine your cost per tsubo down to the last ten thousand yen, but get the floor area per room wrong by one band and your cost per key is off by a factor of ten.
This article measures the coefficient across 72 hotel projects with 20 or more rooms (45 hotel-only, 27 mixed-use) from Japan’s Ministry of Land, Infrastructure, Transport and Tourism (MLIT) building plan data, and breaks down what actually determines it. The conclusion up front: the driver is not room count but the number of floors. And the coefficient derived from hotel-only projects must not be applied to the 27 mixed-use ones.
How this piece fits with our earlier coverage
The level of the coefficient itself — the median, the construction cost per key reverse-engineered from it, and the cross-check against actual per-room transaction prices paid by Japanese hotel REITs — was covered in an earlier HotelBank analysis of 31 building plans, which put the median at 35.0 m² per room and the resulting building cost at ¥20.67m per key. This article picks up from there and narrows to three questions: (1) what drives the coefficient (the answer is floor count), (2) how to work backwards from gross floor area to a room count, and (3) why the same coefficient cannot be used on mixed-use projects. Regional and structural differences in the cost per square metre itself — wood-frame hotels run at 62.8% of the reinforced-concrete rate — are a separate subject. Cost per m² × floor area per room = cost per key; the two are the left and right sides of the same multiplication.
Metric Definitions Used in This Article
- Floor area per room (m²/room): the gross floor area of the whole building as registered in the building plan, divided by that project’s room count. This is not the net area of a guestroom; it is the building’s entire floor plate divided by one room, including corridors, lobby, communal bath, kitchen, banquet rooms, plant rooms and parking.
- Hotel-only vs mixed-use: projects whose primary-use field lists only hotel (plus ancillary uses such as parking and plant rooms) are classed as hotel-only; those that also list offices, housing or retail are classed as mixed-use. Because mixed-use gross floor area includes non-hotel floors, the coefficient is treated separately for that group.
- Construction cost per room (¥ per key): the floor area per room converted to tsubo (1 tsubo = 3.30578 m²) and multiplied by the cost per tsubo for the relevant structure type, giving the building shell-and-core construction cost. It excludes land, FF&E, pre-opening costs, design and supervision fees, and consumption tax.
- Data sources: MLIT “Survey on Building Construction Dynamics” (building plans), compiled by MetroEngines Research & Consulting. Cost per tsubo is the 2025 actual for hotel use from MLIT’s “Survey on Building Construction Starts”.
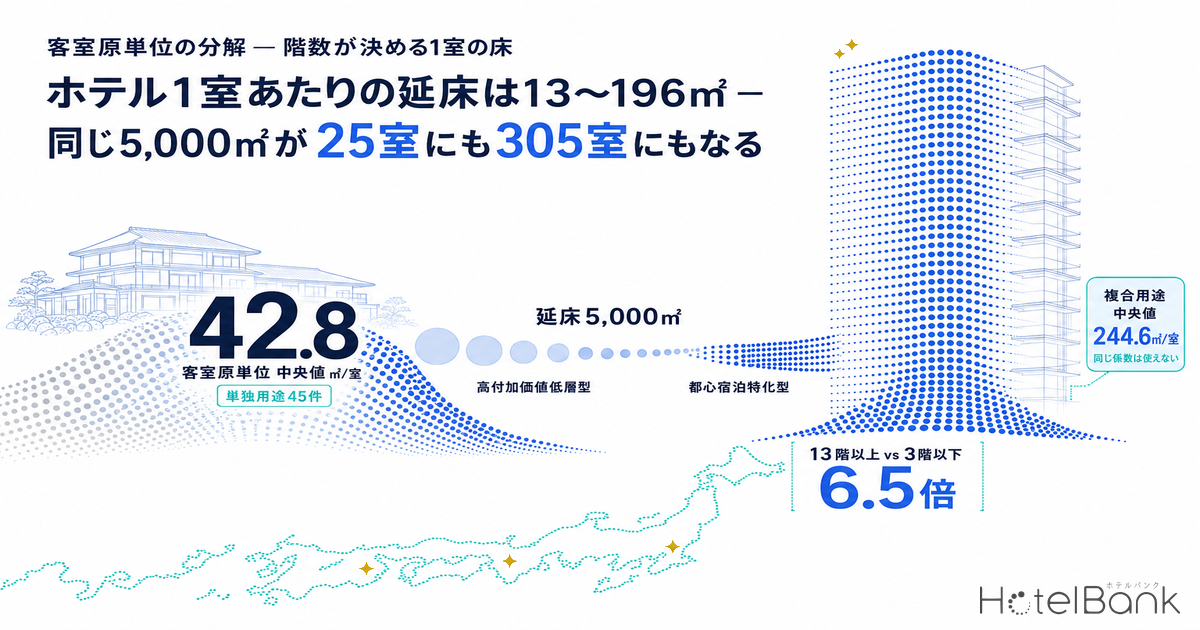
- — 42.8 m²/room: the median floor area per room (gross floor area of the whole building ÷ rooms) across 45 hotel-only building plans. The interquartile range of 18.3–92.8 m² is a 5.1x spread; widen it to the top and bottom deciles and it opens to 11.7x.
- — 6.5x: what sets the coefficient is floor count, not room count. The 16 projects of 13 floors or more have a median of 18.3 m²; the 6 projects of 3 floors or fewer, 118.2 m². Hold size constant at 150+ rooms and a 1.9x gap still remains.
- — 25 to 305 rooms: from the same 5,000 m² of gross floor area, a high-end low-rise format (196.4 m²) yields 25 rooms and an urban limited-service format (16.4 m²) yields 305. You cannot produce a room count without first fixing the format.
- — ¥9.68m to ¥115.97m: applying the all-structure average of ¥1.952m per tsubo, shell-and-core cost per key spans 12.0x. Switching structure from wood to steel moves it only 1.7x within the same coefficient.
- — 244.6 m²/room: the median of “total gross floor area ÷ rooms” across 27 mixed-use projects. Because the numerator contains non-hotel floors, the hotel-only coefficient must not be applied to it.
The sample — 72 hotel building plans of 20+ rooms, 45 hotel-only and 27 mixed-use
The population is the 81 projects registered with 20 or more guestrooms among building plans in MLIT’s “Survey on Building Construction Dynamics”. Of those, 74 have both gross floor area and room count on record, and the 72 projects (13,852 rooms in total) whose coefficient lands at 10 m²/room or above form the analysis set. The two projects below 10 m²/room (Minamisemba in Chuo-ku, Osaka, showing 13 m² of gross floor area for 223 rooms, and Kitanakadori in Naka-ku, Yokohama, showing 48.9 m² for 272 rooms) appear to record gross floor area in units inconsistent with the rest, so they are excluded from level comparisons.
The 72 split into 45 hotel-only projects (7,927 rooms; 418,709 m² of combined gross floor area) and 27 mixed-use projects (5,925 rooms; 3,990,181 m²). That the mixed-use group carries 9.5 times the floor area of the hotel-only group is a function of the offices, retail and apartments stacked into those buildings; it is not a measure of hotel scale. We return to this below.
Note that building plan data is filed at the building-confirmation stage, so it should be read as a floor on the projects filed as of the survey date. Counts and room numbers are expected to rise as further applications are filed, and a thin-looking count in a future year does not mean supply is drying up.
Hotel-only projects: median 42.8 m², with a 5.1x interquartile spread of 18.3–92.8 m²
Start with the distribution across the 45 hotel-only projects. The median is 42.8 m²/room, the first quartile 18.3 m², the third quartile 92.8 m². The interquartile range alone is a 5.1x spread; widen it to the first decile (15.8 m²) and ninth decile (184.5 m²) and it opens to 11.7x. The minimum is a 40-room project in Asakusa, Taito-ku, Tokyo at 13.1 m²/room; the maximum is a 100-room project in Nishi-ku, Nagoya at 436.7 m²/room.
The distribution has a long right tail, and the centre of gravity by project count (14 projects below 20 m²) sits further from the centre of gravity by rooms. The 14 projects below 20 m²/room alone deliver 3,041 rooms, while the 7 projects at 150 m² or above deliver just 525. Counted by projects, the high-coefficient format is 16% of the total; counted by rooms, 7%. That asymmetry is why a pipeline described in “number of projects” and one described in “number of rooms” paint different pictures of the same market.
| Floor area per room | Projects | Total rooms | Median m²/room | Median rooms | Median floors | Typical format |
|---|---|---|---|---|---|---|
| Under 20 m² | 14 | 3,041 | 16.4 m² | 234 | 14.0F | Limited-service, city centre and major-city station fronts |
| 20–40 m² | 8 | 1,407 | 26.3 m² | 164 | 9.5F | Mid-scale, suburban and regional core cities |
| 40–80 m² | 9 | 2,057 | 56.6 m² | 200 | 11.0F | Full-function, with communal bath and banquet space |
| 80–150 m² | 7 | 897 | 101.0 m² | 71 | 7.0F | Small and mid-size boxes in resort and onsen areas |
| 150 m² and above | 7 | 525 | 196.4 m² | 55 | 4.5F | High-end, low-rise, small box |
| Total | 45 | 7,927 | 42.8 m² | 168 | 11.0F | — |
Floors, not room count, set the coefficient — 18.3 m² at 13F+, 118.2 m² at 3F and under
So what produces this fivefold spread? There are two candidates: room count (economies of scale) and floor count (stacking vertically versus spreading horizontally). Taking the 43 hotel-only projects with a floor count on record, the correlation against the log of the coefficient is −0.44 for floors and −0.33 for rooms. Both pull in the negative direction, but floors pull harder.
Bundle the projects into floor bands and the structure is unmistakable. The 16 projects of 13 floors or more cluster at a median of 18.3 m²/room, while the 6 projects of 3 floors or fewer sit at 118.2 m²/room — a gap of 6.5x. The 16 projects at 8–12 floors land at 41.2 m², close to the overall median, and the 5 projects at 4–7 floors come in at 113.4 m², near the low-rise end.
| Floor band | Projects | Median m²/room | Median rooms | Median rooms per floor | How the floor plate is used |
|---|---|---|---|---|---|
| 3 floors and under | 6 | 118.2 m² | 116 | 38.5 | Site used horizontally; floor area allocated generously to gardens, communal baths and restaurants |
| 4–7 floors | 5 | 113.4 m² | 50 | 7.9 | Small, high-end boxes with few rooms per floor |
| 8–12 floors | 16 | 41.2 m² | 179 | 15.6 | Mid-scale in regional core cities, with communal bath and breakfast room |
| 13 floors and above | 16 | 18.3 m² | 248 | 16.2 | Repeating typical floor plate, common areas held to a minimum — limited-service |
Floors and rooms are themselves correlated (r = 0.56), so the two cannot be fully separated. To test it, hold scale constant. Taking only the 24 projects of 150 rooms or more, the 14 at 13 floors and above have a median of 18.2 m² against 34.8 m² for the 10 at 8–12 floors. Within the same size band, floor count still makes a 1.9x difference. Scale alone does not explain it: stacking vertically is itself what raises floor efficiency.
From a design standpoint the reason is straightforward. Build a tower and the core (stairs, lifts, service shafts) and the ground-floor public areas are shared across every level, so the higher you stack, the larger the share of the building given over to typical guestroom floors. Spread out low and wide instead, and roof, foundation and perimeter all grow relative to the room count — and the floor-hungry amenities follow: gardens, parking, communal baths, restaurants. Floor count is the outcome of floor-area ratio and site conditions: where floor-area-ratio bonuses in urban redevelopment districts allow height, or conversely where aviation-law height limits cap a site at 45 metres, the constraint pushes the coefficient automatically — a height-limited site is pushed toward more floor area per room.
Geography splits the same way — 17.3 m² for Tokyo’s 14 hotel-only plans, 58.1 m² elsewhere
The distribution of floor counts maps directly onto geography. Of the 45 hotel-only projects, the 14 sited in Tokyo have a median coefficient of 17.3 m²/room and a median floor count of 14.0F. The other 31 have a median of 58.1 m²/room — a 3.4x gap. The economics read plainly: the more expensive the land, the more of the floor plate is concentrated into guestrooms; the cheaper the land, the more is allocated to common areas and amenities.
| Asakusa, Taito-ku, Tokyo | 13.1 m² / 40 rooms / 9F |
| Kanda-Misakicho, Chiyoda-ku, Tokyo | 15.5 m² / 167 rooms / 14F |
| Dogenzaka, Shibuya-ku, Tokyo | 15.6 m² / 231 rooms / 15F |
| Chidori, Urayasu, Chiba | 58.1 m² / 750 rooms / 14F |
| Kowakudani, Hakone, Kanagawa | 187.3 m² / 126 rooms / 3F |
| Gion-machi Minamigawa, Higashiyama-ku, Kyoto | 196.4 m² / 55 rooms / 7F |
| Orodani, Sumoto, Hyogo | 243.8 m² / 25 rooms / 6F |
The city-centre projects lined up at 15–16 m² are all limited-service formats of 13–15 storeys and 160–330 rooms. They achieve a design efficiency that extracts two to three times the rooms from the same gross floor area as other formats, and what matters is that this band repeats across multiple operators and multiple locations. It is not a one-off outlier but an established design solution.
The reverse-lookup table — 5,000 m² of gross floor area is 25 rooms or 305
In practice what gets fixed first is usually not the room count but the gross floor area available. Site area × floor-area ratio sets the ceiling, and the design then works out how many rooms fit inside it. Use the coefficients above and that reverse lookup takes one line.
| Assumed format (coefficient) | 3,000 m² GFA | 5,000 m² GFA | 10,000 m² GFA | 20,000 m² GFA |
|---|---|---|---|---|
| Urban limited-service (16.4 m²) | 183 rooms | 305 rooms | 610 rooms | 1,220 rooms |
| Regional mid-scale (26.3 m²) | 114 rooms | 190 rooms | 380 rooms | 760 rooms |
| Overall median (42.8 m²) | 70 rooms | 117 rooms | 234 rooms | 467 rooms |
| Communal bath / banquet type (56.6 m²) | 53 rooms | 88 rooms | 177 rooms | 353 rooms |
| Small resort box (101.0 m²) | 30 rooms | 50 rooms | 99 rooms | 198 rooms |
| High-end low-rise (196.4 m²) | 15 rooms | 25 rooms | 51 rooms | 102 rooms |
The same 5,000 m² becomes 305 rooms as a limited-service hotel and 25 rooms as a high-end low-rise — a 12x spread. That is why answering “how many rooms can this site take?” off the cuff during a first-pass land screening is meaningless without fixing the format. Put the other way round: fix one format and the room count falls out of the gross floor area almost uniquely.
Down to cost per key — a 12x move in the coefficient is a 12x move in construction cost
Multiply the coefficient by the cost per tsubo and you have the building cost per key. The cost per tsubo comes from MLIT’s “Survey on Building Construction Starts” 2025 actuals for hotel use: ¥1.952m per tsubo across all structures, ¥2.405m for steel, ¥2.026m for reinforced concrete, ¥1.382m for wood. One tsubo = 3.30578 m².
| Floor area per room | Tsubo per room | Wood ¥1.382m/tsubo | All-structure avg ¥1.952m/tsubo | RC ¥2.026m/tsubo | Steel ¥2.405m/tsubo |
|---|---|---|---|---|---|
| 16.4 m² (urban limited-service) | 4.96 | ¥6.86m | ¥9.68m | ¥10.05m | ¥11.93m |
| 26.3 m² (regional mid-scale) | 7.96 | ¥10.99m | ¥15.53m | ¥16.12m | ¥19.13m |
| 42.8 m² (overall median) | 12.95 | ¥17.89m | ¥25.27m | ¥26.23m | ¥31.14m |
| 56.6 m² (communal bath / banquet) | 17.12 | ¥23.66m | ¥33.42m | ¥34.69m | ¥41.18m |
| 101.0 m² (small resort box) | 30.55 | ¥42.22m | ¥59.64m | ¥61.90m | ¥73.48m |
| 196.4 m² (high-end low-rise) | 59.41 | ¥82.11m | ¥115.97m | ¥120.37m | ¥142.88m |
Lined up at the all-structure average, the range runs from ¥9.68m per key for urban limited-service to ¥115.97m per key for high-end low-rise — 12.0x. That this much movement occurs within a single column (that is, at a constant cost per tsubo) means the variance in cost per key is governed by the coefficient, not by the rate per square metre. Swinging the structure from wood to steel moves it only 1.7x within the same coefficient. If you want a more accurate appraisal, re-setting the coefficient by format pays off more than refining the cost per tsubo.
Construction costs themselves remain on an upward path. Cost per tsubo for hotel use, derived from MLIT’s construction starts statistics, rose from ¥1.38m in 2022 to ¥1.95m in 2024 — up 41% in two years — and held high at ¥1.952m on the all-structure average in 2025. That said, it also works to suppress new supply, which is an upside factor for the competitive position of existing stock. For owners weighing a rebuild or an extension instead, note that hotel extensions have added the equivalent of 19,000 rooms over five years at a cost per square metre close to that of new build, and that demolition for a hotel rebuild runs ¥51,000–147,000 per m².
Do not apply the same coefficient to the 27 mixed-use projects — their median is 244.6 m²
Everything above concerns the 45 projects whose use field lists hotel alone. The remaining 27 are mixed-use, listing offices, retail or apartments alongside, and for them “total gross floor area ÷ rooms” has a median of 244.6 m²/room, a third quartile of 1,520.8 m² and a maximum of 5,440.0 m².
That figure must not be read as “5,440 m² is being spent on one hotel room”. It simply means the numerator contains non-hotel floors. Run the hotel-only coefficient in reverse and you can approximate the share of a mixed-use building the hotel occupies. Assume 40 m²/room and the large central-Tokyo redevelopments line up with a hotel share of roughly 1–5% of gross floor area.
| Location | Rooms | Total GFA | Floors | Total GFA ÷ rooms | Est. hotel floor share |
|---|---|---|---|---|---|
| Otemachi, Chiyoda-ku, Tokyo | 100 | 544,000 m² | 63F | 5,440.0 m² | 0.7% |
| Tenjin, Chuo-ku, Fukuoka | 41 | 147,000 m² | 19F | 3,585.4 m² | 1.1% |
| Uchisaiwaicho, Chiyoda-ku, Tokyo | 100 | 361,076 m² | 48F | 3,610.8 m² | 1.1% |
| Shibaura, Minato-ku, Tokyo | 217 | 551,000 m² | 43F | 2,539.2 m² | 1.6% |
| Hiromachi, Shinagawa-ku, Tokyo | 285 | 250,000 m² | 26F | 877.2 m² | 4.6% |
| Minatocho, Naka-ku, Yokohama | 280 | 128,567 m² | 33F | 459.2 m² | 8.7% |
| Matsubaracho, Minami-ku, Hiroshima | 380 | 113,754 m² | 20F | 299.4 m² | 13.4% |
| Minato Mirai, Nishi-ku, Yokohama | 338 | 82,662 m² | 14F | 244.6 m² | 16.4% |
Three practical implications follow. First, the gross floor area of a mixed-use project must never be used as a measure of hotel scale: stack up gross floor area in a pipeline tally and office and residential floors get counted as hotel supply. Second, the cost per key for the hotel floors of a mixed-use building cannot be set at the same cost per tsubo as a standalone hotel — shared core, plant rooms and parking are apportioned across the other uses, while structural grade and building services specification are pulled up to the specification of the building as a whole. Third, where the hotel share is a few per cent, the hotel becomes a dependent variable of the wider scheme. Once the development decision turns on the economics of the offices and retail, the hotel’s floor area and specification are handed down as the outcome of a negotiation.
The 27 mixed-use projects plan 5,925 rooms — 43% of the 13,852 rooms in the 72-project analysis set, and 75% of the 7,927 rooms in the 45 hotel-only projects. That is not a volume you can ignore. And yet the coefficient cannot be carried across, which means the two groups have to be kept on separate books from the outset. Broken down instead by who is commissioning the work, 34% of hotel projects are chain operators developing for their own account; on the time axis, a separate measurement of 67 projects puts the span from groundbreaking to completion at a median of 2.80 years — see Hotel Build Times: 2.80-Year Median, 1.96 Solo vs 4.00 Mixed-Use.
Conclusion — what sets appraisal accuracy is the coefficient, not the cost per tsubo
1. No cost per key without a format
Across 45 hotel-only projects the coefficient has a median of 42.8 m² and an interquartile range of 18.3–92.8 m². Apply the all-structure average cost per tsubo and cost per key moves 12x, from ¥9.68m to ¥115.97m. Given that much swing at a constant rate, re-setting the coefficient by format contributes far more to accuracy than refining the rate.
2. Floor count is the driver
The 16 projects at 13 floors and above have a median of 18.3 m² against 118.2 m² for the 6 at 3 floors and under — 6.5x. Even holding size at 150+ rooms, 18.2 m² at 13F+ versus 34.8 m² at 8–12F leaves a 1.9x gap. Floor-area ratio and height limits feed straight through the coefficient into cost per key.
3. Keep mixed-use on separate books
For the 27 mixed-use projects, total gross floor area ÷ rooms has a median of 244.6 m² and a maximum of 5,440 m². In large central-Tokyo redevelopments the hotel share is estimated at 1–5% of gross floor area. Use gross floor area as a proxy for hotel scale and you will overstate supply dramatically.
For anyone building a business plan, the ordering becomes explicit: site conditions (floor-area ratio, height limits) → available gross floor area and floor count → format and coefficient → room count → cost per tsubo → cost per key. Set it out in that order and you can see which variable is governing the answer at each step. Start from the cost per tsubo instead and you end up fixing the widest-swinging variable as an unstated assumption while refining the narrowest one.
For owners considering a rebuild or an extension, the coefficient also runs in the other direction. If you know the gross floor area of the existing building, you can calculate how many square metres you are currently spending per room. If that is larger than the median for the same location and the same floor band, there is room to add keys by reallocating floor area. One caveat: legally non-conforming status, height limits and the current floor-area ratio mean the post-rebuild gross floor area cannot be assumed to match what stands today.
A note on reading this data: the floor area per room used here is a coefficient computed from the gross floor area and room count registered in building plans, not an as-built figure. Both gross floor area and room count change as plans are revised. Because building plans are filed at the building-confirmation stage, counts for future years represent a floor on the confirmed pipeline as of the survey date and are expected to rise as further applications are filed. Construction cost per key is reverse-engineered shell-and-core cost only, excluding land, FF&E, pre-opening costs, design and supervision fees, and consumption tax. An actual investment decision requires a project-specific feasibility study.
Related reading
- Hotel Build Times: 2.80-Year Median, 1.96 Solo vs 4.00 Mixed-Use
- Japan’s Pre-1981 Hotel Stock: 236k Rooms, 19.1% — Retrofit or Rebuild
References and sources
■ Data sources
The population is the 81 hotel projects of 20 or more rooms registered in building plans under MLIT’s “Survey on Building Construction Dynamics”. Of these, 74 have both gross floor area and room count on record, and the 72 with a coefficient of 10 m²/room or above (13,852 rooms in total) form the analysis set. They are split by the use field into 45 hotel-only projects (7,927 rooms) and 27 mixed-use projects (5,925 rooms); analysis involving floor count is run on the 43 projects with a floor count on record. Cost per tsubo uses the 2025 actuals for hotel use from MLIT’s “Survey on Building Construction Starts”.
■ Calculation assumptions
Floor area per room = gross floor area of the whole building ÷ room count. It is not the net guestroom area and includes common areas such as corridors, lobby, communal bath, kitchen, banquet rooms, plant rooms and parking. Construction cost per room = the coefficient converted to tsubo (1 tsubo = 3.30578 m²) multiplied by the cost per tsubo for the structure type, giving shell-and-core cost excluding land, FF&E, pre-opening costs, design and supervision fees, and consumption tax. Room counts in the reverse-lookup table are gross floor area ÷ the band median; the hotel floor share for mixed-use projects is an approximation assuming 40 m²/room.
■ Limitations
Building plans are filed at the building-confirmation stage and are not as-built records. Gross floor area and room count both change as plans are revised, and counts for future years are a floor on the confirmed pipeline as of the survey date, expected to rise as further applications are filed. The two projects below 10 m²/room were excluded from level comparisons because their gross floor area appears to be recorded in units inconsistent with the rest. The hotel floor share for mixed-use projects is not the hotel-demised area disclosed by each project. An actual investment decision requires a project-specific feasibility study.
■ Building plan and supply data
- MLIT “Survey on Building Construction Dynamics” (building plans), compiled by MetroEngines Research & Consulting — 81 hotel projects of 20+ rooms, of which the 72 with both gross floor area and room count on record and a coefficient of 10 m²/room or above (45 hotel-only, 7,927 rooms; 27 mixed-use, 5,925 rooms) were tabulated
- MLIT “Survey on Building Construction Starts” — 2025 hotel use, cost per tsubo by structure (all-structure average ¥1.952m, steel ¥2.405m, reinforced concrete ¥2.026m, wood ¥1.382m)
- e-Stat, “Survey on Building Construction Starts”
■ Location data and mapping
- Geospatial Information Authority of Japan, place-name search API — geocoding of building plan addresses
■ Construction cost and investment benchmarks
- archi-book, “Construction cost per tsubo”, 2025 edition — year-on-year movement in cost per tsubo by structure
- MetroEngines Research & Consulting — data preparation, coefficient calculation and reverse-lookup modelling of building plan data