

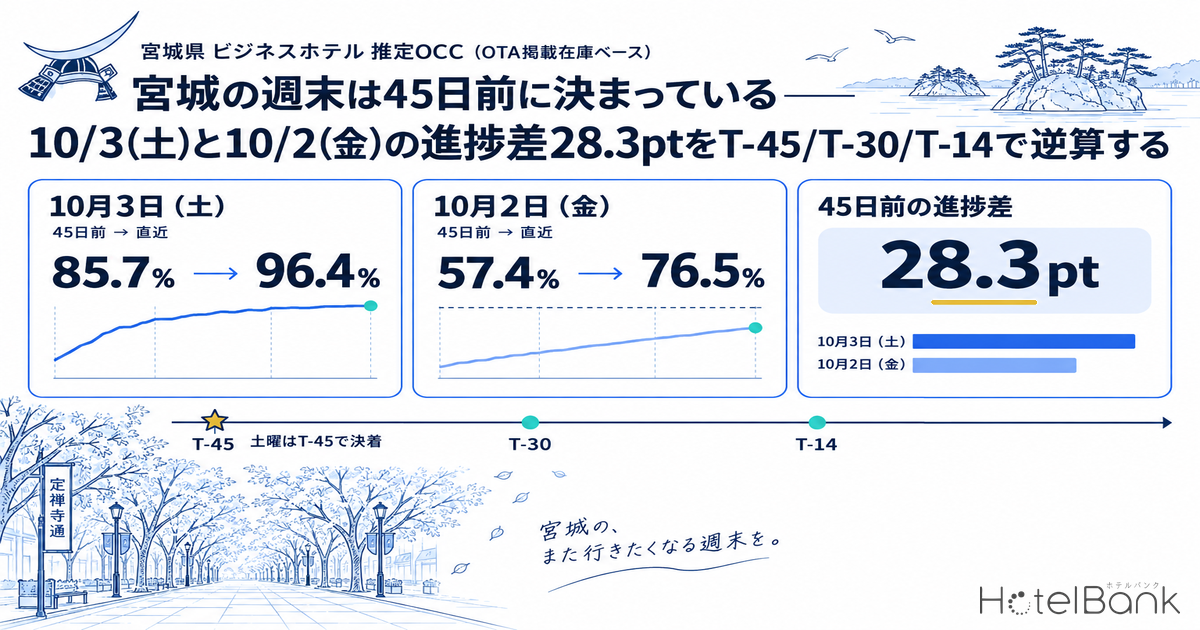
At business hotels in Miyagi Prefecture, estimated OCC (based on OTA-listed inventory) for Saturday, October 3, 2026 had already reached 85.7% 45 days before the stay date. Friday, October 2 — the same week — stood at 57.4% at the same 45-day mark. Same weekend, same set of properties (fixed cohort of N=60 properties / 8,658 rooms), and yet a 28.3-point gap had opened up a month and a half before arrival. At the most recent observation (22 days out for Oct 3, 21 days out for Oct 2), Saturday had built to 96.4% while Friday sat at 76.5%. The gap narrowed to 19.9 points, but it has not closed.
This article places the booking curves for that first Friday and Saturday of October alongside two control dates in September (Sat Sep 19 and Mon Sep 21, the middle of a five-day holiday run) and breaks down, by day of week, when the decision is actually over. The short answer: in Miyagi, Saturday is decided at T-45. Friday and the mid-holiday weekday are decided after that. The difference is a concrete basis for rebuilding the calendar for rate changes and inventory release.
Scope: Miyagi Prefecture business and city hotels, N=60 properties (business / 8,658 rooms) and N=10 properties (city / 1,047 rooms); the all-property basis is N=209 properties (14,014 rooms). Price figures in this article are settled ADR estimates (the transacted price level estimated from OTA and other sales data, tax-excluded equivalent); occupancy is an estimate based on OTA-listed inventory. Both definitions are given at the end of the article. Data as of September 12, 2026.
- — Miyagi business hotels stood at 85.7% for Saturday, October 3, 2026 and 57.4% for Friday, October 2 at 45 days before the stay date. A 28.3-point gap on the same weekend, across the same set of properties, a month and a half out.
- — The gap is still 19.9 points at the latest reading (22 days out for Oct 3, 21 days out for Oct 2): Saturday 96.4%, Friday 76.5%. Friday’s gain (+19.1pt) is nearly double Saturday’s (+10.7pt), yet it lands 20 points lower.
- — The sell-out rate makes the structure explicit. Saturday inventory dries up from 33.3% at T-45 to 68.3% at the latest reading, while Friday sits at 3.3% at both points. Friday is the day that keeps rooms available to the end.
- — Across the seven Tohoku-region prefectures on the same two dates, the T-45 Saturday-minus-Friday gap is Iwate +33.6pt, Yamagata +30.9pt and Miyagi +28.3pt, against Niigata +0.7pt and Fukushima +7.4pt. Iwate and Yamagata — beyond the reach of Sendai’s events — exceed Miyagi, so the pattern of Saturday settling at T-45 exists independently of the event calendar.
- — To hold reference RevPAR after a 5% rate cut, Friday would have to add +4.8 points of sell-through (to 96.8%). Across the 13 Fridays in the past three months, that level was reached on exactly one. Saturday would need 99.4%, above the 98.8% observed maximum. Last-minute weekend discounting cannot be recovered through volume.
The first week of October: the 28.3-point gap at T-45 does not close before arrival
Start with the fixed-point comparison between Friday, October 2 and Saturday, October 3. Observations run from 45 days before the stay date to the most recent reading, taken on a fixed cohort — a set of properties that list at least 30% of their total rooms on OTAs and other channels, held identical across stay dates.
| Segment (N) | T-45 | T-30 | Latest | T-45 → latest |
|---|---|---|---|---|
| Saturday, October 3 | ||||
| Business hotels (N=60) | 85.7% | 92.0% | 96.4% | +10.7pt |
| City hotels (N=10) | 95.2% | 98.3% | 98.4% | +3.2pt |
| All properties (N=208) | 82.1% | 88.3% | 92.2% | +10.1pt |
| Friday, October 2 | ||||
| Business hotels (N=60) | 57.4% | 68.5% | 76.5% | +19.1pt |
| City hotels (N=10) | 87.2% | 88.3% | 89.9% | +2.7pt |
| All properties (N=209) | 59.2% | 67.5% | 73.6% | +14.4pt |
Latest observation is 22 days out for Oct 3 and 21 days out for Oct 2. Source: compiled by the HotelBank Editorial Team from MetroEngines Research
What stands out is that the size of the gain and the level at landing run in opposite directions. For business hotels, Friday added +19.1pt from T-45 to the latest reading, nearly double Saturday’s +10.7pt. Judged on slope alone, Friday is the day that “moves.” But because it starts low, it is still only at 76.5% with three weeks to go. Saturday, by contrast, added +10.7pt on top of a high 85.7% starting point to reach 96.4%. In other words, Saturday demand was already all but locked in a month and a half before the stay date.
The share of sold-out properties (those with no listed inventory visible on OTAs and other channels) is equally contrasting. For business hotels on Saturday, October 3, 33.3% of properties had no visible listed inventory at T-45, rising to 68.3% at the latest reading — two properties in three are no longer releasing rooms. Friday, October 2 sits at 3.3% at T-45 and 3.3% at the latest reading, essentially unchanged. On Friday, inventory is still broadly available in the numbers. Why occupancy level and the spread of sell-outs do not move together is a separate question: markets divide into a “fill broadly and thinly” pattern and a “sell out early” pattern, and the two produce very different pricing room even at identical occupancy.
City hotels (N=10 properties / 1,047 rooms) take a different shape from business hotels. Saturday starts at 95.2% at T-45, leaving no headroom that could reasonably be called a curve. Friday starts at 87.2%, dips briefly below 85% at one point (a move that looks like additional listed allotment being released), and ends at 89.9%. Miyagi city hotels are structurally pinned to a high level early, regardless of day of week. With N=10 properties, though, the base is small and the figures should be read as having a wide margin of variation.
As background to demand concentrating on the Saturday of that first October week, events are confirmed. Saturday, October 3, 2026 hosts a major arena concert at Xebio Arena Sendai (opening night of BUMP OF CHICKEN TOUR 2026, a two-day run with Sunday, October 4), and the Sendai Classical Music Festival 2026 (Sen-Cla) runs across multiple venues in the city from Friday, October 2 through Sunday, October 4. The latter, however, spans Friday, Saturday and Sunday, so it does not by itself explain the 28.3-point Friday-to-Saturday gap. Because the data in this article cannot isolate the contribution of events numerically, the discussion below makes no quantitative claim about event effects and treats the pattern as a day-of-week structure. On dates in Miyagi where event demand clearly does bite, the opening day and second day of the 2026 Jozenji Street Jazz Festival diverged sharply on the same T-45 basis.
Three curve types — “Saturday,” “Friday,” and “mid-holiday”
Two days in October are not enough to tell whether this is a standing structure in Miyagi or a one-week phenomenon. So two September stay dates are placed alongside them as controls: Saturday, September 19 and Monday, September 21, 2026. These are the first day and the middle of the five-day run from Saturday, September 19 through Wednesday, September 23 (in 2026, September 22 fell between Respect for the Aged Day on September 21 and the Autumnal Equinox on September 23, becoming a citizens’ holiday and creating the five-day break).
Miyagi business hotels, estimated OCC (OTA-listed inventory basis) / fixed cohort of N=59–60 properties. Source: compiled by the HotelBank Editorial Team from MetroEngines Research
The four curves fall clearly into three types.
First, the “Saturday type.” Saturday, September 19 was at 89.3% at T-45, 98.5% at T-30, and 98.8% at the latest reading (8 days out). Saturday, October 3 traces 85.7% → 92.0% → 96.4% — a few points lower in level but almost the same shape. Both are around 90% at T-45, leaving only about ten points to add after that. For Saturday, the volume to be sold is essentially fixed by T-45.
Second, the “Friday type.” Friday, October 2 traces a gentle straight line from 57.4% at T-45 and is still at 76.5% with 21 days to go. The curve has no inflection point; it accumulates steadily at roughly 0.8 points a day. Combined with a sell-out rate that does not move from 3.3% at either T-45 or the latest reading, Friday is not a day that dries up early — it is the day that keeps rooms available to the end.
Third, the “mid-holiday type.” Monday, September 21 started at 62.2% at T-45, a Friday-like starting point, yet reached 80.3% at T-30 and 99.8% with 15 days to go — settled all at once, right at the end. That is +37.6 points from T-45 to 10 days out. The sell-out rate jumped from 11.7% to 91.7%. For demand on a day in the middle of a holiday run, the T-45 number tells you nothing about the true level.
Mixing the three types together into “October weekends are strong” leads to bad decisions. For Saturday, the T-45 number is close to the conclusion itself; for the mid-holiday weekday, the T-45 number carries almost no information. Friday sits in between: large gains, low ceiling. The same “upward-sloping booking curve” calls for completely different revenue management moves.
Where each day of week lands — Friday’s ceiling is 2.4 points below Saturday’s
So where does Friday finally end up? Averaging actual OCC by day of week for Miyagi business hotels over the past three months (June, July and August 2026; 92 days in total, N=56–58 properties) gives the following shape.
Miyagi business hotels, day-of-week averages of daily actuals for June–August 2026 (92 days, N=56–58 properties). Source: compiled by the HotelBank Editorial Team from MetroEngines Research
Saturday 94.4%, Thursday 93.9%, Wednesday 92.0%, Friday 92.0%, Tuesday 90.2%, and Monday and Sunday both at 83.1%. The three-month average is 89.7%. As one would expect of business hotels in the Sendai area, midweek (Wednesday and Thursday) runs close to Saturday, while Sunday and Monday fall more than ten points — the classic shape of business demand.
What matters is the difference in sell-out rates. On Saturday, 43.4% of properties reach the point of having no visible listed inventory, against 22.5% on Friday and 30.7% on Thursday. Friday therefore reaches a high level of 92.0% while only about half as many properties as Saturday go all the way to sold out. The market as a whole fills up, but individual properties keep rooms to the end — that is the real picture of Friday.
Reading Friday, October 2’s 76.5% (21 days out) against those actuals, there is still 15.5 points of room relative to the 92.0% Friday average of the past three months. Given that Friday-type curves accumulate at around 0.8 points a day, that level is within range over the remaining three weeks. This is the market average, however; whether your own property is accumulating at the same pace is a separate question.
Measuring the same weekend across seven prefectures — the “Saturday type” exists without events too
Everything so far has been about Miyagi. As noted above, Sendai has both a major concert and a music festival falling on Saturday, October 3. So is that day’s high progress driven by events, or by day-of-week structure? As material for separating the two, the same two stay dates (October 2 and October 3, 2026) are lined up for business hotels across the six Tohoku prefectures plus Niigata, on the same observation dates and the same calculation basis.
| Prefecture (N / rooms) | Saturday, October 3 | Friday, October 2 | Sat − Fri at T-45 |
||||
|---|---|---|---|---|---|---|---|
| T-45 | Latest | Sell-out rate T-45 → latest |
T-45 | Latest | Sell-out rate T-45 → latest |
||
| Miyagi (N=60 / 8,658 rooms) | 85.7% | 96.4% | 33.3% → 68.3% | 57.4% | 76.5% | 3.3% → 3.3% | +28.3pt |
| Iwate (N=33 / 4,674 rooms) | 83.3% | 92.0% | 30.3% → 45.5% | 49.7% | 65.4% | 0.0% → 0.0% | +33.6pt |
| Yamagata (N=24 / 2,018 rooms) | 87.6% | 95.3% | 41.7% → 62.5% | 56.7% | 73.9% | 0.0% → 0.0% | +30.9pt |
| Akita (N=23 / 1,857 rooms) | 81.9% | 91.1% | 52.2% → 56.5% | 62.4% | 67.3% | 0.0% → 0.0% | +19.5pt |
| Aomori (N=39 / 4,753 rooms) | 74.0% | 88.4% | 41.0% → 56.4% | 65.2% | 85.2% | 17.9% → 46.2% | +8.8pt |
| Fukushima (N=50 / 5,792 rooms) | 57.4% | 70.1% | 10.0% → 14.0% | 50.0% | 62.4% | 2.0% → 2.0% | +7.4pt |
| Niigata (N=48 / 5,858 rooms) | 58.2% | 69.0% | 12.5% → 16.7% | 57.5% | 68.5% | 10.4% → 10.4% | +0.7pt |
Estimated OCC (OTA-listed inventory basis), calculated on each prefecture’s fixed cohort. Source: compiled by the HotelBank Editorial Team from MetroEngines Research
The seven prefectures split cleanly into two groups. Miyagi (+28.3pt), Iwate (+33.6pt), Yamagata (+30.9pt) and Akita (+19.5pt) show a gap of roughly 20 points or more between Saturday and Friday at T-45. In Fukushima (+7.4pt), Niigata (+0.7pt) and Aomori (+8.8pt), that gap is under 10 points. In Niigata — Saturday 58.2%, Friday 57.5% — the distinction between days of week barely exists at the 45-day mark.
The important point here is that Iwate (+33.6pt) and Yamagata (+30.9pt), both beyond the reach of Sendai’s events, show a larger Saturday-to-Friday gap than Miyagi (+28.3pt). The structure in which only Saturday is settled at T-45 holds without the October 3 concert or music festival. Events may well be lifting Miyagi’s level on that particular day, but the pattern of Saturday being decided at T-45 exists independently of them.
A second thing worth reading is that a small gap does not mean weak demand. Fukushima and Niigata land at 70.1% and 69.0% on Saturday at the latest reading — more than 25 points below Miyagi’s 96.4%. Neither Saturday nor Friday is settled at T-45 in those two prefectures; their decision deadline simply sits later. In Miyagi, Iwate and Yamagata, Saturday inventory thins out early, and Miyagi’s sell-out rate reaches 68.3% at the latest reading — the highest of the seven prefectures.
The practical implication is straightforward. An operator with properties in several prefectures who circulates a single standard “T-45 progress report” to all of them will have Miyagi, Iwate and Yamagata staring at numbers for Saturdays whose deadline has already passed, while Fukushima and Niigata are forced into decisions on numbers that are still too early. For properties in Miyagi, the case for treating T-45 as the decision deadline for Saturdays is confirmed even when viewed across prefectures.
Settled months for ADR estimates: Miyagi business hotels have run consistently above the prior year
The price side is worth checking too. Miyagi’s settled ADR estimate (the transacted price level estimated from OTA and other sales data, tax-excluded equivalent) is compared against the same month a year earlier, settled month against settled month.
Miyagi business hotels, settled ADR estimate (settled values). N=139–143 properties. Source: compiled by the HotelBank Editorial Team from MetroEngines Research
| Month | Business 2025 | Business 2026 | YoY | City 2026 | YoY |
|---|---|---|---|---|---|
| May | ¥7,454 | ¥8,027 | +7.7% | ¥10,648 | +15.3% |
| June | ¥6,990 | ¥7,107 | +1.7% | ¥8,312 | −3.7% |
| July | ¥7,331 | ¥7,952 | +8.5% | ¥9,303 | −11.5% |
| August | ¥8,116 | ¥8,642 | +6.5% | ¥10,903 | +7.7% |
| Jan–Aug average | ¥7,013 | ¥7,671 | +9.4% | ¥9,708 | +10.0% |
All comparisons are settled values against settled values. Business N=139–143 properties, city N=20–21 properties. Source: compiled by the HotelBank Editorial Team from MetroEngines Research
Business hotels exceeded the prior-year month in all eight months from January to August 2026, averaging +9.4%. August, the most recent settled month, came in at ¥8,642, up 6.5% year on year. City hotels dipped negative in June (−3.7%) and July (−11.5%) but still grew +10.0% on the January–August average. The Miyagi market has therefore been running above the prior year not only on occupancy but on rate. In July the two property types moved in opposite directions on rate — city down 11.5% while business rose 8.5% — a divergence that speaks directly to the order in which rate strategy should be revisited by segment.
For reference, the settled ADR estimate for October 2026 currently reads ¥10,963 for business (N=135 properties) and ¥13,169 for city (N=21 properties). These are estimates based on the current sales position, however, and are calculated on a different basis from settled values, so a direct comparison with settled figures should wait for month-end settlement. It is too early to discuss October’s level against the prior year.
Three landing scenarios for Friday — how far can a rate cut be recovered?
Everything so far has been observed progress. Revenue management has to translate that into “where does it land” and “what do we do with rate.” Friday, October 2 stands at 76.5% with 21 days to go. Three scenarios are set by applying the observed range of the 13 Fridays over the past three months (88.0–97.5%, median 92.5%).
| Scenario | Estimated OCC at landing | Gain needed in the remaining 21 days |
Required pace | Reference RevPAR | Basis of the range |
|---|---|---|---|---|---|
| Pessimistic | 88.0% | +11.5pt | 0.55pt/day | ¥7,605 | Friday, July 10, 2026 / lowest of the 13 days in the past three months |
| Mid | 92.5% | +16.0pt | 0.76pt/day | ¥7,994 | Median of the 13 days in the past three months |
| Optimistic | 97.5% | +21.0pt | 1.00pt/day | ¥8,426 | Friday, June 12, 2026 / highest of the 13 days in the past three months |
Source: compiled by the HotelBank Editorial Team from MetroEngines Research
The observed pace for Friday, October 2 from T-45 to the latest reading is 0.80 points a day. Continuing that for the remaining 21 days gives 93.2% — above the mid case (92.5%) but short of the optimistic one. The current pace is, in other words, consistent with a standard market Friday. Which also means that beating it requires accumulation above the market average, and that leads straight to the question of whether it can be done without cutting rate.
So reference RevPAR is drawn on two axes, rate and sell-through. Rate is anchored on the August 2026 settled ADR estimate of ¥8,642 — the most recent month with settled values — and flexed ±10%. Sell-through spans 86.0–98.0%, straddling the Friday landing range.
| Estimated OCC at landing \ rate | -10% ¥7,778 | -5% ¥8,210 | +0% ¥8,642 | +5% ¥9,074 | +10% ¥9,506 |
|---|---|---|---|---|---|
| 86.0% | ¥6,689 | ¥7,061 | ¥7,432 | ¥7,804 | ¥8,175 |
| 89.0% | ¥6,922 | ¥7,307 | ¥7,691 | ¥8,076 | ¥8,461 |
| 92.0% | ¥7,156 | ¥7,553 | ¥7,951 | ¥8,348 | ¥8,746 |
| 95.0% | ¥7,389 | ¥7,799 | ¥8,210 | ¥8,620 | ¥9,031 |
| 98.0% | ¥7,622 | ¥8,046 | ¥8,469 | ¥8,893 | ¥9,316 |
Reference RevPAR is the product of the settled ADR estimate and estimated OCC. Because the populations behind rate (N=142 properties) and sell-through (N=56–58 properties) do not match, the table is intended for reading sensitivity, not levels. Source: compiled by the HotelBank Editorial Team from MetroEngines Research
One thing comes out of this table. Cutting rate by 5% on Friday requires +4.8 points of sell-through (to 96.8%) just to hold reference RevPAR. Of the 13 Fridays in the past three months, exactly one reached 96.8% or above (97.5%). A 10% cut would require 102.2% — unreachable by definition.
Saturday is harder still. Combining the Saturday three-month average with the same rate gives a reference RevPAR of ¥8,158. Holding that level after a 5% rate cut would require 99.4%, while the highest of the 13 Saturdays in the past three months was 98.8%. In short, for Miyagi business hotels, last-minute weekend discounting cannot be recovered through volume. The structure identified at the top of this article — Saturday is settled at T-45 — carries the same meaning as: discounting is structurally not an available move.
The same table reads in the other direction too. Raising rate by 5% leaves a floor of 87.6% (−4.4 points) for holding reference RevPAR. The bottom of Friday’s observed range, 88.0%, sits just above that. So Friday has design room for a 5% increase without reference RevPAR falling below the base within the observed range. That is the market-wide distribution, of course, and is no guarantee of your own property’s price elasticity.
For revenue managers running business and city hotels in Miyagi — implications and an action plan
(a) Operational insights
1. There is a case for testing whether Saturday can be treated as having a T-45 deadline. Saturday, October 3 was at 85.7% at T-45 and Saturday, September 19 at 89.3%. The Saturday decision is essentially over by 45 days out. If your own Saturdays sit well below the market’s 85–89% range at T-45, plan backwards on the assumption that only about +10.7pt of further build is available at market pace. If you are running above the market range, that is a basis for raising rate at T-45.
2. Do not take comfort in the size of Friday’s gain. Friday, October 2’s +19.1pt is nearly double Saturday’s, but it lands at 76.5% (21 days out) against Saturday’s 96.4%. The practical read is not the slope of the curve but the distance to the 92.0% three-month Friday average. The sell-out rate — 43.4% on Saturday against 22.5% on Friday — also shows that Friday tends to keep rooms available to the end.
3. Do not judge mid-holiday weekdays on the T-45 number. Monday, September 21 (a public holiday) ran from 62.2% at T-45 to 99.8% just before arrival, +37.6pt. From the same roughly 62% starting point, an ordinary Friday (57.4% to 76.5%) lands somewhere completely different. Build a step into daily operations that classifies the calendar attribute first — mid-holiday weekday or standalone weekday — and reads the curve afterwards.
4. Rate has been running above the prior year. The business settled ADR estimate exceeded the prior-year month in every month from January to August 2026, averaging +9.4%. Rather than holding rate flat because occupancy is high, there is room to make the market’s year-on-year upward movement the starting point for your own rate revisions.
5. “T-45 is the deadline” is the Miyagi, Iwate and Yamagata pattern — not a rule for all of Tohoku. Taking the T-45 Saturday-minus-Friday gap on the same two dates gives Iwate +33.6pt, Yamagata +30.9pt, Miyagi +28.3pt and Akita +19.5pt, against Niigata +0.7pt and Fukushima +7.4pt. Given that Iwate and Yamagata — beyond the reach of Sendai’s events — exceed Miyagi, the structure of Saturday settling at T-45 is confirmed independently of events. An operator with properties in several prefectures who circulates one standard T-45 progress report will have Miyagi, Iwate and Yamagata looking at post-deadline numbers while Fukushima and Niigata are pushed into decisions too early. There is room to design decision deadlines prefecture by prefecture.
6. Last-minute weekend discounting cannot be recovered through volume. Holding reference RevPAR after a 5% rate cut requires +4.8 points on Friday (96.8%) and +5.0 points on Saturday (99.4%). In the observed data for the past three months, 96.8% or above was reached on 1 of 13 Fridays, and 99.4% or above on 0 of 13 Saturdays. A 10% cut would require 102.2% on Friday — unreachable by definition. A policy of not discounting Saturdays at the last minute is supported by this sensitivity. In the other direction, a 5% increase leaves a floor of 87.6% on Friday for holding reference RevPAR, sitting just below the 88.0% bottom of the observed range.
(b) Action plan
| Time frame | Action | Decision trigger | Intent |
|---|---|---|---|
| T-45 (Saturday deadline) | Finalize Saturday rate and minimum length of stay | If your Saturday progress is above the market’s T-45 range (business 85.7–89.3%) | Shift to a design that holds the remaining +10.7pt of rooms at a higher rate |
| Reclassify the calendar into three attributes: Saturday / Friday / mid-holiday weekday | When the target month contains a mid-holiday weekday (the Sep 21 pattern: 62.2% at T-45 to 99.8% just before arrival) | Avoid the mistake of discounting on a low T-45 number | |
| T-30 (Friday’s decisive window) | Review Friday inventory allocation and distribution channels | If your Friday is below the market’s 68.5% at T-30 | Secure a pace of roughly 0.8pt a day to bring the 92.0% Friday average within range |
| Move remaining Saturday rooms into higher-rate products | If you still hold Saturday inventory while the market’s Saturday sell-out rate has reached 46.7% at T-30 | Avoid leaving low-rate rooms on sale as supply thins | |
| T-14 (handling the run-up) | Make the final call on remaining Friday rooms | If your Friday remains well below the market’s latest level of 76.5% | Decide once, either to wait for the late pickup or to fill for certain |
| Adopt a policy of not discounting Saturdays at the last minute | When market Saturday progress is running at 96.4% with a 68.3% sell-out rate at the latest reading | Sell the final few rooms without giving up rate |
Source: compiled by the HotelBank Editorial Team from MetroEngines Research
None of these guarantees a result; suitability depends on your own product mix, guest profile and location. What is offered here is a framework for deciding which market numbers to check your own figures against.
Summary — four yardsticks for measuring a Miyagi weekend
1. Classify days by their T-45 level. For business hotels, above 85% at T-45 means the Saturday type (already settled); 55–65% means either the Friday type or the mid-holiday type. Those two land more than 20 points apart despite identical T-45 numbers, so separate them by calendar attribute first.
2. Read the distance to the destination, not the gain. Friday, October 2’s +19.1pt is larger than Saturday, October 3’s +10.7pt, but it lands 20 points lower. Set the three-month day-of-week averages (Sat 94.4%, Fri 92.0%, Thu 93.9%, Mon and Sun 83.1%) as your target and judge by the distance from them.
3. Use the sell-out rate to measure how market supply is thinning. Saturday inventory dries up from 33.3% at T-45 to 68.3% at the latest reading, while Friday does not move from 3.3%. For the same rise in occupancy, the rate you can hold depends on whether competitors still have rooms on sale.
4. Decide whether a move is viable on the iso-RevPAR line before making it. Anchored on the August 2026 settled ADR estimate of ¥8,642, filling a 5% rate cut with volume requires 96.8% on Friday and 99.4% on Saturday. Both sit near the top of the observed distribution of the past three months, and a 10% cut would require 102.2% on Friday — unreachable. Once you know discounting is not available, the T-45 decision narrows to where to fix rate.
Miyagi’s business hotel market has grown rate, with the settled ADR estimate running +9.4% year on year on the January–August 2026 average. Precisely because the day-of-week structure of occupancy is so clear, this is also a market where the difference in how many days ahead you act, on which day of week, shows up directly as a difference in revenue.
About the data
- Definition of estimated OCC (OTA-listed inventory basis): occupancy on an OTA-listed inventory basis = 100 − 100 × rooms still listed on OTAs ÷ total rooms. The scope is a fixed cohort of properties listing at least 30% of their total rooms on OTAs (the same set of properties on every stay date). It is an estimate based on how listed inventory is being sold down and differs by definition from actual room occupancy (it reads high, because rooms never listed are counted on the sold side).
- Booking curves: based on observations from 45 days before the stay date through the latest reading. The stay dates covered are October 2, October 3, September 19 and September 21, 2026. Observation coverage is 100% at every point.
- Definition of the settled ADR estimate: the transacted price level (tax-excluded equivalent) estimated from OTA and other sales data (lowest-plan level × property-type coefficient, ensembled across multiple channels). Past months are settled values; the current and future months are estimates based on the current sales position. Median error against published operating results is 6.6%.
- Breakdown of N: booking curves = Miyagi business hotels N=60 properties / 8,658 rooms (September 19 only, N=59 properties / 8,540 rooms), city hotels N=10 properties / 1,047 rooms, all properties N=208–209 / 14,014 rooms (all fixed cohorts on a major-booking-site listing basis). Day-of-week actuals = 92 days of daily actuals for June–August 2026, N=56–58 properties. Settled ADR estimate = business N=139–143 properties, city N=20–21 properties (current estimates for October 2026 are business N=135 properties, city N=21 properties).
- The five-day break in September 2026: September 22 fell between Respect for the Aged Day (September 21) and the Autumnal Equinox (September 23), becoming a citizens’ holiday and creating a five-day break from Saturday, September 19 through Wednesday, September 23.
- Data as of September 12, 2026. Sales positions and inventory change daily, so the figures in this article are a snapshot as of retrieval.
References and sources
■ Data sources
Booking curves are fixed-cohort aggregations tracking listed inventory on major booking sites daily from 45 days before the stay date through the latest reading, for business hotels, city hotels and all properties in Miyagi, the six Tohoku prefectures and Niigata (stay dates October 2, October 3, September 19 and September 21, 2026; retrieved September 12, 2026). Day-of-week actuals are 92 days of daily aggregations for Miyagi business hotels in June–August 2026 (N=56–58 properties). Settled ADR estimates are monthly aggregations for the business and city segments in Miyagi (January 2025 to December 2026, retrieved the same day). Holiday dates and the establishment of the citizens’ holiday follow published Cabinet Office material. Event dates were confirmed on public information from Miyagi Prefecture and the City of Sendai and on each organizer’s official site.
■ Assumptions
Progress comparisons use only observations within a 45-day lead time (beyond 45 days, readings may include periods before listed allotments have been loaded and therefore may not represent booking progress). Cross-prefecture comparisons use identical stay dates, identical observation dates and an identical calculation basis for every prefecture. The landing scenarios assign the observed distribution of the 13 Fridays in June–August 2026 (low 88.0%, median 92.5%, high 97.5%) to the pessimistic, mid and optimistic cases; they are an application of an observed range, not a forecast. Reference RevPAR is the product of the settled ADR estimate and estimated OCC, with rate fixed at August 2026 (¥8,642), the most recent month with a settled value. Because the populations behind rate (N=142 properties) and sell-through (N=56–58 properties) do not match, it is used only to read sensitivity, not levels. The October 2026 settled ADR estimate is based on the current sales position and is not used in any ratio calculation against settled values.
■ Limitations and caveats
Estimated OCC is an estimate based on how OTA-listed inventory is being sold down and reads higher than actual room occupancy, because rooms never listed are counted on the sold side. The sell-out rate is the share of properties with no visible listed inventory and does not mean an actual full house (withdrawing a listing produces the same value). City hotels have a small base at N=10 properties, so single-day variation is large. Day-of-week averages cover 92 days in June–August and therefore embed seasonality (there is no guarantee that October levels match them). The contribution of the events falling on October 3 cannot be isolated with the data in this article, and the cross-prefecture comparison is material for confirming whether the structure exists, not an estimate of event effects. Figures are a snapshot as of retrieval, and sales positions and inventory change daily.
- Cabinet Office, “About National Holidays” (confirmation of the 2026 dates for Respect for the Aged Day and the Autumnal Equinox)
- Miyagi Prefecture official website, event information (confirmation of events in early October 2026)
- City of Sendai official website (city event calendar)
- Jozenji Street Jazz Festival official site (confirmation of the 2026 dates)
- Sendai Classical Music Festival 2026 (Sen-Cla) official site (confirmation of the October 2–4, 2026 dates)
- BUMP OF CHICKEN official site, “BUMP OF CHICKEN TOUR 2026” performance details (confirmation of the October 3–4, 2026 shows at Xebio Arena Sendai)