

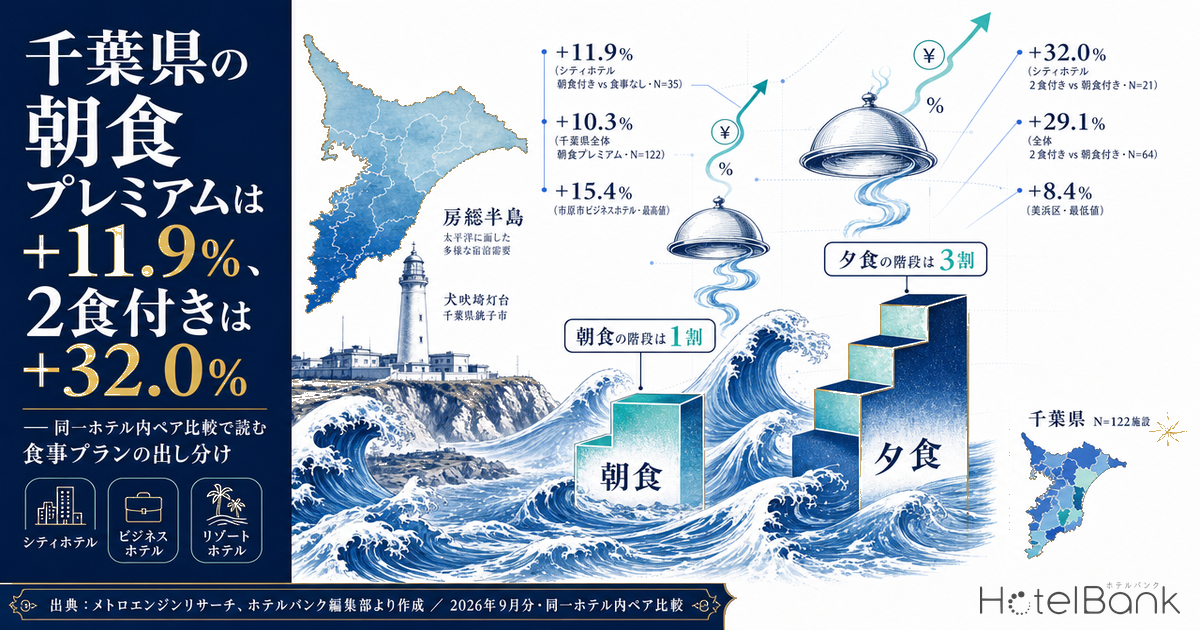
For hotels in Chiba, we measured meal premiums using “paired comparison” — matching plans within the same hotel that differ only in their meal conditions. For September 2026, the margin by which a room with breakfast exceeds a room-only rate is +11.9% (N=35 properties) at city hotels and +11.0% (N=53 properties) at business hotels: different property types, yet both converge on the 11% range. The margin by which half-board (breakfast and dinner) exceeds breakfast-only, by contrast, widens to +32.0% (N=21 properties) at city hotels, +23.6% (N=15 properties) at business hotels and +30.9% (N=13 properties) at resort hotels — close to three times the breakfast figure. The reality of the Chiba market is that meal plans are not designed around “what price to sell breakfast at”, but as two entirely different price ladders for breakfast and for dinner.
Scope: city, business and resort hotels in Chiba (only properties selling multiple meal conditions within the same hotel), N=122 properties (September 2026, all-type pairs). Price figures in this article are Estimated Settled ADR (the transacted price level estimated from OTA and other sales data, tax-exclusive equivalent); occupancy is an estimate based on OTA-listed inventory. Definitions for both appear at the end of the article. Data as of 4 September 2026.
- — The breakfast premium converges on roughly 10% regardless of property type (Chiba, September 2026, all types +10.3%, N=122 properties). City +11.9%, business +11.0%, resort +8.8% — a spread of barely more than three points.
- — Half-board jumps to a different level against breakfast-only: +29.1% across all types (N=64 properties). The breakfast step is 10%, the dinner step is 30% — there is no reason to price them on the same logic.
- — Even within Chiba, municipalities range from +8.4% to +15.4%, close to a two-fold gap. Because the relative value of in-house breakfast is set by the surrounding dining environment, the prefectural average is only a starting point for benchmarking.
- — Lined up against the five Greater Tokyo prefectures, Chiba’s breakfast premium ranks second behind Tokyo (all types +10.3%; Tokyo +13.3%; Kanagawa and Ibaraki +6.2%). Among business hotels, Chiba’s +11.0% is effectively level with Tokyo’s +11.3%.
- — Overlay a second axis — occupancy — on the premium. Estimated OCC for business hotels runs from 81.0% on Mondays to 93.0% on Saturdays (July 2026), so the same +11% carries a very different operational load depending on the day.
Why “paired comparison within the same hotel”
Comparing price differences by meal condition using a simple market-wide average gives the wrong answer. Properties built around breakfast-inclusive plans and properties centred on room-only sales differ in location, room scale and guest mix to begin with, so the gap between averages reflects “differences in property composition” rather than “how breakfast is priced”.
This article therefore takes a different approach: only where the same hotel sells both room-only and breakfast-inclusive plans in the same month do we take the difference within that property, then aggregate across properties. Every premium is calculated using only this paired set of properties. The denominator is the number of properties (properties where a pair was established), and it is stated as N= alongside every figure in this article. Segments with N<5 are not cited.
Ryokan (traditional Japanese inns) are also excluded from the aggregation, because half-board is their default sales format and the question “how does it differ from room-only” barely applies.
Breakfast sits around 11%; adding dinner moves it up a level
The chart below lines up the premium by property type for Chiba in September 2026. Breakfast-inclusive versus room-only: city +11.9% (N=35 properties), business +11.0% (N=53 properties), resort +8.8% (N=17 properties), all types +10.3% (N=122 properties). The spread between property types stays at barely more than three points, and the breakfast uplift forms a common market norm of roughly 10% across Chiba.
Move to half-board versus breakfast-only, however, and the level shifts up a rung: city +32.0% (N=21 properties), resort +30.9% (N=13 properties), business +23.6% (N=15 properties), all types +29.1% (N=64 properties). Seen from room-only, half-board reaches +46.5% at city hotels (N=21 properties), +41.3% at resorts (N=13 properties), +38.3% at business hotels (N=15 properties) and +40.0% across all types (N=64 properties). The breakfast step is 10%, the dinner step is 30%. Even under the same label of “meals included”, the scale of uplift the market tolerates is different.
Source: Compiled by the HotelBank Editorial Team from MetroEngines Research data
| Property type | Breakfast vs room-only | Half-board vs breakfast | Half-board vs room-only | Dinner vs room-only |
|---|---|---|---|---|
| City hotels | +11.9% (N=35) | +32.0% (N=21) | +46.5% (N=21) | +36.9% (N=10) |
| Business hotels | +11.0% (N=53) | +23.6% (N=15) | +38.3% (N=15) | +29.6% (N=6) |
| Resort hotels | +8.8% (N=17) | +30.9% (N=13) | +41.3% (N=13) | Not shown (N<5) |
| All types | +10.3% (N=122) | +29.1% (N=64) | +40.0% (N=64) | +39.4% (N=25) |
Chiba, September 2026, in-hotel paired comparison (ryokan excluded) / Source: Compiled by the HotelBank Editorial Team from MetroEngines Research data
What stands out is that the half-board premium at business hotels, at +23.6% (N=15 properties), sits six to eight points below the other property types. Only 15 business hotels in Chiba sell dinner at all, so the paired base is small, and many of them tend towards a simple dinner offering. The fair reading is that dinner is not something that “adds 30% just by being offered” — it becomes a 30% step only when the content and the operation behind it are there to support it.
The breakfast premium moves month to month — May to September
The premium is not fixed. Tracking breakfast-inclusive versus room-only from May 2026 through September 2026, city hotels rose 2.5 points from +10.6% in May (N=35 properties) to +13.1% in June (N=35 properties), then eased back gradually through July at +12.8% (N=35 properties), August at +12.6% (N=35 properties) and September at +11.9% (N=35 properties). Business hotels ran +10.3% in May (N=52 properties), +13.2% in June (N=54 properties), +10.6% in July (N=56 properties), +11.5% in August (N=55 properties) and +11.0% in September (N=53 properties) — converging back to around 11% after a pronounced June peak. Resort hotels held a consistently lower band of 8.1% to 10.2% (N=16-17 properties).
Because the number of paired properties stays almost constant, this movement reflects changes in pricing within the same set of properties, not turnover in the properties covered. June produced a peak in both property types simultaneously, revealing a pricing habit: the weaker the demand month, the more the room-only side is discounted and the wider the gap to breakfast-inclusive becomes.
Source: Compiled by the HotelBank Editorial Team from MetroEngines Research data
This reading is consistent with the movement in Estimated Settled ADR. For Chiba city hotels, the Estimated Settled ADR for June 2026 is a confirmed ¥9,900-range figure (N=52 properties) — the lowest of the year so far — and July 2026 was ¥10,100 (N=53 properties, confirmed). The same month a year earlier, July 2025, was ¥11,000 (N=51 properties, confirmed), making the confirmed-to-confirmed year-on-year change -8.2%. Business hotels were at ¥7,700 in July 2026 (N=163 properties, confirmed) against ¥7,900 in July 2025 (N=161 properties, confirmed), a year-on-year change of -2.0%. When room-only rates are soft, a design that supports spend per guest through a separate revenue source — meals — tends to work well.
Split by area, a near two-fold gap — Narita and Ichihara versus central Chiba
Break the prefecture down further by municipality and the breakfast premium varies widely even within Chiba. Lining up the areas where pairs were established for at least five properties in September 2026, the top of the table is business hotels in Ichihara at +15.4% (N=8 properties), city hotels in Narita at +13.8% (N=11 properties), Narita across all types at +13.5% (N=16 properties) and Urayasu across all types at +13.4% (N=12 properties). At the low end are Mihama Ward across all types at +8.4% (N=9 properties), Chuo Ward across all types at +8.6% (N=10 properties) and business hotels in Chuo Ward at +9.0% (N=7 properties).
Source: Compiled by the HotelBank Editorial Team from MetroEngines Research data
Between Ichihara and Mihama Ward the premium differs by seven points. The pattern visible in the numbers can be read as follows: the fewer the dining options nearby, the more value breakfast carries as something completed inside the property, whereas in central Chiba City and around Makuhari, where restaurants are densely clustered, in-house breakfast competes with outside options. Using “the prefectural average of +10.3%” as your own property’s benchmark can therefore be off by several points depending on location.
Second in Greater Tokyo — comparison with four neighbouring prefectures
The internal breakdown alone cannot tell you whether the +10.3% level is itself high or low. The table below applies the same method (in-hotel paired comparison, September 2026, ryokan excluded) across the five Greater Tokyo prefectures.
For breakfast-inclusive versus room-only at the whole-prefecture level, Tokyo is highest at +13.3% (N=466 properties), followed by Chiba at +10.3% (N=122 properties). Saitama is at +8.9% (N=73 properties), and Kanagawa and Ibaraki are both at +6.2% (N=165 and N=103 properties respectively) — placing Chiba second within Greater Tokyo.
Split by property type, the picture becomes sharper still. Among business hotels, Chiba’s +11.0% (N=53 properties) is effectively level with Tokyo’s +11.3% (N=358 properties), and well above Kanagawa at +8.2% (N=102 properties), Ibaraki at +8.1% (N=79 properties) and Saitama at +3.0% (N=58 properties). The reading is that Chiba’s business hotels achieve a breakfast uplift on par with central Tokyo. City hotels, on the other hand, give up four to five points to the same property type outside the prefecture: Chiba +11.9% (N=35 properties) against Tokyo +16.6% (N=65 properties) and Kanagawa +14.1% (N=30 properties).
| Prefecture | All types | City hotels | Business hotels | Resort hotels |
|---|---|---|---|---|
| Chiba | +10.3% (N=122) | +11.9% (N=35) | +11.0% (N=53) | +8.8% (N=17) |
| Tokyo | +13.3% (N=466) | +16.6% (N=65) | +11.3% (N=358) | Not shown (N<5) |
| Kanagawa | +6.2% (N=165) | +14.1% (N=30) | +8.2% (N=102) | -2.0% (N=14) |
| Saitama | +8.9% (N=73) | +27.1% (N=11) | +3.0% (N=58) | Not shown (N<5) |
| Ibaraki | +6.2% (N=103) | +9.9% (N=16) | +8.1% (N=79) | Not shown (N<5) |
September 2026, in-hotel paired comparison (ryokan excluded) / Source: Compiled by the HotelBank Editorial Team from MetroEngines Research data
Note, however, that the number of paired properties for city hotels varies considerably by prefecture: Saitama stands out at +27.1% (N=11 properties) but on a small base. The safe approach is to read cross-prefecture comparisons through the all-types and business-hotel figures, where the paired base is large, and treat city hotels as a reference value. Rather than calling the four to five points Chiba’s city hotels concede to other prefectures pure upside, it is closer to reality to read it as a difference in demand structure, as in Narita and Urayasu, where business and leisure demand are mixed.
Occupancy shifts by day of week — where to set the meal operation
Differentiating meal plans is a question of service staffing as well as price. For Chiba in July 2026 (results for the elapsed month), estimated OCC (OTA-listed inventory basis) averaged 85.9% for business hotels (N=137 properties) and 84.3% for city hotels (N=51 properties). Levelled out by day of week, business hotels span 12.0 points from 81.0% on Monday to 93.0% on Saturday, and city hotels span 17.5 points from 76.0% on Monday to 93.5% on Saturday.
| Day | Business hotels, estimated OCC | City hotels, estimated OCC |
|---|---|---|
| Mon | 81.0% | 76.0% |
| Tue | 84.5% | 78.9% |
| Wed | 86.2% | 86.6% |
| Thu | 86.4% | 83.4% |
| Fri | 87.2% | 87.6% |
| Sat | 93.0% | 93.5% |
| Sun | 82.7% | 83.0% |
Chiba, July 2026 (elapsed-month results), estimated OCC (OTA-listed inventory basis) / Source: Compiled by the HotelBank Editorial Team from MetroEngines Research data
Saturday sits in the 93% range for both property types, making it the day of heaviest load on the breakfast room and the kitchen. Monday and Tuesday, by contrast, leave slack in occupancy, so the weight of the cost of serving one meal is entirely different even at the same meal premium. A second axis — occupancy — needs to be laid over the single yardstick of the premium.
For revenue managers running hotels in Chiba — implications and an action plan
(1) Restate your own breakfast premium as a rate, not an amount. Chiba’s breakfast premium is +11.9% at city hotels (N=35 properties), +11.0% at business hotels (N=53 properties) and +10.3% across all types (N=122 properties). Convert the gap you have set between room-only and breakfast-inclusive into a rate, and check where you sit within that band. If you move the room-only price and follow with the same yen amount on the breakfast-inclusive side, the rate collapses automatically.
(2) Take your benchmark from your own area, not the prefectural average. Even within Chiba, business hotels in Ichihara at +15.4% (N=8 properties) and business hotels in Chuo Ward at +9.0% (N=7 properties) are more than six points apart. Because the surrounding dining environment determines the relative value of in-house breakfast, there is no need to adopt the prefectural average as your target.
(3) Design dinner as a separate ladder. Half-board versus breakfast-only runs +32.0% at city hotels (N=21 properties) and +30.9% at resorts (N=13 properties), against +23.6% at business hotels (N=15 properties). Pricing dinner as an extension of breakfast risks leaving on the table the level the market will bear. At the same time, the business-hotel figure shows that a dinner offering without the operation to support it struggles to lift the rate.
(4) The troughs in occupancy are where meal plans earn their keep. Estimated OCC for business hotels is 81.0% on Monday and 93.0% on Saturday (July 2026, N=137 properties). On days like Saturday, when inventory tightens, rooms sell out without meals, while Monday and Tuesday leave room to build spend per guest through meal-inclusive plans. Conversely, on Saturdays when the kitchen is stretched, restricting meal-inclusive inventory is a decision worth considering.
| Time horizon | Action | Decision trigger | Objective |
|---|---|---|---|
| Today to this week | Convert your room-only / breakfast-inclusive / half-board price gaps into rates and list them out | If your breakfast premium falls well below your property-type band (city +11.9% / business +11.0%) | Make pricing gaps visible as rates rather than amounts |
| Today to this week | Replace your benchmark with the level for your own municipality | If the prefecture-wide +10.3% and your area’s level (e.g. Narita all types +13.5% / Chuo Ward all types +8.6%) diverge by three points or more | Build the location factor into your target |
| Within two weeks | Review the allocation of meal-inclusive inventory by day of week | If your Monday and Tuesday occupancy runs below the market level (business hotels 81.0% / 84.5%) | Build spend per guest in the occupancy troughs |
| Within two weeks | Check that your Saturday meal-inclusive inventory cap and kitchen shift plan line up | If Saturday occupancy is approaching the market level (93% range for both property types) | Balance service quality against cost |
| Towards next month | Redesign the dinner-plan uplift on its own terms | If your half-board versus breakfast-only premium remains below the market (city +32.0% / business +23.6%) | Stop pricing dinner as an extension of breakfast |
| Towards next month | Set a rule that maintains the meal-inclusive rate when room-only prices are revised | While Estimated Settled ADR stays soft (city hotels, July 2026, -8.2% year on year) | Preserve headroom to support spend per guest |
Source: Compiled by the HotelBank Editorial Team from MetroEngines Research data
Summary — three yardsticks
First, breakfast and dinner are separate ladders. In Chiba’s in-hotel paired comparison, the breakfast uplift converges on roughly 10% regardless of property type (all types +10.3%, N=122 properties), while half-board runs +29.1% against breakfast-only across all types (N=64 properties) — close to three times as much. There is no reason to price the two on the same logic.
Second, take the rate benchmark from your location. Within the prefecture, municipalities range from +8.4% to +15.4%. Because the relative value of in-house breakfast is set by the surrounding dining environment, the prefectural average is only a starting point.
Third, overlay occupancy as a second axis on the premium. The same +11% carries a different operational load on a day at 93.0% (Saturday) than on one at 81.0% (Monday). A design that differentiates meal plans across three dimensions — cost, service staffing and occupancy band — is what turns the premium into actual revenue.
Metric Definitions Used in This Article
- Definition of estimated OCC (OTA-listed inventory basis): OTA-listed inventory occupancy = 100 − 100 × OTA-listed unsold rooms ÷ total rooms. It is an estimate based on how inventory listed on OTAs is taken up, and is defined differently from actual room occupancy (it runs higher). The day-of-week estimated OCC in this article covers Chiba, July 2026 (results for the elapsed month), with business hotels N=137 properties and city hotels N=51 properties.
- Booking curve: based on observations from 90 days before the stay date up to the most recent point.
- Definition of Estimated Settled ADR: the transacted price level (tax-exclusive equivalent) estimated from OTA and other sales data (lowest-plan level × property-type coefficient, ensembled across multiple channels). Past months are confirmed values; the current and future months are estimates based on sales conditions at this point in time. Cross-checks against published operating results give a median error of 6.6%. The Estimated Settled ADR figures cited in this article use only year-on-year comparisons between confirmed values (Chiba city hotels: July 2026 N=53 properties / July 2025 N=51 properties; business hotels: July 2026 N=163 properties / July 2025 N=161 properties).
- Method for aggregating meal premiums: only where the same hotel sells multiple meal conditions (room-only / breakfast / dinner / half-board) in the same month do we take the difference within that property, then aggregate the premium across properties. A simple average across all hotels is not used, because it embeds bias in property composition. Ryokan are excluded because half-board is their default sales format. N= is the number of properties for which a pair was established in each comparison, and segments with N<5 are not cited. Coverage is Chiba, September 2026 (all types N=122 properties, city N=35 properties, business N=53 properties, resort N=17 properties), with the time series running from May 2026 to September 2026.
- Method for cross-prefecture comparison: the same in-hotel paired comparison described above, applied to Chiba, Tokyo, Kanagawa, Saitama and Ibaraki for the same month (September 2026) under the same conditions (one room, two guests, ryokan excluded). Segments with fewer than five paired properties are not shown.
- Data as of: 4 September 2026. Because sales conditions and inventory change daily, the figures in this article are a snapshot as at the time of retrieval.