

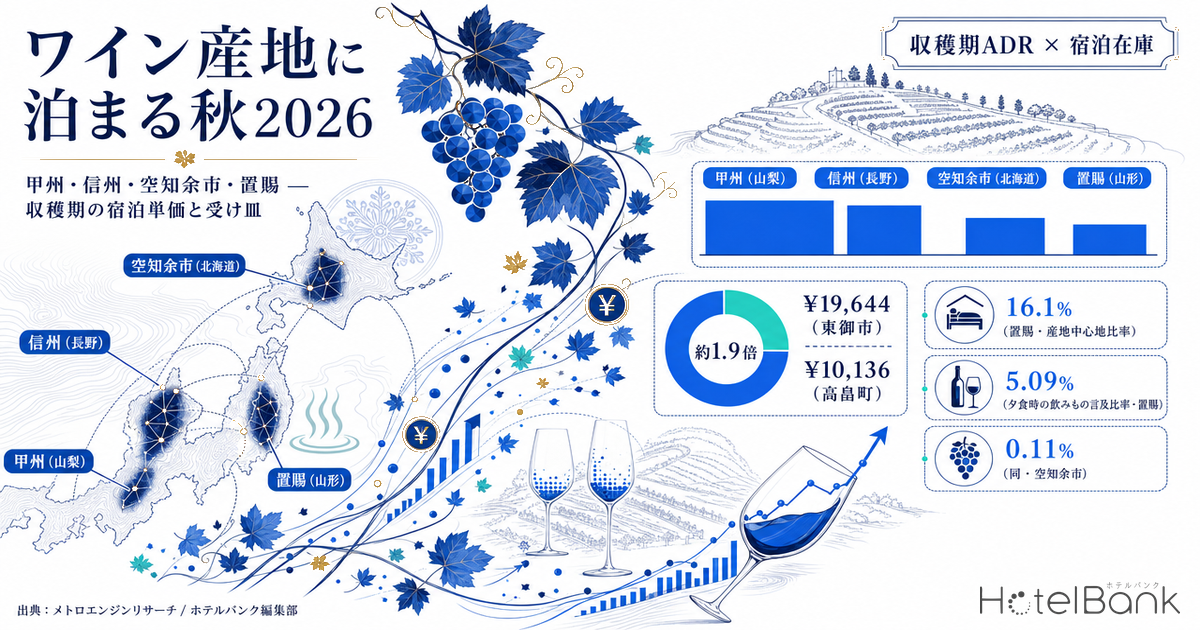
Japan’s major domestic wine regions are becoming destinations for “travel to see the vineyards.” Yet when you try to actually stay in these areas during harvest season, the depth of available options differs enormously from region to region. This article examines four wine areas — Koshu (Yamanashi), Shinshu (Nagano), Sorachi-Yoichi (Hokkaido) and Okitama (Yamagata) — by cross-referencing the prevailing room rates for September–November 2026, which covers the harvest season, against the volume of lodging inventory that actually exists inside each region, in order to draw a numerical picture of what kind of stay each wine region offers.
Metric Definitions Used in This Article
- ADR (Average Daily Rate): An estimated settled rate (tax-exclusive equivalent) calculated by applying property-type correction coefficients to the lowest publicly listed plan level each property offers on OTAs and similar channels (double occupancy, per-room rate, tax-inclusive). Cross-checked against property-level actuals disclosed by listed hotel REITs, the median error is approximately 7% (the cross-check covered 184 property-months of Invincible Investment Corporation for April–May 2026). These are estimates and differ from each property’s actual transacted prices and accounting figures. Area-level ADR is the median of the covered properties and indicates the level of a typical property in that area.
- Listed price: The average price of all plans published on OTAs and similar channels (double occupancy, per room, tax-inclusive). This is a separate metric from ADR.
- Basis of estimation (important): Estimated settled ADR for past months is a value based on finalized observed results, while figures for the current month onward are snapshot values estimated from the listing conditions at the time of the survey. Because the bases differ, this article does not calculate year-on-year comparisons that straddle past months and future months.
- N (sample size): The number of properties covered in the estimated settled ADR calculation. This differs from the number of properties covered in the listed-price aggregation.
- Data source: MetroEngines Research (as aggregated on July 26, 2026)
- — About 1.9x — For the harvest season (October 2026), the highest estimated settled ADR is Tomi City, Nagano at ¥19,644 and the lowest is Takahata Town, Yamagata at ¥10,136. Note, however, that the top entries rest on a thin base of just 2–4 properties.
- — 1.5–4.6% — Inventory at the wine-region cores is small — 135 rooms in Koshu City, 88 in Tomi City, 60 in Yoichi Town and 65 in Takahata Town — and the ratio of those room counts to the neighboring gateway cities stays within this range.
- — 16.1% — Okitama is the exception. With 696 rooms in Kaminoyama City and 205 in Nan’yo City, hot-spring inns cluster inside the wine region itself, and the ratio against Yamagata City is three to ten times that of the other three regions.
- — 9 of 11 municipalities — In the 2025 actuals, the September–November rate index sat within ±7% of the annual average. Annual peaks fell in August and December, meaning the harvest season is not yet the price peak.
- — 5.09% vs 0.11% — The share of guest reviews mentioning beverages at dinner is highest in Okitama and lowest in Sorachi-Yoichi. The four regions split sharply on whether the inn’s dining table has absorbed the context of its wine region.
Prevailing Harvest-Season Rates — 12 Municipalities Across Four Regions, Side by Side
We first lined up the estimated settled ADR for October 2026, the heart of the harvest season, across the 12 main municipalities of the four regions. To keep the comparison fair, all figures use the same basis of estimation (an estimate based on listing conditions at the time of the survey).
The highest is Tomi City, Nagano at ¥19,600, followed by Koshu City, Yamanashi at ¥19,100 and Kaminoyama City, Yamagata at ¥18,900. At the other end, the lowest is Takahata Town, Yamagata at ¥10,100, followed by Yoichi Town, Hokkaido at ¥10,900. The gap between top and bottom widens to roughly 1.9x.
This ranking cannot be read at face value, however. The estimate for Tomi City covers only 2 properties, Koshu City 4 and Yoichi Town 3. Even at the heart of a wine region, lodging inventory itself is so small that the pricing decisions of one or two properties can move the representative value for the whole area substantially. Conversely, Kaminoyama City (16 properties), Ueda City (28) and Fuefuki City (40) rest on a thicker base and their values are more stable.
Source: MetroEngines Research; compiled by the HotelBank Editorial Team
| Region | Municipality | Estimated settled ADR October 2026 | Properties covered (N) |
Operating properties | Rooms |
|---|---|---|---|---|---|
| Koshu (Yamanashi) | Koshu City (Katsunuma) | ¥19,118 | 4 | 13 | 135 |
| Koshu (Yamanashi) | Fuefuki City (Isawa) | ¥14,252 | 40 | 50 | 2,168 |
| Koshu (Yamanashi) | Yamanashi City | ¥14,434 | 4 | 8 | 209 |
| (Gateway city) | Kofu City | ¥11,324 | 32 | 43 | 2,956 |
| Shinshu (Nagano) | Tomi City | ¥19,644 | 2 | 5 | 88 |
| Shinshu (Nagano) | Shiojiri City (Kikyogahara) | ¥15,700 | 10 | 11 | 771 |
| Shinshu (Nagano) | Ueda City | ¥15,023 | 28 | 84 | 2,764 |
| Shinshu (Nagano) | Komoro City | ¥13,585 | 13 | 18 | 526 |
| (Gateway city) | Matsumoto City | ¥15,664 | 93 | 166 | 4,889 |
| Sorachi-Yoichi (Hokkaido) | Yoichi Town | ¥10,900 | 3 | 6 | 60 |
| Sorachi-Yoichi (Hokkaido) | Iwamizawa City | ¥15,034 | 4 | 6 | 218 |
| (Gateway city) | Otaru City | ¥12,726 | 24 | 44 | 1,987 |
| Okitama (Yamagata) | Kaminoyama City (Kaminoyama Onsen) | ¥18,941 | 16 | 35 | 696 |
| Okitama (Yamagata) | Nan’yo City (Akayu) | ¥14,011 | 13 | 13 | 205 |
| Okitama (Yamagata) | Takahata Town | ¥10,136 | 2 | 3 | 65 |
| (Gateway city) | Yamagata City | ¥13,624 | 49 | 58 | 4,313 |
Cells where fewer than 5 properties were covered are shown in red. Operating property counts and room counts are as of July 2026, within the scope tracked by MetroEngines Research.
Source: MetroEngines Research; compiled by the HotelBank Editorial Team
Where the Center of Gravity Lies — Four Structures Told by Room Counts
Room counts speak louder than rates. How many rooms exist in the very place where the wineries cluster, and how many exist in the neighboring city? Put those two numbers side by side and it becomes clear that “how you stay” differs completely from one wine region to the next.
According to official Yamanashi Prefecture statistics, the prefecture has 89 wineries — 18.0% of the national total of 493 — and produces 4,278 kl of Japanese wine, or 29.9% of the national total. Yet Koshu City (the former Katsunuma Town), the heart of that production, has just 13 lodging properties with 135 rooms. Neighboring Fuefuki City to the southwest has 50 properties and 2,168 rooms, and the prefectural capital Kofu City has 43 properties and 2,956 rooms. In other words, lodging demand in the Koshu area is absorbed not on the vineyard hills but by Isawa Onsen and the urban districts of the Kofu Basin.
Shinshu looks somewhat different. Shiojiri City, home to Kikyogahara, has 11 properties and 771 rooms, and Tomi City, the core of the eastern Chikumagawa Wine Valley district, has 5 properties and 88 rooms — both wine-region cores are small. But Ueda City (84 properties, 2,764 rooms) and Matsumoto City (166 properties, 4,889 rooms) provide a double layer of thick capacity within a 30–40 minute radius. An itinerary of visiting the wine region as a “point” while basing yourself in a city arises naturally.
Hokkaido is the clearest case of all. The wineries of Yoichi Town are increasing rapidly, as the town’s own official wine-tourism project describes, but the town has only 6 lodging properties with 60 rooms. Iwamizawa City in Sorachi likewise has 6 properties and 218 rooms. Otaru City, roughly 30 minutes away by rail, has 44 properties and 1,987 rooms. The center of gravity for lodging sits entirely on the Otaru side, and the wine region functions as a day-trip destination.
Okitama is the best balanced of the four. Takahata Town does have only 3 properties and 65 rooms, but Nan’yo City (Akayu Onsen) has 13 properties and 205 rooms and Kaminoyama City (Kaminoyama Onsen) has 35 properties and 696 rooms, giving the region a cluster of hot-spring inns inside the wine area itself. Travelers can choose a stay that is complete within the region, without relying on Yamagata City’s 4,313 rooms.
Source: MetroEngines Research; compiled by the HotelBank Editorial Team
Dividing the room count of each wine-region core by that of its gateway city makes the difference stand out numerically. Koshu City / Kofu City is 4.6%, Yoichi Town / Otaru City is 3.0%, Tomi City / Ueda City is 3.2% and Takahata Town / Yamagata City is 1.5%. Against these, Kaminoyama City / Yamagata City stands at 16.1% — an order of magnitude apart. On the single measure of how much capacity exists inside the wine region itself, Okitama stands out.
Thin capacity, viewed the other way around, means the region is not yet fully capturing the dwell time and spending of the travelers who visit during harvest. Yoichi Town, Tomi City and Koshu City are all areas where winery counts are growing, and adding lodging inventory there would translate directly into additional in-region spending — a genuine headroom for growth.
Circle size represents room count. Dark circles are wine-region cores; pale circles are gateway cities.
Source: MetroEngines Research; compiled by the HotelBank Editorial Team
Why Wine Regions That Also Have Hot Springs Command Higher Rates
The municipalities at the top of the harvest-season rate ranking share a common feature. Kaminoyama City has Kaminoyama Onsen, Nan’yo City has Akayu Onsen and Fuefuki City has Isawa Onsen. Each is a wine region and a hot-spring destination at the same time, and inns offering one night with two meals — dinner and a bath included — make up the bulk of supply.
This structure feeds directly into rate levels. Against Kofu City, where room-only business hotels dominate inventory (estimated settled ADR of ¥11,300 for October 2026, N=32), and Yoichi Town (¥10,900, N=3), Kaminoyama City stands at ¥18,900 (N=16) — 1.7 times higher. Even in the same harvest season, what a traveler pays is determined by “what you eat and what you bathe in.”
Having a hot-spring destination also works in favor of seasonal diversification. Looking at monthly variation in the finalized 2025 figures, Kaminoyama City stays within a range of 84 to 124 against its annual average throughout the year, and Nan’yo City holds 114 — above its annual average — in September–November before rising further in November and December. Not depending on the single demand peak of the wine harvest, and instead having multiple reasons to visit throughout the year, is what underpins the resilience of these rates.
The Harvest Season Is Not Yet the Annual Peak
So far we have looked at the level of harvest-season rates themselves. But is the harvest season the time of year when rates are highest in these places? Testing this against the 2025 monthly data, where finalized observed results are available, produces an unexpected answer.
Indexing each municipality’s monthly estimated settled ADR to its annual average = 100, the average index for the September–November harvest window comes to 103 in Koshu City, 105 in Shiojiri City, 104 in Komoro City, 107 in Kaminoyama City and 114 in Nan’yo City. On the other hand, quite a few wine regions fall below their annual average: Fuefuki City 97, Ueda City 99, Yoichi Town 98, Iwamizawa City 99, Yamanashi City 93 and Otaru City 86. Of the 11 municipalities, 9 sit within ±7% of their annual average.
And looking at the month in which each recorded its annual high, Koshu City peaked in May–June; Shiojiri City, Komoro City and Otaru City in August; and Fuefuki City, Ueda City, Nan’yo City and Kaminoyama City in December. The nationwide demand peaks of summer holidays and the year-end/New Year period outrank the grape harvest. The season that matters most to the winemakers has not yet become a “special season” in terms of room rates.
Source: MetroEngines Research; compiled by the HotelBank Editorial Team
This points to where the real upside lies. The Koshu City Katsunuma Grape Festival is held in early October each year, and the new-vintage wines handled by the Yamanashi Wine Producers’ Association are released on November 3. Takahata Winery’s Harvest Festival is also held in October. On the event calendar, the harvest season is clearly designed as a demand peak — and yet room rates have not priced it in. There is room across these wine regions to design stay packages built around the harvest season, and to set prices that match that value.
Where Are the Inns Where Wine Gets Talked About?
Whether an inn has absorbed the context of its wine region shows up in what guests say. The HotelBank Editorial Team aggregated 21,942 guest reviews posted over the most recent 24 months for 80 major lodging properties across 13 municipalities in the four regions, and calculated the share of reviews that touched on beverages at dinner (wine pairings, sommelier recommendations, tasting flights and the like).
The results split clearly by region. Okitama (Yamagata) is highest at 5.09% (18 properties, 3,791 reviews), followed by Koshu (Yamanashi) at 3.69% (20 properties, 4,989 reviews). Against these, Shinshu (Nagano) comes in at 0.48% (26 properties, 4,386 reviews) and Sorachi-Yoichi (Hokkaido) at 0.11% (16 properties, 8,776 reviews). Measured by the number of properties with any such mention, the gap is just as wide: 7 of 18 properties in Okitama and 8 of 20 in Koshu, against 2 of 26 in Shinshu and 1 of 16 in Sorachi-Yoichi.
This distribution maps almost exactly onto the lodging-inventory structure described in the previous sections. In Okitama and Koshu, which have hot-spring inns serving one night with two meals inside the wine region, the local drink becomes a topic at the dinner table. In Shinshu and Sorachi-Yoichi, where the center of gravity for lodging sits with urban business and city hotels, dinner itself happens outside the property, so wine rarely surfaces in the guest reviews.
By municipality, Koshu City is highest at 13.07% (7 properties, 482 reviews), followed by Nan’yo City at 7.48% (8 properties, 628 reviews), Kaminoyama City at 5.02% (8 properties, 2,909 reviews), Yamanashi City at 4.68% (5 properties, 684 reviews) and Fuefuki City at 2.33% (8 properties, 3,823 reviews). By contrast, no qualifying mentions could be confirmed among the covered properties in Shiojiri City, Tomi City, Yoichi Town, Iwamizawa City or Takahata Town.
The mention share is the ratio of qualifying mentions to total reviews and is not an evaluation score.
Source: HotelBank Editorial Team research (most recent 24 months, 80 properties, 21,942 reviews)
For reference, we applied the same method to mentions of sake and local sake, but no qualifying mentions could be confirmed among the 80 properties and 21,942 reviews. Even on a nationwide basis, while the top 100 properties are fully populated when the threshold is 30 or more mentions of beverages at dinner, not a single property in Japan could be confirmed with 30 or more mentions of sake or local sake. As a beverage talked about at an inn’s dinner table, wine and pairings in general are overwhelmingly more likely to be mentioned.
At the individual-property level, inns with a high share of dinner-beverage mentions do indeed exist within the wine regions. Kajitsu-no-Yama Azumaya (果実の山 あづま屋) in Kaminoyama City, Yamagata (56 rooms) records 20.30% (55 of 271 reviews); Uesugi-no-Oyu Gotenmori (上杉の御湯 御殿守) in Nan’yo City (32 rooms) records 17.42% (27 of 155); and Fuefukigawa Onsen Bettei Zabo (笛吹川温泉 別邸 坐忘) in Koshu City, Yamanashi (18 rooms) records 16.86% (58 of 344). All are small to mid-sized inns of 60 rooms or fewer, where operating close to the dining table translates into recognition from guests.
| Municipality | Property | Rooms | Reviews | Dinner-beverage mention share |
|---|---|---|---|---|
| Kaminoyama City | Kajitsu-no-Yama Azumaya (果実の山 あづま屋) | 56 | 271 | 20.30% |
| Nan’yo City | Uesugi-no-Oyu Gotenmori (上杉の御湯 御殿守) | 32 | 155 | 17.42% |
| Koshu City | Fuefukigawa Onsen Bettei Zabo (笛吹川温泉 別邸 坐忘) | 18 | 344 | 16.86% |
| Kaminoyama City | Tsukioka Hotel (月岡ホテル) | 101 | 526 | 11.03% |
| Nan’yo City | Yamagataza Takinami (山形座 瀧波) | 19 | 127 | 11.02% |
| Fuefuki City | Ooedo Onsen Monogatari Isawa Onsen Hotel Shinko (大江戸温泉物語 石和温泉 ホテル新光) | 107 | 502 | 8.57% |
| Yamanashi City | Fruit Park Fujiya Hotel (フルーツパーク富士屋ホテル) | 43 | 303 | 7.26% |
| Komoro City | Komoro Grand Castle Hotel (小諸グランドキャッスルホテル) | 91 | 276 | 5.43% |
| Nan’yo City | Akayu Onsen Mori-no-Yu (赤湯温泉 森の湯) | 13 | 111 | 5.41% |
| Fuefuki City | Isawa Tokiwa Hotel (石和常磐ホテル) | 58 | 439 | 4.33% |
Coverage is the 80 properties with 100 or more reviews across 13 municipalities in the four regions. The mention share is not an evaluation score.
Source: HotelBank Editorial Team research (most recent 24 months)
Supply Added Over the Past Three Years — Where Did Rooms Increase?
If thin capacity represents headroom for growth, are rooms actually being added? We aggregated newly confirmed openings from 2024 through 2026 by municipality.
The largest movement is in Otaru City, where 18 properties and 258 rooms were added over the three years. The 159-room Otaru Granbell Hotel, which opened in July 2025, led the way, and a 19-room ryokan was added in February 2026. Fuefuki City follows with 6 properties and 233 rooms: a 91-room property opened in July 2024 and a 136-room property in June 2026, both in the Isawa Onsen area, steadily thickening the capacity of the Koshu region. Shiojiri City also gained 91 rooms in July 2024.
Movement at the wine-region cores, by contrast, is minimal. Yoichi Town added 4 properties and 9 rooms, Tomi City 1 property and 4 rooms, and Koshu City 1 property and 1 room, while Takahata Town saw no new confirmed openings over the three years. Every property added was a small inn of just a few rooms.
* Based on confirmed OTA listings. Because listings typically appear several months before opening, counts for the most recent months onward may increase with future listings.
Source: MetroEngines Research & Consulting (based on confirmed OTA listings)
We also checked the forward pipeline. Querying building-plan data based on the Ministry of Land, Infrastructure, Transport and Tourism’s Construction Statistics Survey, no applicable plans could be confirmed in the 12 municipalities across the four regions covered here. Note, however, that this data is based on building-confirmation applications, which are normally filed one to two years before opening. Counts are expected to rise as further applications are filed, so the figure should be read as a lower bound on the currently confirmed pipeline.
In short, there is limited near-term reason to expect lodging inventory at the wine-region cores to change substantially, and it is natural to expect the current itinerary — “visit the wine region by day, sleep in the gateway city or the hot-spring town by night” — to continue for the time being. Put the other way around, demand from travelers who want to complete their stay inside the wine region remains an area that is not yet adequately served.
Thin Capacity Cannot Be Filled by Rates Alone — A Sensitivity View
The figures so far have described these wine regions along two axes: rate and room count. Multiply the two and the scale each wine-region core can absorb during harvest becomes directly visible. All of the following are unit conversions and arithmetic extensions of measured values presented in this article, not forecasts of future demand or occupancy.
First, extend the pace of supply additions. Over the past three years (2024–2026), the wine-region cores gained 1 room in Koshu City, 4 in Tomi City and 9 in Yoichi Town, while nothing could be confirmed in Takahata Town. If that pace continues for another three years, and alternatively if it doubles, room counts and the ratios against the gateway cities work out as follows.
| Scenario | Koshu City / Kofu City | Tomi City / Ueda City | Yoichi Town / Otaru City | Takahata Town / Yamagata City |
|---|---|---|---|---|
| Pessimistic: no additions (held flat) | 135 rooms 4.6% | 88 rooms 3.2% | 60 rooms 3.0% | 65 rooms 1.5% |
| Central: same pace as the past three years | 136 rooms 4.6% | 92 rooms 3.3% | 69 rooms 3.5% | 65 rooms 1.5% |
| Optimistic: double the past three years’ pace | 137 rooms 4.6% | 96 rooms 3.5% | 78 rooms 3.9% | 65 rooms 1.5% |
An arithmetic extension of the 2024–2026 supply additions stated in the text (Koshu City 1 room, Tomi City 4 rooms, Yoichi Town 9 rooms, Takahata Town 0 rooms) over a further three years. Changes in occupancy and rates are not factored in.
Source: MetroEngines Research; compiled by the HotelBank Editorial Team
Even at double the pace, the ratio against the gateway city moves only from 3.0% to 3.9% in Yoichi Town and from 3.2% to 3.5% in Tomi City. For Koshu City and Takahata Town, not even the first decimal place changes. The structural thinness of inventory at the wine-region cores would not change in three years even if supply-side effort doubled — which corroborates the previous section’s judgment that the “visit by day, sleep in the gateway city or hot-spring town by night” itinerary will continue for the time being.
The other axis is rate. Room count multiplied by estimated settled ADR gives the “room revenue per night at full occupancy,” which represents the theoretical ceiling on what a wine region can absorb on a given night. Flexing both axes within the measured ranges shows that differences in room count matter far more than differences in rate.
| Rooms \ Estimated settled ADR | ¥10,000 | ¥12,500 | ¥15,000 | ¥17,500 | ¥20,000 |
|---|---|---|---|---|---|
| 60 rooms | ¥600,000 | ¥750,000 | ¥900,000 | ¥1,050,000 | ¥1,200,000 |
| 220 rooms | ¥2,200,000 | ¥2,750,000 | ¥3,300,000 | ¥3,850,000 | ¥4,400,000 |
| 380 rooms | ¥3,800,000 | ¥4,750,000 | ¥5,700,000 | ¥6,650,000 | ¥7,600,000 |
| 540 rooms | ¥5,400,000 | ¥6,750,000 | ¥8,100,000 | ¥9,450,000 | ¥10,800,000 |
| 700 rooms | ¥7,000,000 | ¥8,750,000 | ¥10,500,000 | ¥12,250,000 | ¥14,000,000 |
Both axes stay inside the measured ranges appearing in the text (60–696 rooms / estimated settled ADR ¥10,136–¥19,644). Cells are unit conversions of rooms × ADR, not forecasts.
Source: MetroEngines Research; compiled by the HotelBank Editorial Team
Koshu City (135 rooms, ¥19,118) comes to roughly ¥2.58 million; Kaminoyama City (696 rooms, ¥18,941) to roughly ¥13.18 million. Rates are nearly identical, yet the scale each can absorb on a given night differs by more than fivefold. Conversely, for Yoichi Town (60 rooms, ¥10,900) to reach the same scale as Kaminoyama City, doubling its rate would not be enough — it would need an order-of-magnitude increase in room count itself. Capturing the harvest-season upside through rate alone is structurally difficult at the wine-region cores.
How to Stay in Each of the Four Regions
Pulling the figures together, the four regions each turn out to have a distinct character.
| Region | Center of gravity for lodging | Wine-region core room-count ratio | Dinner-beverage mention share |
Characteristics |
|---|---|---|---|---|
| Okitama (Yamagata) | Inside the wine region | 16.1% | 5.09% | Akayu and Kaminoyama Onsen provide capacity; self-contained within the region |
| Koshu (Yamanashi) | Isawa Onsen and Kofu | 4.6% | 3.69% | Hot springs nearby; supply additions also under way |
| Shinshu (Nagano) | Ueda and Matsumoto | 3.2% | 0.48% | A double layer of thick urban bases; the wine region is visited as a point |
| Sorachi-Yoichi (Hokkaido) | Otaru | 3.0% | 0.11% | Smallest inventory relative to fast-growing winery clustering |
The wine-region core room-count ratio is calculated as Koshu = Koshu City / Kofu City, Shinshu = Tomi City / Ueda City, Sorachi-Yoichi = Yoichi Town / Otaru City, and Okitama = Kaminoyama City / Yamagata City.
Source: MetroEngines Research; HotelBank Editorial Team research
Okitama has a cluster of hot-spring ryokan inside the wine region, harvest-season rates among the highest of the four, and the most frequent appearance of wine in guest reviews. As a model for staying within the wine region, it is highly developed.
Koshu is Japan’s largest wine region, yet its lodging depends on Isawa Onsen and Kofu. That said, Fuefuki City has added 233 rooms over the past three years, and capacity is thickening. Routes combining the vineyard hills, the wineries and the hot-spring inns will be the axis going forward.
Shinshu, precisely because it has the strong urban bases of Ueda and Matsumoto, finds it hard to make demand for staying in the wine region itself visible. Kikyogahara in Shiojiri City and the eastern Chikumagawa Wine Valley district in Tomi City are both clusters of small inns; if stay-oriented capacity were added there, the center of gravity for lodging could shift.
Sorachi-Yoichi shows the most striking growth in winery numbers of the four regions. Hokkaido has 76 wineries in operation, of which 13 are in Yoichi Town and 11 in Sorachi. Against that, Yoichi Town’s lodging inventory is 60 rooms. This is where the greatest potential lies dormant.
Conclusion — Can the Harvest Become a “Special Season”?
What this article confirmed can be organized into three points. First, the estimated settled ADR for the October 2026 harvest season places Tomi City at ¥19,600, Koshu City at ¥19,100 and Kaminoyama City at ¥18,900 at the top, but the number of properties covered at these wine-region cores ranges from 2 to 16, and the smallness of lodging inventory feeds straight through into the volatility of the rates.
Second, the center of gravity for lodging differs markedly by region. Comparing wine-region core room counts against the gateway cities gives Okitama 16.1% against Koshu 4.6%, Shinshu 3.2% and Sorachi-Yoichi 3.0%. Whether you can stay inside the wine region changes the design of the trip from the ground up.
Third, the harvest season is not yet the annual peak. In the 2025 actuals, 9 of 11 municipalities kept their September–November rate level within ±7% of the annual average, and the annual high fell either in the summer holidays or over the year-end and New Year. Even though harvest festivals and new-vintage releases are established as events, they are not yet reflected in room rates.
All three points indicate headroom for the lodging businesses of these wine regions. Design stay packages built around the harvest season, build the route to the wineries into the inn’s own experience, and present a price that matches that value. As guest reviews already show, inns where the local drink is talked about over dinner do earn recognition. As recognition of Japan as a wine-producing country spreads nationwide, building the capacity to receive those travelers is entering its next stage.
⚠ Note on ADR for future dates: The estimated settled ADR for September–November 2026 in this article are snapshot values estimated from selling prices published on OTAs and similar channels as of the survey date (July 26, 2026), and they fluctuate as the check-in date approaches. In particular, for municipalities where fewer than 5 properties were covered (Koshu City, Yamanashi City, Tomi City, Yoichi Town, Iwamizawa City and Takahata Town), a price change at one or two properties can move the figure substantially, so please treat these as indicative levels. In addition, past-month values are finalized observed results while future-month values are estimates from listing conditions; because the bases differ, this article does not calculate year-on-year comparisons that straddle the two.
References and Sources
■ Data sources
MetroEngines Research estimated settled ADR (as aggregated on July 26, 2026; 16 municipalities covered, N=2–93 properties per month), operating property and room counts (as of July 2026), and new-opening data (based on confirmed OTA listings, 2024–2026). Reviews were aggregated by the HotelBank Editorial Team from 21,942 reviews across the 80 properties with 100 or more reviews among 13 municipalities in the four regions (most recent 24 months). Public statistics are from Yamanashi Prefecture, Yoichi Town, the Sorachi General Subprefectural Bureau of Hokkaido, and the Ministry of Land, Infrastructure, Transport and Tourism’s Construction Statistics Survey.
■ Assumptions
The harvest season is defined as September–November, with October 2026 as its center. Comparisons between municipalities use a single common basis of estimation (a snapshot based on listing conditions at the time of the survey), and no year-on-year comparisons straddling past months and future months, which use different bases, are calculated. Seasonality indices use only finalized 2025 values, indexed to each municipality’s annual average = 100. The supply scenarios are arithmetic extensions over three years of the past three years’ additions stated in the text, and do not factor in changes in occupancy or rates. Room revenue at full occupancy is the theoretical ceiling of “rooms × estimated settled ADR” and is not a forecast.
■ Limitations and caveats
Estimated settled ADR is an estimate; against property-level actuals disclosed by listed hotel REITs, the median error is approximately 7% (Invincible Investment Corporation, 184 property-months, April–May 2026). In municipalities where fewer than 5 properties were covered (Tomi City 2, Koshu City 4, Yamanashi City 4, Iwamizawa City 4, Yoichi Town 3, Takahata Town 2), the pricing of one or two properties moves the representative value. The review mention share is not an evaluation score but the ratio of qualifying mentions to each property’s total reviews. New openings are based on confirmed OTA listings and therefore exclude projects not yet listed, and building-plan data is based on building-confirmation applications and should be read as a lower bound on the confirmed pipeline.
■ Market data
- MetroEngines Research — estimated settled ADR (as aggregated on July 26, 2026), operating property and room counts, new-opening data (based on confirmed OTA listings)
- HotelBank Editorial Team research — guest review aggregation (13 municipalities across four regions, 80 properties, 21,942 reviews, most recent 24 months)
■ Government statistics and official municipal sources
- Yamanashi Prefecture, “Yamanashi’s Number Ones in Japan” (89 wineries, 18.0% of the national total of 493; 4,278 kl of Japanese wine produced, 29.9% of the national total; 43,600 t of grapes harvested)
- Ministry of Land, Infrastructure, Transport and Tourism, “Construction Statistics Survey” (building-plan data, based on building-confirmation applications; includes the Building Construction Starts Statistics Survey and the Housing Construction Starts Statistics Survey)
- Yoichi Town, “Yoichi Wine Tourism Project” official site
- Sorachi General Subprefectural Bureau of Hokkaido, “Sorachi Wine Office”
- Koshu City, “Katsunuma Budo-no-Oka”
- Koshu City, “Koshu City Katsunuma Grape Festival” (typically held in early October)
■ Industry associations and operator official sites
- Japan Wineries Association, “Statistics”
- Yamanashi Wine Producers’ Association (new-vintage wine from the 2025 harvest released on November 3)
- Takahata Winery official site (founded 1990; approximately 50 contract growers; Harvest Festival typically held in October)
- Shinshu Chikumagawa Wine Valley (Eastern District)
- Shinshu Wine Valley, “Chikumagawa Wine Valley”
■ Press coverage and commentary