

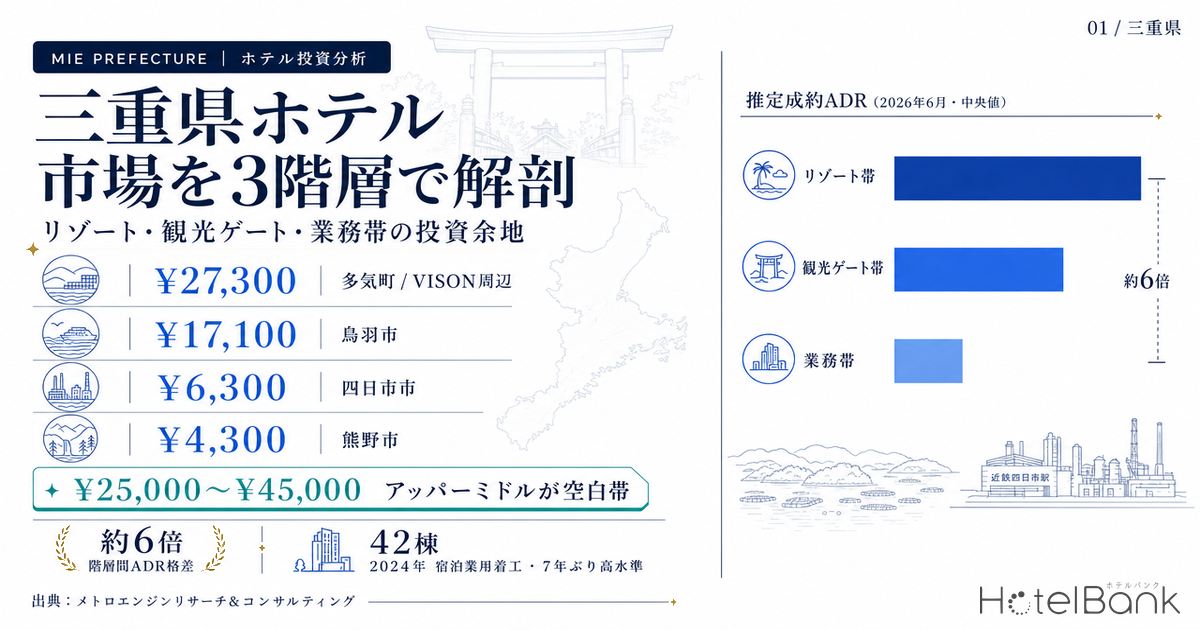
Mie Prefecture’s hotel market cannot be captured by a single market rate. A resort belt anchored by Ise Grand Shrine and Ise-Shima National Park; a tourism-gateway belt growing on the back of VISON and semiconductor clustering; and a business belt supporting the Nagoya commuter zone and the coastal industrial complex — three demand spheres with entirely different characters coexist within one prefecture. This report uses MetroEngines Research’s settled ADR estimates to map these three tiers quantitatively, and examines the price-band white space, the coming supply pressure, and development efficiency by location.
Metric Definitions Used in This Article
- ADR (average daily rate): An estimated settled rate (tax-exclusive equivalent) calculated by applying category-specific adjustment coefficients to the lowest publicly listed plan level each property posts on OTAs (double occupancy, per-room rate, tax-inclusive). Cross-checked against property-level actuals disclosed by listed hotel REITs (91 properties, most recent 3 months), the median error is approximately 7%. These are estimates and differ from each property’s actual transacted rates or accounting figures. Area-level ADR is the median across the covered properties (the level of a typical property in that area). Figures explicitly labeled “listed price (all-plan average, tax-inclusive)” in the text are the listed average across all plans, from room-only to meal-inclusive, and are a different metric from ADR (settled estimate).
- Early sellout LT: The lead time at which remaining rooms first reached zero (LT = days until check-in date; LT0 = same day). The larger the value, the earlier the sellout occurred.
- Data source: MetroEngines Research & Consulting. MetroEngines Research tracks approximately 168,000 properties nationwide, of which roughly 27,000 properties and 1.26 million rooms with confirmed OTA activity form the analysis universe.
- — Mie’s hotel market splits into three tiers — resort belt, tourism-gateway belt, and business belt — with settled ADR ranging from ¥4,300 in Kumano to ¥27,300 in Taki (VISON), a spread of roughly 6x.
- — The ¥25,000–¥45,000 upper-midscale band is thinly supplied and represents the prefecture’s largest white space.
- — Small ryokan in the resort belt sold out Obon demand at a lead time of 90 days, demonstrating the strength of demand (151 properties recorded early sellout).
- — The business belt, buoyed by semiconductor clustering (roughly 3,000 jobs expected over the next decade across four companies in the prefecture), still sits at an ADR in the ¥6,000s, leaving considerable headroom.
- — Construction starts for lodging use reached 42 buildings in 2024, the highest in seven years, underpinning rate growth.
Executive Summary — Three Demand Spheres in One Prefecture, with Settled ADR Spread of up to 6x
To state the conclusion first: Mie Prefecture’s hotel market divides clearly into three tiers — the resort belt (Ise, Shima, Toba), the tourism-gateway belt (Taki/VISON, Nabari, Kumano/Owase), and the business belt (Yokkaichi, Kuwana, Tsu) — with settled ADR spanning roughly ¥4,300 in Kumano City to about ¥27,300 in Taki Town (the VISON area), a gap of approximately six times. Small ryokan in the resort belt sell out Obon demand at the extremely early stage of a 90-day lead time, proving the strength of that demand. At the same time, the ¥25,000–¥45,000 upper-midscale band is thinly supplied, and this is arguably the prefecture’s largest white space. The business belt carries the structural tailwind of semiconductor industry clustering, yet room rates remain in the ¥6,000s, leaving substantial headroom.
The Three-Tier ADR Structure — the Resort Belt Drives Prefecture-Wide Pricing
We begin by organizing settled ADR (June 2026) for ten cities by tier. Listed prices (all-plan average, tax-inclusive) are shown alongside. Note that listed prices run high because they include unsold plans; the figure closer to actual transactions is the settled ADR estimate.
| Tier | City | Properties | Total rooms | Settled ADR | Listed price | YoY |
|---|---|---|---|---|---|---|
| Resort belt | Toba City | 117 | 2,790 | ¥17,100 | ¥42,900 | -11.2% |
| Shima City | 100 | 2,562 | ¥14,600 | ¥33,200 | -7.5% | |
| Ise City | 46 | 1,907 | ¥11,900 | ¥26,300 | +6.7% | |
| Tourism-gateway belt | Taki Town (VISON area)* | 6 | 112+ | ¥27,300 | ¥62,700 | +19.6% |
| Nabari City | 9 | 535 | ¥5,200 | ¥15,400 | -15.8% | |
| Owase City* | 11 | 102 | ¥5,000 | ¥14,800 | +7.8% | |
| Kumano City | 16 | 295 | ¥4,300 | ¥14,600 | -1.6% | |
| Business belt | Kuwana City | 14 | 952 | ¥7,300 | ¥19,900 | -6.1% |
| Tsu City | 34 | 2,317 | ¥6,700 | ¥15,000 | -6.0% | |
| Yokkaichi City | 27 | 2,390 | ¥6,300 | ¥15,100 | -5.3% |
On a settled ADR basis, Toba City in the resort belt leads the prefecture at roughly ¥17,100, followed by Shima City at ¥14,600 and Ise City at ¥11,900. While Ise City grew +6.7% year on year, Toba (-11.2%) and Shima (-7.5%) pulled back, indicating uneven demand even within the resort belt. In the tourism-gateway belt, Taki Town stands out thanks to VISON (a large commercial resort complex), posting the prefecture’s highest level at a settled ADR of ¥27,300 and +19.6% year on year. That said, the sample within MetroEngines Research’s coverage is only a handful of properties, so this figure should be read as an indicative area trend. The three business-belt cities cluster in a ¥6,300–¥7,300 range, all slightly down year on year. Relative to their demand base — the Nagoya commuter zone and semiconductor clustering — rates still have room to rise. The method of splitting a prefecture into tiers with different characters to read price-band gaps has also been applied to Miyagi Prefecture’s hotel investment headroom in the era of four million passengers at Sendai Airport, which offers a useful point of comparison across prefectures.
Source: MetroEngines Research & Consulting
Viewing the whole prefecture by property category makes the tier structure even sharper. Resort hotels (settled ¥16,700 / listed ¥51,700) and ryokan (¥14,300 / ¥36,700) occupy the top, while business hotels (¥6,100 / ¥12,200) and city hotels (¥6,600 / ¥15,800) form the base — a two-pole structure. The gap between listed price and settled ADR reaches roughly 3x for resort hotels, reflecting the resort characteristic that high-rate plans tend to remain unsold on OTAs.
Source: MetroEngines Research & Consulting (June 2026)
Seasonality of Supply and Demand — Two Peaks, Obon and Year-End
Overlaying prefecture-wide settled ADR by month and by year reveals a clear seasonal pattern. There are two peaks, August (Obon) and December (year-end), with troughs in June (rainy season) and February. August 2026 is estimated at ¥14,600, the highest of the past two years, as summer leisure demand in Ise-Shima overlaps with the resilience of the business belt. Note that figures from August 2026 onward are estimates based on listing snapshots and will shift as check-in dates approach.
Source: MetroEngines Research & Consulting (Mie Prefecture overall, median settled ADR)
Site Evaluation — Comparing Development Efficiency Between Business-Belt Commercial Land and Resort Locations
Investment efficiency turns heavily on how light land acquisition costs are relative to expected ADR and occupancy. According to the Ministry of Land, Infrastructure, Transport and Tourism’s published land prices (2025), the area around Kintetsu Yokkaichi Station — the core of the business belt — averages about ¥120,700/sqm for commercial land (+3.09% year on year), the highest in the prefecture, and the top commercial site in Suwaeicho reaches ¥463,000/sqm. By contrast, Ise City in the resort belt averages roughly ¥36,900/sqm and Shima City (including Kashikojima) about ¥17,600/sqm — sites can be secured at one-third to one-seventh of Yokkaichi levels.
Source: Compiled by MetroEngines Research & Consulting from the Ministry of Land, Infrastructure, Transport and Tourism’s “Published Land Prices” (2025)
The map below places the ten cities and the scale of their settled ADR geographically. Circle size represents room scale and color represents the three tiers.
Source: MetroEngines Research & Consulting
Supply Pipeline — Construction Starts at a Seven-Year High, Underpinning Rate Growth
We assess future supply pressure from two independent sources. According to the Ministry of Land, Infrastructure, Transport and Tourism’s “Building Construction Starts Statistics,” lodging-use construction starts reached 42 buildings in 2024, the highest level since 2017, while planned construction cost also hit a four-year high at approximately ¥376 million. The recovery in construction demand is clear. Separately, the number of new property openings that MetroEngines Research confirms on an OTA-listing basis has held steady at around 30 a year — 30 in 2023, 28 in 2024, and 31 in 2025.
The apparent decline to 15 new openings in 2026 does not mean supply is thinning; it reflects the observation lead time, since OTA listings only appear a few months before opening, and the count will rise as more listings are added. Meanwhile, no applicable planned projects in Mie Prefecture could be confirmed in the Building Dynamics Statistics Survey (building-confirmation-application basis) as of the survey date. This does not mean “there are no future development plans” — because confirmation applications are filed one to two years before opening, the correct reading is that the confirmed pipeline floor is currently zero. In practice, reinvestment in the resort belt continues: NEMU RESORT in Shima City reopened in April 2026 after adding 18 new villas, and allbeans ISESHIMA opened on Ago Bay in March 2026. Rising construction costs raise the barrier to new entry, which for existing properties becomes an upside factor in the form of easing competition.
Positioning Analysis — the ¥25,000–¥45,000 Upper-Midscale Band Is the White Space
Properties are mapped by settled ADR (vertical axis) and early sellout LT (horizontal axis = the lead time at which remaining rooms first reached zero; further right means an earlier sellout). The target date is Obon (August 13 arrival), limited to properties whose OTA-published allotment is at least 30% of total rooms. Circle size represents room count.
Source: MetroEngines Research & Consulting (N=26 properties, Obon Aug 13 arrival, OTA-published allotment 30%+)
What the scatter plot shows is that “small resort ryokan in the ¥15,000–¥22,000 range” are the protagonists of early sellout. Hana no Koyado Jubei (花の小宿 重兵衛, 13 rooms) and Hamabe no Onsenyado Kameya (浜辺の温泉宿 かめや, 14 rooms) sold out their Obon allotment at the extremely early stage of a 90-day lead time, underscoring their scarcity value. Business hotels in the business belt cluster in the low-rate ¥4,000–¥7,000 zone, selling out at lead times in the 40-day range and showing stable demand. In between, the ¥25,000–¥45,000 upper-midscale band is almost empty, and the few achieving early sellout in that band are limited to high-rate resorts around VISON and a handful of others. If a mid-sized boutique in this price band — selling views and cuisine — could be introduced in the resort belt where land costs are light, the structure is one in which unmet demand can be captured. The fact that the upper-midscale gap is a shared investment opportunity across prefectures is explored from the same angle in our analysis of Nara Prefecture’s hotel investment headroom.
Crowded Small resort ryokan
¥15,000–¥22,000 x 4–32 rooms
Concentrated in Toba, Shima and Toshijima. Strong demand that sells out at LT90 for Obon, but small in scale with a limited rate ceiling.
White space Upper-midscale boutique
¥25,000–¥45,000 x 20–60 rooms
The thinnest price band in the prefecture. Land costs for view resorts are light and the headroom is large.
Stable Business-focused
¥4,000–¥7,000 x 100-room class
Concentrated in Yokkaichi and Tsu. Weekday demand is stable on the back of semiconductor clustering, with rate upside still available.
Obon Early-Sellout Ranking — Scarcity in the Resort Belt
We extracted the properties that sold out earliest for Obon 2026 (August 13 arrival) from room-level remaining-inventory movements. The top of the ranking is dominated by small ryokan in Ise-Shima and Toba, corroborating the strength of resort-belt demand.
| Rank | Property | Category | Rooms | Early sellout LT | Days observed sold out | Current remaining-room ratio |
|---|---|---|---|---|---|---|
| 1 | Hana no Koyado Jubei (花の小宿 重兵衛) | Ryokan | 13 | LT90 | 19 days | 23% |
| 2 | Hamabe no Onsenyado Kameya (浜辺の温泉宿 かめや) | Ryokan | 14 | LT90 | 24 days | 21% |
| 3 | Shiki Kappo no Yado Kii no Matsushima (四季活魚の宿 紀伊の松島) | Ryokan | 10 | LT90 | 26 days | 40% |
| 4 | Toshijima Onsen Suzunami (答志島温泉 寿々波) | Ryokan | 32 | LT89 | 4 days | 34% |
| 5 | Suzuka Royal Hotel (鈴鹿ロイヤルホテル) | Ryokan | 36 | LT89 | 12 days | 44% |
| 6 | Yunoyama Onsen Mihoen (湯の山温泉 三峯園) | Ryokan | 8 | LT89 | 20 days | 0% |
| 7 | Family Lodge Hatagoya Ise-Matsusaka (ファミリーロッジ旅籠屋・伊勢松阪店) | Riders’ house | 12 | LT89 | 15 days | 0% |
| 8 | Ikadaso Sanjo (味と眺めの人情の宿 いかだ荘山上) | Ryokan | 16 | LT89 | 11 days | 38% |
| 9 | Minshuku Ryokan Yamakawa (民宿旅館 山川) | Ryokan | 10 | LT89 | 65 days | 0% |
| 10 | Oyado Hamabeya (御宿 浜辺屋) | Ryokan | 4 | LT89 | 45 days | 0% |
Hana no Koyado Jubei (花の小宿 重兵衛, 13 rooms), for example, entered a sold-out state for its Obon allotment at a lead time of 90 days and has since been observed sold out on a cumulative 19 days. Toshijima Onsen Suzunami (答志島温泉 寿々波, 32 rooms) and the ryokan cluster at Yunoyama Onsen also sold out at a lead time of 89 days, reflecting the scarcity created when small scale means allotments fill instantly. For such properties, the difficulty of securing a reservation is itself an asset, more so than any room to raise rates, and it demonstrates the depth of the resort belt’s demand base. Read alongside a nationwide view of the onsen ryokan that sell out fastest for Obon, it becomes clearer where Mie’s scarcity sits within the national picture.
Investment Implications — Upside in Each of the Three Tiers
| Tier | Demand driver | Settled ADR | Land cost | Direction of upside |
|---|---|---|---|---|
| Resort belt | Ise Grand Shrine, Ise-Shima National Park, summer leisure | ¥11,900–17,100 | Light | Capture the white space with mid-sized boutiques at ¥25,000–45,000 selling views and cuisine |
| Tourism-gateway belt | VISON, smart interchange, back-end semiconductor processing | ¥4,300–27,300 | Moderate | All-inclusive or mid-price formats capturing dual tourism-plus-business demand |
| Business belt | Nagoya commuter zone, semiconductor clustering, industrial complex | ¥6,300–7,300 | Heavy (commercial land) | Limited-service formats leveraging high floor-area ratios, lifting rates through staged pricing |
Mie Prefecture is a market in which three different kinds of upside coexist: a resort belt with a high rate ceiling, a tourism-gateway belt with two growth drivers, and a business belt with stable supply. The semiconductor industry in particular is expected to generate roughly 3,000 jobs over the next decade at the prefecture’s four major companies alone, creating new business and extended-stay demand along the corridor linking Taki, Kameyama and Yokkaichi. With the resort belt’s strong drawing power now demonstrated, introducing new upper-midscale supply there — combining that demand with the advantage of light land costs — and adopting staged pricing in the business belt each represent an opportunity to expand revenue.
⚠ Note on ADR and sellout signals for future dates: ADR from August 2026 onward and the Obon sellout determinations in this article are estimates based on inventory and pricing published on OTAs as of the survey date, and will shift as check-in dates approach. Current remaining-room counts are the remainder within OTA-published allotments and do not mean a property is fully booked overall.
References and Sources
■ Data source
An ensemble of publicly listed prices from the Jalan and Rakuten OTAs compiled by MetroEngines Research & Consulting (double occupancy, tax-inclusive, all plans). Settled ADR is calculated as the lowest rate multiplied by a category-specific coefficient and cross-checked against J-REIT disclosed actuals (median error 6.6%, tax-exclusive equivalent). Coverage is June 2026 across ten cities in the prefecture, limited to verified categories (business / city / resort / ryokan / capsule).
■ Estimation assumptions
The inter-tier ADR gap and white-space determination are on a settled ADR basis (tax-exclusive equivalent). Obon sellout is defined as “early sellout” for properties with an August 13 arrival and an OTA-published allotment remaining-room ratio of 30% or more (N=151). Construction starts are from e-Stat “Building Construction Starts Statistics,” lodging use, Mie Prefecture. Land costs reference the Ministry of Land, Infrastructure, Transport and Tourism’s “Published Land Prices” (2025).
■ Limitations and caveats
ADR and sellout signals from August 2026 onward are estimates based on inventory and pricing published on OTAs as of the survey date and will shift as check-in dates approach. Remaining-room counts are the remainder within OTA-published allotments and do not mean a property is fully booked overall. Property and total room counts are based on the lodging property master and draw on a different universe from the property counts used for price aggregation.
■ Market data
- MetroEngines Research & Consulting — settled ADR and listed prices based on OTA-published rates, and room-level remaining-inventory movements (early sellout LT)
■ Government statistics and public data
- e-Stat “Building Construction Starts Statistics Survey” (statistics ID: 0003114490, lodging use, Mie Prefecture)
- Ministry of Land, Infrastructure, Transport and Tourism, “Published Land Prices / Prefectural Land Price Survey” (2025)
■ News and press releases
- Mitsui Fudosan, “NEMU RESORT” renewal opening (April 18, 2026)
- HotelBank, “allbeans ISESHIMA” opening (March 2026)
- TV Tokyo Plus: The strategy behind regional resort “VISON” and its 3.5 million annual visitors
- Chunichi Shimbun: Mie Prefecture semiconductor workforce — “3,000 people needed over the next decade”
- Tochidai Data: Published land prices for Yokkaichi City (2025)