

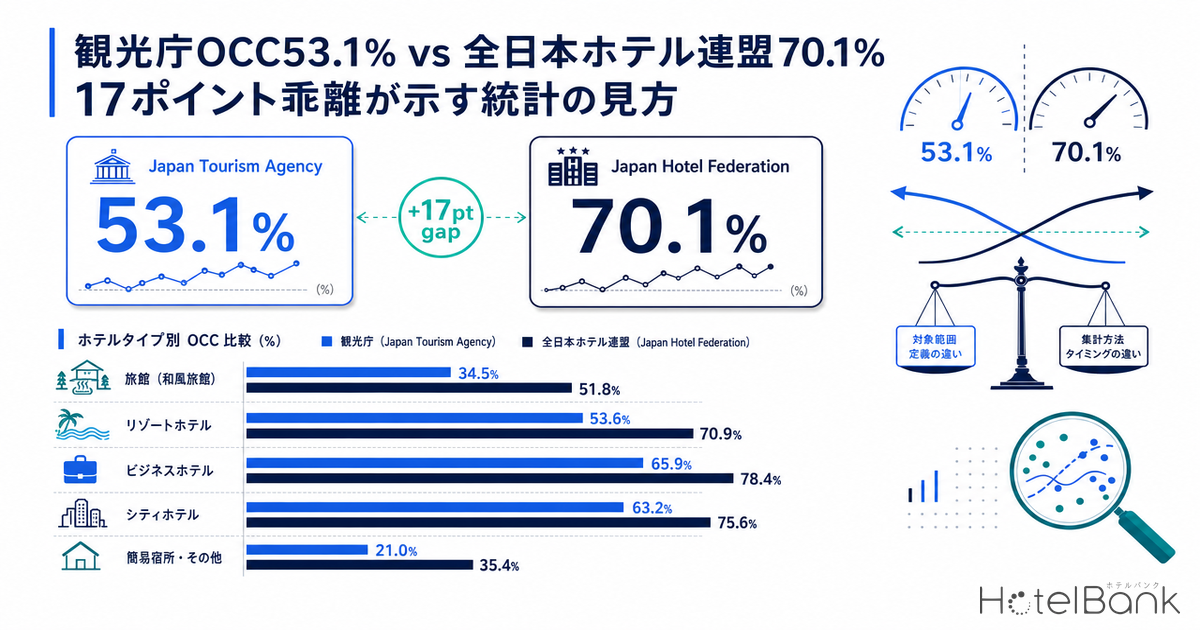
For January 2026, the Japan Tourism Agency’s (JTA) Accommodation Travel Statistics Survey reported a national room occupancy rate of 53.1%, while the All Nippon Hotel Association (ANHA) monthly statistics put the figure at 70.1%. Two official and industry-level data sets that ought to be measuring the same “Japan hotel occupancy rate” diverge by a remarkable 17.0 percentage points. Investment decisions, municipal tourism strategies, bank loan underwriting, hotel operators’ choice of internal benchmarks—these two numbers serve as the starting point for a wide range of industry decisions, so which one represents “the truth”? In this article, we compare the trajectory of both statistics across the three years from 2024 to 2026, and unpack why this 30%-plus gap continues to occur structurally, viewed from five different angles.
Metric Definitions Used in This Article
- Room Occupancy Rate (OCC): Total rooms sold / total rooms available x 100. An indicator of room-selling efficiency that does not depend on the number of guests per room.
- Capacity Occupancy Rate: Total guest-nights / total capacity x 100. Reflects how many guests stayed per room and tends to come out lower than the room occupancy rate.
- JTA Accommodation Travel Statistics: A census-plus-sample survey covering facilities licensed under the Hotel Business Act (hotels, ryokan, simple lodgings, etc.). The first preliminary release tabulates only facilities with 10 or more employees.
- All Nippon Hotel Association (ANHA) Monthly Statistics: A preliminary survey based on a voluntary questionnaire to roughly 234 member hotels (as of January 2026). Respondent properties are mainly mid- to large-sized city and business hotels.
January 2026: What Did the Two Statistical Systems Show?
First, let us check the latest figures from both surveys. According to the JTA’s Accommodation Travel Statistics Survey for January 2026 (first preliminary release, published February 27, 2026), the national room occupancy rate was 53.1% (down 1.5 points year-over-year). By facility type, the breakdown was: ryokan 34.5%, resort hotels 53.6%, business hotels 65.9%, city hotels 63.2%, and simple lodgings 21.0%. Total guest-nights came to 46.28 million (down 5.3% YoY), with foreign guest-nights falling sharply by 12.9% YoY to 13.20 million. For a deeper look at shifts in the foreign guest ratio and regional changes in domestic demand, see our analysis of the JTA January 2026 preliminary data on Tokyo’s foreign-guest-ratio crossing 50% and the structural shift in domestic demand.
Meanwhile, the All Nippon Hotel Association released its monthly member-hotel statistics (preliminary values) on February 12, with a national average room utilization rate of 70.1%. That marks a 1.4-point decline from 71.5% the previous January (some reports cite 71.2% on a like-for-like basis). Of the 234 surveyed properties, 110 responded. Soft business demand during the 12 days from New Year’s Day through Coming-of-Age Day, along with a drop in Chinese group travelers, were cited as headwinds.
For the same month, on what is supposedly the same population of “Japanese hotels,” why does a 17.0-point gap emerge between 53.1% and 70.1%? This divergence did not begin in January 2026—it has persisted structurally over several years.
A Three-Year Trajectory Highlights the Stability of the Gap
Lining up the two statistics for January 2024, January 2025, and January 2026 reveals an interesting fact. The gap remains remarkably stable in a 16- to 18-point range, indicating that the relationship between the two series is not coincidental but stems structurally from differences in survey design.
Source: JTA “Accommodation Travel Statistics Survey,” All Nippon Hotel Association “Monthly Statistics (Preliminary),” compiled by HotelBank Editorial Team
In January 2024, the JTA figure was 54.6% (estimated; January 2025 was also 54.6%, leaving the level essentially unchanged) versus ANHA at 71.1%—a gap of 16.5 points. In January 2025, the JTA was 54.6% against ANHA’s 73.1%, an 18.5-point gap. In January 2026, 53.1% versus 70.1%, a 17.0-point gap. Both series move in the same direction—2024 to 2025 both rose, 2025 to 2026 both fell—but a substantial gap in absolute level has consistently persisted.
In other words, both statistics send the same signal about trend direction, but they paint completely different pictures in answer to the question “what is the typical occupancy reality of Japanese hotels?” depending on which series you look at. This is not a numerical error; it occurs because each survey is observing fundamentally different “target worlds.” For the structural shift visible in the JTA’s full-year statistics—domestic guests -3.8% / foreign guests +8.2%—our deep-dive analysis of the JTA 2025 annual statistics explores the underlying drivers in detail.
Five Structural Factors Behind the Gap
The 17-point gap cannot be explained by any single reason; it accumulates from multiple differences in survey design. The main factors are summarized below.
| Factor | JTA Accommodation Travel Statistics | All Nippon Hotel Association Monthly Statistics |
|---|---|---|
| (1) Types of facilities covered | All 6 types including ryokan, simple lodgings, and corporate/group lodges | Mostly member hotels (predominantly city / business hotels) |
| (2) Size of facilities covered | First preliminary release covers facilities with 10+ employees; second release covers all sizes | Mid- to large-size hotels predominate (few small properties among members) |
| (3) Response method | Mail-based census + sample survey (official statistics) | Voluntary questionnaire to members (110 of 234 responded) |
| (4) Geographic distribution | Even nationwide coverage including many regional ryokan and simple lodgings | Skewed toward urban centers (Tokyo, Osaka, Nagoya, etc.) |
| (5) Treatment of minpaku | Residential lodging business (minpaku) excluded | Likewise excluded |
Source: JTA, All Nippon Hotel Association, compiled by HotelBank Editorial Team
The largest impact comes from factors (1) and (2). The JTA statistics include, in large numbers, segments with structurally low occupancy such as ryokan (OCC 34.5% in January 2026) and simple lodgings (21.0%). Nationwide there are roughly 30,000+ ryokan and nearly 30,000 simple lodgings; on a property-count basis, they outnumber hotels. These pull the average down. By contrast, the ANHA statistic is a simple average of the 110 responding members out of 234, the majority of which are mid-sized or larger city / business hotels. The composition of the underlying populations is fundamentally different.
Looking at the JTA’s occupancy rates by facility type makes the difference plain at a glance.
Source: JTA “Accommodation Travel Statistics Survey (January 2026, first preliminary release),” compiled by HotelBank Editorial Team
Business hotels at 65.9% and city hotels at 63.2% are not far from ANHA’s 70.1%. In other words, the gap is essentially that the “hotel-only world” ANHA observes and the “all-lodging world (hotels + ryokan + simple lodgings)” the JTA observes coexist as independent figures. Taking a simple average of the three hotel-type categories in the JTA data (business, city, resort) yields about 60.9%—still around 9 points below ANHA. The remaining gap can be attributed to facility size (skew toward larger properties) and geographic distribution (skew toward urban areas).
For Small and Mid-sized Operators, “JTA 53.1%” Is Closer to Reality
For an operator running a regional ryokan or a 20-room urban business hotel, the ANHA figure of 70.1% often looks like “a number from a different world” when compared to actual on-the-ground occupancy. That is because ANHA’s underlying population is centered on member hotels, which are skewed toward properties with structural advantages—brand recognition, prime locations, economies of scale, and revenue management capabilities.
The JTA breakdown by facility type holds greater reference value for small and mid-sized operators. For example, for an operator running a traditional onsen ryokan, “ryokan 34.5%” is the direct benchmark, and clearing it by a wide margin can be taken as a sign of solid management. The 21.0% figure for simple lodgings also illustrates the structural difficulty facing guest house and capsule hotel formats, and tells operators in those categories that they need not feel a misplaced sense of crisis along the lines of “the industry average is 70%, so our 40% is low.”
The 21.0% level for simple lodgings in particular reflects several structural weaknesses. First, a flood of new entrants during the surge in inbound tourism left many areas in oversupply. Second, price competition is intense, and competing minpaku (residential lodging) operators hold meaningful share outside of official statistics. Third, room types and services are not standardized, and discoverability on OTAs is weaker than for larger hotels. These structural factors mean the recovery of the simple lodgings segment as a whole is lagging other types.
A Practical Guide to Choosing Between the Two Statistics by Use Case
So when, in practice, should each statistic be referenced? The table below organizes recommendations by use case.
| Use case | Recommended statistic | Reason |
|---|---|---|
| REIT IR materials, institutional investor disclosure | JTA + own portfolio results in tandem | Official statistics provide the most neutral industry-wide reference |
| Municipal tourism strategy, regional revitalization plans | JTA (by prefecture) | Comprehensive coverage of regional and facility-type breakdowns |
| Bank loan underwriting, real-estate due diligence | JTA (baseline) + ANHA (upper-bound reference) | Use the right one based on the segment of the target asset |
| Internal benchmark for mid-sized city / business hotels | ANHA | The member-hotel average for the same segment is closest to home |
| Benchmark for ryokan, simple lodgings, and small regional properties | JTA (by facility type) | ANHA has few members in those segments |
| Overseas investors / international comparisons | JTA + STR/CoStar-style commercial data | Overseas investors often reference STR Global data |
Source: HotelBank Editorial Team
Particular caution is warranted when bank underwriting or real-estate due diligence applies a coarse comparison such as “the industry average is 70%, so a 65% projected occupancy for Property A is reasonable.” Discussing a regional ryokan deal starting from ANHA’s 70%, without considering the property’s segment (full-service city hotel, regional ryokan, roadside business hotel), tends to produce overly optimistic simulations that diverge sharply from on-the-ground reality. Conversely, applying the JTA’s overall average of 53% as the baseline for a city hotel deal can be too conservative, leading firms to pass on investments that should otherwise stand on their own.
International Comparison: Definitional Alignment with STR Global
When overseas investors or hotel operating companies evaluate the Japanese market, the benchmark data they are most familiar with is from STR Global (now part of CoStar Group). STR aggregates the three indicators of Occupancy, ADR (average daily rate), and RevPAR (revenue per available room) under a globally consistent definition. What matters here is that STR’s coverage is “branded hotels plus independent hotels above a certain size,” which in the Japanese context is closer to the ANHA population.
In other words, for overseas investors, ANHA’s 70.1% is closer to “Japan as seen through an STR lens” than the JTA’s 53.1%. Meanwhile, the JTA data is the official indicator used in formal reporting to JNTO and international organizations. Understanding the difference and applying the appropriate series to the appropriate context is a foundational literacy for global hotel investment communication.
The same caveat applies when comparing RevPAR levels internationally. The macro-level RevPAR computed from the JTA’s total guest-nights and the STR-style hotel-only RevPAR diverge significantly in absolute level. Before debating whether the Japanese hotel market is “cheap or expensive,” the first step is to confirm that the underlying populations of the comparison metrics are aligned.
KPI Setting Recommendations for Small and Mid-sized Lodging Operators
When small and mid-sized lodging operators set their own KPIs, the easiest pitfall is the ambiguity of the term “industry average.” ANHA’s 70%, JTA’s overall 53%, JTA’s business hotel 66%, JTA’s ryokan 35%—any of these can be called an “industry average,” but the right number to reference differs for each operator.
First, you must clearly define your own segment. Classify your property along three axes—facility type (ryokan / business / city / resort / simple lodging), room count (under 50, 50-150, over 150), and location (major-city center, regional city, tourist destination, suburban)—then take the closest segment from the JTA’s facility-type breakdown as your baseline.
Second, focus on relative trends rather than absolute levels. The two statistics agree on the direction of the trend. Looking at whether your property is up or down year-over-year, and whether it is swinging more widely than the industry average, lets you draw meaningful insights while sidestepping any absolute-level mismatch.
Third, when diagnosing your own challenges, do not rely on occupancy alone. Use ADR and RevPAR alongside it to assess whether you are securing revenue with high ADR even at low occupancy, or whether you are at high occupancy but failing to grow revenue due to a weak pricing strategy. For small and mid-sized properties especially, an operation that consciously tracks the three core revenue management indicators is the very weapon that closes the gap with larger competitors. On the structure behind recent ADR increases—which have advanced largely on labor-cost pass-through rather than occupancy gains—we have explored the topic in detail in our analysis of the labor-cost-driven ADR rise and the OCC x ADR divergence in 2026 hotel pricing.
Note: The JTA January 2026 figures cited in this article are first-preliminary values and may change in the second-preliminary release scheduled for March 31, 2026. The first preliminary release covers only facilities with 10 or more employees; the second preliminary release expands to all sizes. (This employee-based stratification criterion is also slated to be changed to a room-count basis going forward; for details, see our analysis of the JTA’s planned change to the stratification criterion in the lodging statistics.) In general, the second preliminary release tends to include more regional ryokan and simple lodgings, and the room occupancy rate tends to be revised slightly downward. ANHA’s statistics are likewise preliminary values based on responses from 110 of 234 surveyed properties, and are subject to compositional shifts among respondents.
Conclusion: The Required Literacy Is “Using Both Statistical Systems Appropriately”
The 17-point gap between the JTA’s OCC of 53.1% and ANHA’s OCC of 70.1% does not signal that one survey is superior to the other—it is the consequence of looking at different worlds. The two move in the same direction, but their absolute levels are inherently misaligned. What matters is not asking which is “right,” but cultivating the literacy to identify which statistic and which segment best fit the decision in front of you—an investment, a strategy, an internal review, or international communication.
The practical takeaway for small and mid-sized lodging operators is clear. Use the JTA’s facility-type data that matches your own segment as the baseline, and treat ANHA data as a supplementary signal indicating “how upper-tier players are moving.” When the two statistics trend in the same direction, that should be read as a strong sign of a structural shift across the industry. The simultaneous decline in January 2026, as both statistics equally show, indicates that a “broad and shallow headwind”—softer inbound and weaker business demand—is sweeping the entire industry.
External references: JTA Accommodation Travel Statistics Survey (January 2026, First Preliminary Release) | Monthly Hoteres: All Nippon Hotel Association January 2026 Room Utilization Preliminary | All Nippon Hotel Association (ANHA)