

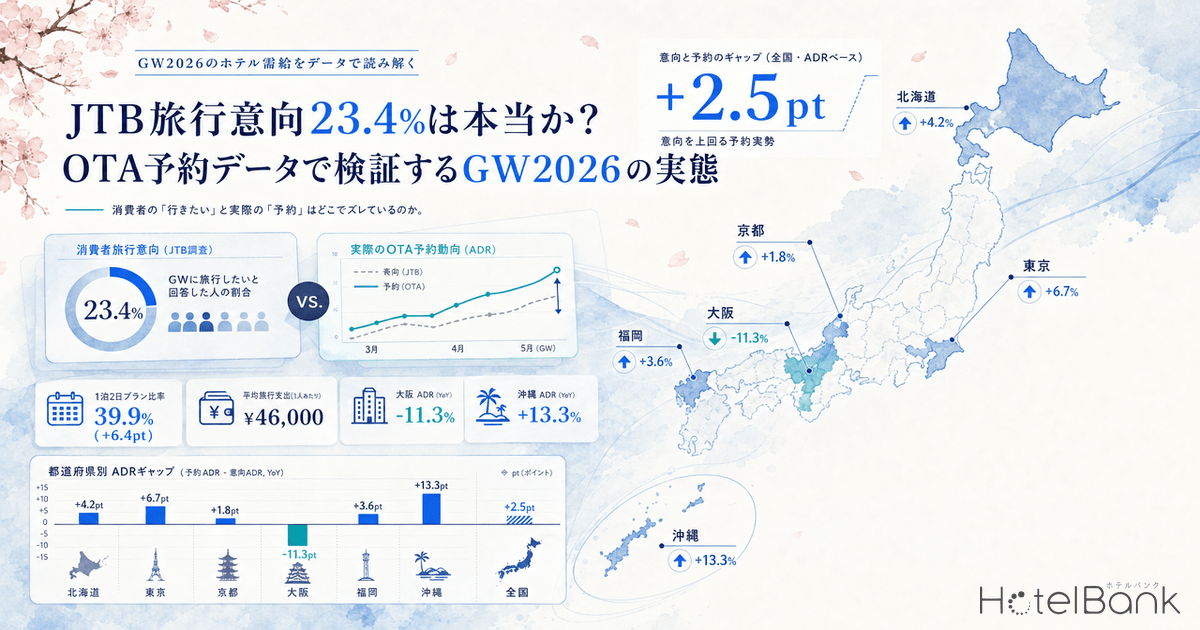

According to JTB’s Golden Week Travel Outlook released on April 2, 2026, the share of consumers expressing travel intent reached 23.4% (+2.5pt YoY), and the total number of travelers is projected at 24.47 million (101.9% YoY) — pointing to firm demand. However, there is always a gap between consumer surveys and actual booking behavior. Drawing on MetroEngines Research’s public-rate data (six major prefectures, approximately 8,800 properties), this article cross-checks JTB’s consumer-survey figures against actual sell-out rates and ADR during the GW period (April 29 – May 6) and verifies the “intent vs. reality gap” by region.
Metric Definitions Used in This Article
- ADR (Average Daily Rate): Average of publicly listed sale prices on OTAs and similar channels. Differs from actual transacted rates. Per-room nightly rate for double occupancy (tax included), averaged across all plan types (room-only through meal-inclusive plans).
- Sell-out Rate: The proportion of plans that had ended OTA bookings as of the survey date. Differs from a property’s overall room occupancy rate.
- Data Source: MetroEngines Research
Key Numbers from the JTB Survey
Let us begin by organizing JTB’s headline indicators. Travel intent of 23.4% is the combined share of “will go” and “probably will go,” up 2.5 points from 20.9% the prior year. At the same time, average travel spending fell to ¥46,000 (97.9% YoY), reflecting a consumer mindset of “wanting to travel but trying to keep spending down.”
| Metric | 2026 GW | YoY |
|---|---|---|
| Travel intent rate | 23.4% | +2.5pt |
| Total travelers | 24.47 million | 101.9% |
| of which: domestic travelers | 23.90 million | 101.7% |
| of which: overseas travelers | 572,000 | 108.5% |
| Total travel spend | ¥1.2876 trillion | 101.1% |
| Average domestic travel spend | ¥46,000 | 97.9% |
| Share of 1-night/2-day trips | 39.9% | +6.4pt |
| Average overseas travel spend | ¥329,000 | 102.2% |
Source: JTB “2026 Golden Week (April 25 – May 7) Travel Outlook”
The most striking shift is the “shortening” of trips. The share of 1-night/2-day trips surged 6.4 points YoY to 39.9%, while every category of two nights or more declined. In other words, even as the number of travelers rises, per-trip spending is being compressed and length of stay is shrinking — a structural change that is now plainly underway.
What OTA Booking Data Actually Shows for GW2026
So what does the actual booking data look like? Drawing on MetroEngines Research data, we tabulated average public rates (ADR) and sell-out rates for the GW period (April 29 – May 6) across six major prefectures. The sell-out rate represents the proportion of surveyed properties whose inventory was fully booked.
| Prefecture | ADR (2026) | ADR (2025) | YoY | Sell-out rate | Properties |
|---|---|---|---|---|---|
| Kyoto | ¥48,900 | ¥45,700 | +7.0% | 23.8% | N=1,660 |
| Okinawa | ¥47,100 | ¥41,500 | +13.3% | 30.2% | N=1,807 |
| Tokyo | ¥41,300 | ¥39,700 | +4.0% | 30.6% | N=1,978 |
| Fukuoka | ¥38,800 | ¥35,500 | +9.2% | 27.9% | N=742 |
| Hokkaido | ¥37,300 | ¥34,000 | +9.6% | 27.7% | N=1,751 |
| Osaka | ¥31,000 | ¥35,000 | -11.3% | 29.1% | N=890 |
Source: MetroEngines Research, compiled by HotelBank Editorial Team (GW period 4/29–5/6, N=8,828 properties)
Across the six prefectures — covering approximately 8,800 properties in total — five posted YoY ADR gains, while Osaka stood out as the only prefecture with a sharp decline of -11.3%. In addition, even Tokyo’s top sell-out rate stayed at 30.6% — a relatively modest level for a Golden Week.
Source: MetroEngines Research, compiled by HotelBank Editorial Team
Intent +2.5pt, Yet Sell-Out Rates Remain Soft — Anatomy of the Gap
JTB’s survey shows travel intent at 23.4% — up 2.5 points YoY — yet OTA-data sell-out rates across all six prefectures cluster between 24% and 35%. How should we interpret this phenomenon of “intent rising but inventory not tightening”?
First, the “shortening” effect that JTB itself flags is significant. With 1-night/2-day trips surging 6.4 points to 39.9%, lodging demand is being spread “broadly but thinly.” Even as traveler counts rise, per-traveler nights of stay decline — so property-level sell-out rates do not rise as much as headline traveler growth would suggest.
Second, the spending-restraint mindset is driving a downward shift in price tier. The fact that average domestic travel spend fell to ¥46,000 (97.9% YoY) suggests consumers are gravitating toward more affordable accommodations. Higher-priced properties are likely carrying empty rooms while lower- and mid-tier business hotels see higher sell-out rates — a polarization that appears to be intensifying.
Source: MetroEngines Research, compiled by HotelBank Editorial Team (GW peak days 5/2–5/5)
Regional Divergence Analysis — Why Only Osaka Moves Against the Trend
At the regional level, JTB’s nationwide “+2.5pt travel intent” headline masks clear differences in actual ADR movement across prefectures. The starkest “divergence” is in Osaka.
Behind Osaka’s solo YoY ADR drop of -11.3% lies the rebound from the special boost provided by the 2025 Osaka-Kansai Expo. The 2025 GW period overlapped with the Expo (April 13 – October 13), inflating Osaka hotel demand well beyond a typical year. Against that elevated comparison base, 2026 has reverted to a normal GW — producing a sharp negative print in the numbers.
Conversely, Okinawa posted the highest gain at +13.3%. Beyond the recovery in inbound demand, this might at first seem inconsistent with JTB’s finding of more 1-night/2-day trips, but Okinawa is fundamentally a resort market where stays of two or more nights are the norm — making it less susceptible to the shortening effect. If anything, more consumers are choosing Okinawa as a substitute for overseas travel, which is contributing to ADR gains.
Kyoto also held firm at +7.0%, but its sell-out rate of 23.8% was the lowest of the six prefectures. This likely reflects both an ongoing increase in lodging supply and a high share of day-trip tourism. Kyoto stands as a textbook example of a region where “travel intent is high but overnight stays do not follow.”
Source: MetroEngines Research, compiled by HotelBank Editorial Team
Demand Concentration on GW Peak Days (5/2–5/5) — Daily Movements
Within the Golden Week period, demand concentrates particularly on the front half of the five-day stretch. Let us look at daily data for Tokyo, Kyoto, and Osaka over the four days from Saturday May 2 through Tuesday May 5 (national holiday).
| Date | Tokyo | Kyoto | Osaka | |||
|---|---|---|---|---|---|---|
| ADR | Sell-out | ADR | Sell-out | ADR | Sell-out | |
| 5/2 (Sat) | ¥53,300 | 39.8% | ¥59,500 | 27.4% | ¥39,400 | 31.2% |
| 5/3 (Sun) | ¥51,700 | 36.1% | ¥60,700 | 30.8% | ¥40,900 | 32.8% |
| 5/4 (Mon, holiday) | ¥46,800 | 34.7% | ¥56,000 | 26.3% | ¥40,600 | 38.7% |
| 5/5 (Tue, holiday) | ¥38,500 | 27.9% | ¥47,100 | 22.8% | ¥31,500 | 30.9% |
Source: MetroEngines Research, compiled by HotelBank Editorial Team
In Tokyo, May 2 logged the highest sell-out rate at 39.8%, with ADR reaching ¥53,300. By May 5, the sell-out rate had fallen to 27.9%, illustrating a rapid demand fade-off into the back half of GW. This is fully consistent with the “shortening” effect that JTB highlights.
Osaka’s pattern is particularly interesting. Although ADR is lower overall than Tokyo or Kyoto, the sell-out rate hit 38.7% on May 4 — a high level for Osaka. The YoY ADR decline reflects the Expo rebound, but on a sell-out-rate basis, underlying demand is solid. In other words, Osaka is showing a structure where “lower prices have actually made bookings easier to capture.”
Source: MetroEngines Research, compiled by HotelBank Editorial Team
Reading Structural Change Through Monthly ADR Trends
Beyond GW alone, looking at monthly ADR trends sharpens the picture of each prefecture’s demand structure. April 2026 monthly ADR was ¥50,300 in Kyoto (+18.6% YoY) and ¥42,600 in Tokyo (+17.4% YoY), both posting double-digit gains — confirming that price increases extend beyond GW into normal weekdays.
However, turning to May 2026 monthly ADR, while Kyoto held firm at ¥45,700 (+20.4% YoY) and Okinawa at ¥28,600 (+10.9% YoY), Tokyo dropped sharply to ¥37,700 (+14.2% YoY) — a notable fall from the GW peak. Because Tokyo demand is anchored by business travel, the post-GW reversal shows up most starkly there.
Source: MetroEngines Research, compiled by HotelBank Editorial Team
How to “Correctly Read” Consumer Surveys Alongside Booking Data
Let us synthesize the implications of this analysis. JTB’s travel intent figure of 23.4% (+2.5pt) is broadly corroborated by actual OTA booking data. With five of six major prefectures posting YoY ADR gains and meaningful sell-out rates observable across the board, the rise in travel demand itself is real.
That said, juxtaposing the two datasets reveals three structural features worth highlighting.
| Finding | JTB survey signal | OTA data reality |
|---|---|---|
| Deepening shortening | 1-night/2-day at 39.9% (+6.4pt) | Sell-out rate plunges right after GW peak 5/2 (Tokyo: 39.8% → 27.9%) |
| Spending restraint | Average spend ¥46,000 (97.9%) | Sell-out stuck around 30% even as ADR rises → vacancy at higher-priced properties |
| Expo rebound | Nationwide +2.5pt intent gain | Osaka alone at ADR -11.3%; yet 29.1% sell-out shows demand exists |
The practical implications for hoteliers are clear. In an environment where modest growth in traveler volume coexists with shorter stays and tighter spending, “first-day capture” matters more than “volume.” Given the sharp drop-off in sell-out rates after the GW opener (5/2), strategies such as early-bird discounts on multi-night plans and flexible pricing for second and subsequent nights are likely to be effective.
Summary
JTB’s consumer survey figures of “23.4% travel intent and 24.47 million travelers” align broadly with OTA booking data, confirming that GW2026 travel demand exceeds last year. However, applying the three filters of “shortening,” “spending restraint,” and “Expo rebound” reveals that the on-the-ground reality differs significantly by region.
Osaka in particular — where a double-digit ADR decline is hard to predict from JTB’s optimistic “+2.5pt nationwide” headline — urgently needs a pricing strategy rebuild for the post-Expo “new normal.” Meanwhile, Okinawa and other resort-style demand remains firm, reaffirming the polarization in consumer travel preferences between “nearby, short, low-spend” and “distant resort, high-experience.”
Combined with the latest Japan Tourism Agency Overnight Travel Statistics Survey (January 2026: nationwide room occupancy 53.1%), Japan’s hotel market is in a transition phase where “demand growth” and “dispersion” are advancing simultaneously. Going forward, continued cross-checks of consumer surveys against actual booking data will be essential to capture the real state of the market from multiple angles.
Note on future-dated ADR: The ADRs in this article are averages of sale prices listed on OTAs at the time of survey, and they fluctuate as the check-in date approaches. Note that prices currently set high may decline through last-minute discounting.