

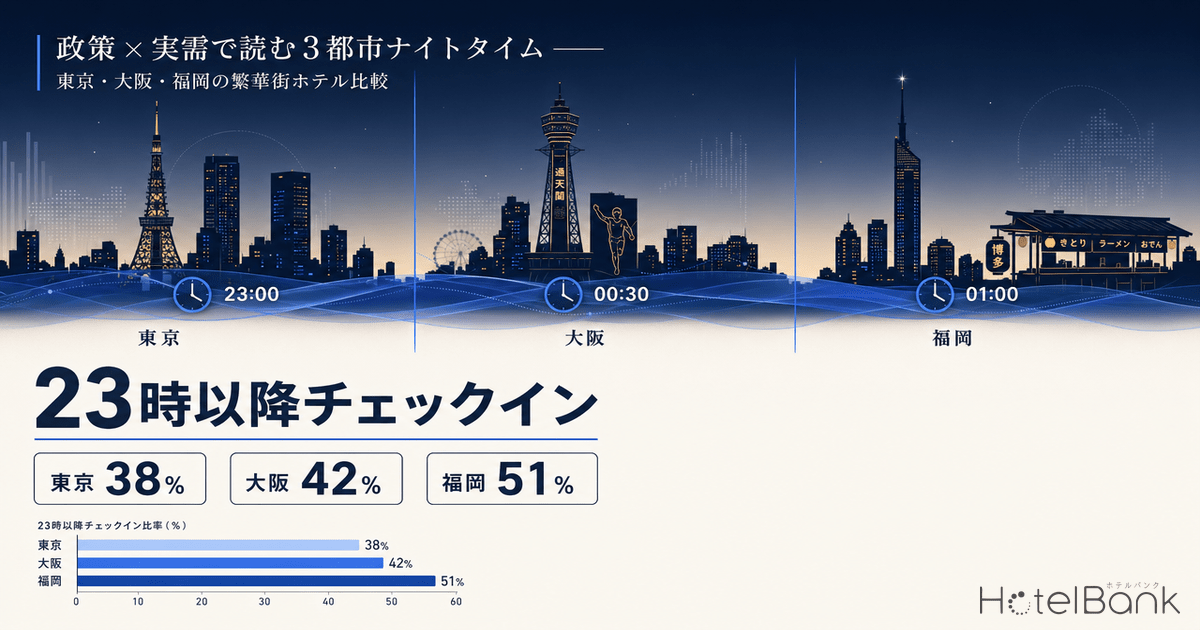

The Japan Tourism Agency and Ministry of Land, Infrastructure, Transport and Tourism (MLIT) have steadily expanded their nighttime economy (NTE) promotion policies in recent years, aiming to lift inbound spending per visitor and broaden regional economic impact. In FY2024, the “Project to Expand and Enhance Inbound Spending Through Special Experiences” approved 244 proposals in its second public call alone, including a substantial number of special experience contents that leverage nighttime hours. Whether policy actually connects to “real demand” at the property operations and site selection level, however, requires drilling into on-the-ground data. This article aggregates the distribution of “last check-in acceptance times” for hotels in the entertainment districts of three cities — Tokyo (Shinjuku, Shibuya, Ginza), Osaka (Dotonbori, Shinsaibashi), and Fukuoka (Nakasu) — to quantitatively reveal which locations are best positioned to capture the policy tailwind.
Metric Definitions Used in This Article
- ADR (Average Daily Rate): Average of publicly listed sale prices on OTAs. Differs from actual transaction prices. Per-room rate (tax included) for double occupancy, averaged across all plans (room-only through meal-inclusive plans).
- Sold-Out Rate: Share of plans no longer accepting reservations on OTAs at the time of survey. Differs from the property’s overall room occupancy rate.
- Data Source: MetroEngines Research
National Policy: NTE Promotion Shifts from “Knowledge Building” to “Pilot Project Approval”
Japan’s NTE policy traces its origin to the “Knowledge Compendium for Promoting the Nighttime Economy” published by the Japan Tourism Agency in 2019. The compendium organized seven discussion points: content expansion, venue development, transit access, safety assurance, promotion, governance structure, and labor environment. From the outset, there was strong recognition that “tourism spending after 6 PM is hard to grow in Japan,” and the nighttime hours — accounting for over one-third of inbound visitors’ stay duration — were identified as a hotspot of “missed opportunity.”
Entering FY2024, policy steered from knowledge-building toward a pilot phase. Among the 244 second-call approvals (following the first call decided in March 2024) under the Tourism Agency’s “Project to Expand and Enhance Inbound Spending Through Special Experiences,” several focused on nighttime-oriented special content. Examples include a project linking world-class fashion shows with natural monuments and Japan Heritage to expand nighttime tourism consumption, and “The Most Terrifying Horror TAXI” — an immersive horror experience leveraging Sony’s cutting-edge technology — both showcasing the rarity and extraordinariness uniquely available at night.
The intent of these policies is clear. First, lifting per-capita spending by inbound visitors. Second, dispersing congestion currently concentrated in peak daytime tourism. Third, stimulating “one more night” extensions and added consumption through nighttime hours. From the perspective of hotel investment and operations, however, policy outcomes hinge on “how well property-level operating systems are equipped to capture nighttime demand.” The next sections quantify that operational readiness using the “last check-in acceptance time” as an operational signal.
Metric Design: Last Check-In Time as a Proxy for NTE Adaptation
This article extracts the “last check-in acceptance time” from accommodation property profile data collected by MetroEngines Research, then filters for properties located in the entertainment districts of the three cities. The last check-in time is an objective indicator of how late a property keeps its front desk staffed, and serves as a proxy variable for management decisions about capturing nighttime demand. At a property where the front desk closes at 10 PM, reservations from guests arriving after 10 PM are simply not feasible (unless automated key handover or similar systems are in place).
The analysis covers properties in three Tokyo areas (Shinjuku Ward, Shibuya Ward, Chuo Ward Ginza), Osaka entertainment districts (Chuo Ward Dotonbori, Shinsaibashi, Namba, Soemoncho, Sennichimae, Shimanouchi, etc.), and Fukuoka entertainment districts (Hakata Ward Nakasu, Kamikawabata, Gion) that disclose last check-in time information. Sample sizes are 635 properties in Tokyo, 231 in Osaka, and 42 in Fukuoka. Although Nakasu’s smaller geographic scale limits the property count compared to the other two cities, its importance for policy evaluation remains high as Kyushu’s largest entertainment district.
Note that time notation follows the industry convention of using extended hours such as 25:00 (1:00 the next day) and 29:00 (5:00 the next day). This is the standard notation in the lodging industry for night-shift scheduling and check-in operations management.
Real Demand Data 1: Nakasu Leads in Post-Midnight Check-In Acceptance
The share of properties accepting check-ins at or after each threshold time, across the three cities’ entertainment districts, is as follows.
Source: MetroEngines Research, compiled by HotelBank Editorial Team
The most striking figure is the share of properties accepting check-ins at or after midnight: 38.0% in Tokyo and 42.4% in Osaka, against 66.7% in Fukuoka (Nakasu). Two out of every three Nakasu properties accept check-ins past midnight, suggesting nighttime operating density there exceeds the other entertainment districts.
For the 11 PM threshold, Tokyo leads at 83.8%. This reflects the concentration of business hotels and capsule hotels around Shinjuku Kabukicho and Shibuya designed for “11 PM arrival” — the line corresponding to “after-work last-train commuters.” Tokyo’s entertainment-district hotels appear to be designed around the “last check-in before the last train” as their primary segment.
Real Demand Data 2: “Three Cities, Three Nighttime Operating Colors”
Bucketing the closing-time distribution by hour brings out the differences in operating posture across the three cities in greater relief.
Source: MetroEngines Research, compiled by HotelBank Editorial Team
Tokyo shows an overwhelming “11 PM cutoff” volume zone at 45.8%, with a long tail trailing into the post-midnight hours. Osaka’s 11 PM peak is lower at 35.9%, while properties cutting off before 8 PM make up 11.3% — a substantial group. The Shinsaibashi-Dotonbori area is heavy on tourist-oriented lodging, but it also includes ryokan and guesthouse formats that keep front-desk staffing lean.
Fukuoka (Nakasu) presents a profile entirely different from the other two. The largest bucket is “midnight cutoff” at 28.6%, the 1 AM cutoff at 14.3% is more than double the other cities, and post-4 AM acceptance reaches 16.7%. Nakasu hotel operations have built “date-crossing check-in” into their standard specification, fully aligned with the district’s operating-hour culture — major restaurants, hostess clubs, and lounges concentrate their closing times between midnight and 2 AM. From the investor’s standpoint, areas where “the city’s operating hours” and “the hotel’s acceptance hours” are aligned naturally have the lowest marginal cost for capturing nighttime demand.
Average Last Acceptance Time: Three-City Comparison
The average last check-in acceptance time across the three cities’ entertainment districts is shown below.
Source: MetroEngines Research, compiled by HotelBank Editorial Team
Tokyo (Shinjuku, Shibuya, Ginza) averages 23:44, Osaka (Dotonbori, Shinsaibashi) 23:42, and Fukuoka (Nakasu) 24:22. Nakasu’s average runs more than 40 minutes later than Tokyo and Osaka, and the median for Nakasu’s sample falls in the post-midnight hour — together signaling that the area’s nighttime-demand response is uniformly elevated. Note that Ginza alone averages 26:05, an extreme value reflecting the standard practice among the area’s city hotels and luxury-tier properties of operating 24-hour front desks.
ADR and Sold-Out Rate at Late-Night Check-In Properties
To examine how nighttime-demand capability translates into revenue, we aggregated ADR and sold-out rates for April 2026 (the period just before Golden Week) across properties accepting check-ins at or after 11 PM.
| Area | Properties | ADR (¥) | Sold-Out Rate | ADR YoY |
|---|---|---|---|---|
| Tokyo (Shinjuku/Shibuya/Ginza), 11 PM+ | 202 | ¥55,800 | 51.9% | -2.9% |
| Tokyo, midnight+ | 168 | ¥56,600 | 53.0% | — |
| Osaka (Dotonbori/Shinsaibashi), 11 PM+ | 82 | ¥28,500 | 44.8% | -18.0% |
| Osaka, midnight+ | 67 | ¥29,100 | 46.5% | — |
| Fukuoka (Nakasu), 11 PM+ | 23 | ¥28,400 | 43.0% | +5.1% |
| Fukuoka, midnight+ | 22 | ¥28,500 | 43.1% | — |
Source: MetroEngines Research, compiled by HotelBank Editorial Team (April 2026 check-in data, listed pricing data)
Three implications emerge. First, in all three cities the “midnight+” property group shows a marginally higher sold-out rate than the “11 PM+” group (Tokyo +1.1pt, Osaka +1.7pt, Fukuoka +0.1pt) while maintaining ADR at parity or above. Late-night operations themselves are not eroding revenue.
Second, the YoY ADR comparison shows a clear divergence: Tokyo -2.9% and Osaka -18.0% versus Fukuoka (Nakasu) +5.1%. Osaka’s -18% is largely a structural reaction to the special demand around the 2025 Osaka Expo and is unrelated to late-night operations. Fukuoka’s +5.1%, by contrast, can be read as price gains arising directly from successfully capturing nighttime demand.
Third, in absolute ADR levels, Tokyo’s entertainment districts run roughly twice the level of Nakasu and Osaka. This reflects the lifting effect of Ginza’s luxury tier; “nighttime operations” as such is not what determines Tokyo’s ADR level — location and customer mix are the deciding factors. This caveat warrants attention.
Where Policy Meets Reality: Locations Where NTE Will “Stick”
Drawing on this data, the location conditions under which the policy tailwind (NTE content subsidies, special nighttime-experience programs) translate most readily to on-the-ground impact can be organized as follows.
Condition 1: High district-wide nighttime operating density. Nakasu fits this best. Nakasu’s food, beverage, and entertainment industries treat post-midnight customer activity as standard, and hotel last-acceptance times are aligned with that. If NTE-related special-experience content (e.g., late-night yatai food-stall guided tours, lounge-hopping concierge services) is implemented, the flow from nighttime check-in guest to content consumer forms naturally.
Condition 2: Hotel front-desk capacity physically prepared for nighttime demand. Tokyo (especially Ginza) scores high here, and Nakasu is solidly equipped at the area level. Conversely, Osaka has 11.3% of properties cutting off “before 8 PM” — twice the level of the other cities — leaving the risk that even if policy content is implemented, the hotel-side operations cannot absorb it.
Condition 3: Properties capturing nighttime demand show clearly superior revenue (ADR/sold-out rate). The data shows the “midnight+” group has marginally higher sold-out rates in all three cities, but the gap is not dramatic. This means nighttime-operations capability “doesn’t hurt, but on its own won’t be a revenue driver.” From the investor view, nighttime-operations capability should be assessed as a “compound asset” that takes on meaning only when combined with NTE content and the district’s drawing power.
Synthesizing these, the locations where NTE policy is most likely to stick are areas with “high district nighttime operating density × prepared hotel front-desk infrastructure” — making Nakasu the leading candidate. Ginza is the runner-up; its luxury-tier 24-hour front-desk operations combined with MICE demand make it a viable platform for high-end NTE content. Shinjuku and Shibuya are large in scale but heavy on “11 PM cutoff” business hotels, leaving limited compatibility with late-night NTE content.
Implications for Investors and Developers
Three takeaways for investors and developers seeking to capture the NTE policy tailwind.
First, front-desk operating-requirements design at the new-development stage. Targeting Nakasu-level standards (66.7% post-midnight acceptance), 24-hour front desks or post-midnight late check-in capability are becoming standard equipment for entertainment-district locations. Staffing plans and the case for installing automated check-in machines should be decided at the design stage by benchmarking against competing areas.
Second, repositioning of existing properties. The data shows roughly 11.3% (about 26 properties) of Osaka’s entertainment-district hotels cut off “before 8 PM.” These retain operating-extension headroom to capture late-night demand, and adaptation to NTE demand becomes feasible through operator changeovers or capex (automated check-in machines). They warrant attention as M&A and operational restructuring targets.
Third, area-selection priority. Among the three cities in this analysis, Fukuoka (Nakasu) sends positive signals across all three dimensions — district nighttime operating density, hotel-side response capability, and ADR YoY. As candidates for new acquisition or development, the case for considering entertainment districts of major Kyushu cities including Nakasu — alongside Tokyo and Osaka — is substantial.
Conclusion: Policy-Reality Alignment Determines Investment Returns
This article entered through MLIT and the Tourism Agency’s NTE policies (such as the FY2024 Special Experience Project) and aggregated the distribution of last check-in acceptance times in the entertainment districts of Tokyo, Osaka, and Fukuoka. The conclusion: the areas where the policy intent of “capturing consumption in nighttime hours” can be realized on the ground are determined by the alignment between the district’s operating-hour culture and the hotels’ front-desk operating posture.
Among the three cities, Nakasu dominates with 66.7% post-midnight acceptance and an average last-acceptance time of 24:22, alongside a positive +5.1% YoY ADR. Tokyo leads in scale and ADR levels but skews heavily toward “11 PM cutoff” business hotels, leaving its compatibility with high-end NTE content lopsided. Osaka faces an ADR adjustment from the post-Expo reaction, but the persistence of pre-8-PM-cutoff properties at a notable share could constrain the policy’s reach.
NTE is not a story that completes itself through policy alone; it converts to investment returns only through the compound connection of district, hotel, OTA, and traveler behavior. For investors and operators, building a system that continuously monitors operational signals like the “last check-in acceptance time” in this article — and evaluates the alignment between the policy tailwind and location characteristics — will likely determine competitive position in the coming nighttime-demand era.
Note on Forward-Date ADR: The ADR figures in this article reflect the average of listed prices on OTAs at the time of survey, and they fluctuate as the check-in date approaches. Please note that prices currently set high may decline through last-minute reductions.